
Seismic Assessment of RC Frame Structure by Nonlinear Static Pushover Analysis.
- Syed Md Tajdik Ahmed
- Mishkat Zahan Mishe
- Fatema-Tuz- Zahura
- 201-216
- Jul 29, 2024
- Architecture
Seismic Assessment of RC Frame Structure by Nonlinear Static Pushover Analysis.
Syed Md Tajdik Ahmed1, Mishkat Zahan Mishe1, Fatema-Tuz- Zahura2
1Department of Civil Engineering, Faculty of Engineering, Ahsanullah University of Science & Technology, 142-143 Love Road, Tejgaon Dhaka, Bangladesh
2Associate Professor, Department of Civil Engineering, Faculty of Engineering, Ahsanullah University of Science & Technology, 142-143 Love Road, Tejgaon Dhaka, Bangladesh
DOI: https://doi.org/10.51244/IJRSI.2024.1107012
Received: 07 June 2024; Accepted: 22 June 2024; Published: 29 July 2024
ABSTRACT
Bangladesh is located in a seismically active area, and the rising number of earthquakes has alarmed the local population. Major cities of Bangladesh are under a serious threat due to defective design and structural construction. If seismic do not take under consideration building could be severely damaged under seismic loads. Thereby, taking consideration into the alarming matter, BNBC, (2017) is an upgraded version of the previous code. BNBC, (2017) has provisions for both elastic and inelastic methods of analysis for structures under strong ground motion. BNBC, (2017) proposed an equivalent static load method to design the buildings; “which yields good results within the elastic limit but it cannot predict the nonlinear behavior of the structure beyond the elastic limit”. Pushover analysis, a nonlinear technique with a few approximations and simplifications, can predict the degree of damage caused by a seismic event. Pushover analysis was specifically proposed in ATC 40, (1996) and FEMA 356 (2000). The pushover analysis approach of ATC 40, (1996), as included in “ETABS,”(2017), has been examined in this study in an effort to show its efficacy and validity(KHAN, 2013).
Keywords: Capacity spectrum curve, Nonlinear hinge, Performance point, Target Displacement, Story Drifts.
INTRODUCTION
Bangladesh is considered one of the top listed vulnerable earthquake-prone countries. The earthquake measuring Richter Scale results may not capture the accurate picture of the devastation, but in reality, because of the densely populated areas and the poorly designed structures, the aftermath is unimaginably significant. Hence, this situation must be evaluated and improved to save countless lives in the future by putting in act a seismic evaluation of all the structures including current and future.
In the recent past substantial number of earthquakes having magnitude more than 7.0 on Richter scale took place in the southeast part of the area where the epicenters were within Bangladesh and India region (Ali and Choudhury, 1992).
The list of major earthquakes and their aftermath of the surroundings in Bangladesh is quite alarming for it to be taken into account and act adequately (Islam, Jameel and Jumaat, 2011). In 1997, Chittagong Earthquake (SABRI, S.A, 2002)in 1999 Moheskhali Earthquake (Ansary and Al-hussaini, 2016) and in 2003 Rangamati Earthquake (Ansary, 2003)and many more unfortunate incidents of the earthquake and the affected areas lead us to believe, unless the correct measure is taken, these rural and urban areas in the south part of Bangladesh which are “Non earthquake proof” region will suffer enormously due to this unavoidable natural calamity. For instance, In 1897, in the northeastern part of India and Bangladesh (former Eastern India), 1542 people died and several buildings were destroyed due to an earthquake (Richter Scale-8.0). The authors argued all the measures mentioned in their specified article require to perform a seismic evaluation of the structures within the city and villages too. According to BNBC, (2017), Different seismic analysis techniques, including the equivalent static force method, response spectrum approach, and time history method, are used to design Bangladeshi buildings. Some of these are easy to use and some aren’t. But these methods are hardly useful for finding the actual performance of a structure. On the contrary, nonlinear inelastic pushover analysis gives a better and easy understanding of the actual behaviors of the structures during earthquakes. But unfortunately, this method is not very well-known to many structural engineers, which has a huge range of applicability in seismic evolution and also in retrofitting structures. FEMA 356 ,(2000)and ATC 40, (1996) are the two guidelines for seismic analysis.
“Extensive research studies have already been carried out regarding the performance of concrete structures by pushover analysis” (KHAN, 2013). Krawinkler and Seneviratna, (1998) have studied the pros and cons of Pushover Analysis, various methods of pushover analysis, and their aspects, implementation. Ynel, Tjhin and A.M., (2003) checked the accuracy of load patterns used in the pushover analysis. Vojkokilar and Fajar, (1998) studied simple pushover analysis for asymmetric building structure. Chopra, Anil and Goel, K, (2002) developed a dynamic analysis which is Modal Pushover Analysis (MPA). Chintanapakdee and Chopra,K., (2003) examined the accuracy of Modal Pushover Analysis. Sasaki, Freeman and Paret, (1998) studied on collapse mechanisms of buildings. They conducted that multi-mode pushover analysis can identify failure mechanism due to higher mode using independent load patterns. Habibullah and Pyle, (1998) investigated on “Practical three-dimensional Nonlinear Static Pushover Analysis” and from that elastic and also post-yielding behavior of structure and also post-yielding can be identified by using isolated user-defined hinges.
In Bangladesh, significant pushover analysis work has also been done with an emphasis on seismic deficiencies and solutions, stiffness irregularity in the vertical direction, and soft-story vulnerability(KHAN, 2013). “Nonlinear time history analysis for RC frames with brick masonry infill has also been carried out Anam and Muyeed-Ul-Azam, (2006). They studied the nonlinear moment-curvature (M-φ) relationship of beam and column sections and used them in nonlinear dynamic analysis to determine the performance of different structural methods. However, the accuracy of pushover analysis in comparison to more rigorous nonlinear time history analysis is yet to be studied. Also, it is important to ascertain whether building frames designed by BNBC, (2017) are capable of fulfilling the targeted performance levels” (KHAN, 2013).
METHODOLOGY
2.1 Pushover Analysis:
Pushover analysis is more likely an estimated static analysis method. Various types of force are applied to the building. The forces are then increased monotonically and also the distribution is height-wise invariant. This process is done until a target displacement is formed. Pushover analysis is such a static analysis by which it could be understood that when the building will collapse partially or fully while going through its inelastic range under various increasing loadings.
These increasing loadings or forces develop a plot of base motion versus deformation curve. From this curve, the largest base motion can be found that the structure can resist. For this analysis, a model has to be made where all load-resisting elements and their force-deformation relationship, both before and after yielding, and also the dead load and live load have to assemble.
2.2 Purpose of Pushover Analysis:
Mainly the purpose of pushover analysis is to determine structure’s performance under incremental loading. It is done by pushover analysis comparing the demand (strength and deformation) to existing capacities on the basis of performance levels. Important performance perimeters like global drift, inter-story drift, elements, and connection forces, and also inelastic element deformation between elements are used in this analysis (Krawinkler and Seneviratna, 1998). One of the advantages of this analysis is it provides much information that can’t be obtained from elastic static and dynamic analysis such as:
- Estimation of the deformation demands for components of the structure that have to deform beyond elastic limit so that the structure can release the energy imparted by ground motion.
- Understanding of different kinds of force demands like axial force demand on columns, shear force demand in deep reinforced concrete spandrel beams, moment demand on beam to column connection, etc.
- Result of structure’s strength reduction and the behavior of the structure.
- Identification of the critical region, strength discontinuities of the adequacy of loading path by considering all the elements, connections etc. and also evaluation of P- delta effects and inter-story drifts.
2.3 Background:
The pushover analysis is assumption-based. There is no appropriate theoretical establishment. “The basic assumption is that the response may be connected with the equivalent Single degree of freedom (SDOF). That is, the response is controlled by a single mode, and the shape vector remains constant throughout the time history response. Both of these assumptions are invalid” (KHAN, 2013). However, some researchers have discovered that these predictions aid in obtaining more acceptable results about the maximum response of the MDOF (Multi Degree of Freedom) structure when seismic events occur in a single mode.
Although several strategies rely on the form vector and dynamic equilibrium equation, the details of the same SDOF framework is not extraordinary. Krawinkler and Seneviratna, (1998) have suggested following Equation 1 to Equation 9
![]() (1)
(1)
“Where in Equation 2
[M] = mass matrices
[C] = damping matrices
{X} = relative displacement vector
{Q} = story force vector
Xg = ground acceleration.” (Krawinkler and Seneviratna, 1998)
The relative displacement vector can be written as Equation 2
![]() (2)
(2)
In Equation 3 putting the value of {X} from Equation 2:
[M] {φ}Xt +[C] {φ}Xt+ {Q}=-[M}{1}Xg (3)
“Define the SDOF reference displacement xr as:
Xr = [({φ}T [M]{φ})/({φ}T [M]{1}) ] Xt (4)
The governing differential equation for response of the comparable SDOF system is obtained by multiplying Equation 3 by T and replacing for x with Equation 4:” (Krawinkler and Seneviratna, 1998)
Mrxr+ Crxr+ Qr= -Mrxg (5)
Where Equation 6, 7, 8 are: (FEMA 356 ,2000)
Mr={φ}T[M]{1} (6)
Qr={φ}T[Py] (7)
Cr={φ}T[C] {φ} [({φ}T [M]{φ}{1})/({φ}T [M] )] (8)
[Py] is the story force vector at yield.
The corresponding SDOF system’s initial period (Teq) can be calculated as equation (9):
Teq =2π√(Mr/Kr ) (9)
Kr is the corresponding SDOF system’s elastic stiffness. The corresponding SDOF system has these fundamental components. Finding the goal displacement level is necessary to advance the analysis and comprehend the evaluation (Krawinkler and Seneviratna, 1998).
2.4 Target Displacement:
The top displacement of a structure’s components when subjected to an earthquake’s design excitation is known as target displacement (KHAN, 2013). A lateral load which is constantly increasing (inertia forces) is subjected to the structure until this target displacement is achieved. A relationship will be established between the base shear force and the lateral displacement of the control node when the displacement target displacement is between 0 and 150%. The first point of the curve in these combined curves should align 60% with the effective yield strength’s capacity curve. On the other hand, at the desired displacement point, the second portion of the curve would converge with the capacity curve.
2.5 Capacity Spectrum Method:
According to the capacity spectrum technique, the goal displacement establishes the building performance level (ATC 40, 1996). Figure 1 shows the response spectrum as a function of spectral acceleration (Sa) and period (T) (KHAN, 2013). The capacity spectrum method represents a force-displacement pushover curve which is shown in figure 2. This curve identifies the structure’s capacity with respect to seismic demand (Tafheem et al., 2016). The capacity spectrum curve is obtained from the lateral force vs lateral displacement using model shape vector. The capacity of the structure is then compared to the seismic demand by plotting the response spectrum and capacity spectrum in the same plot (Hancilar et al., 2010). “The response spectrum has to be changed into spectral acceleration (Sa) vs spectral displacement (Sd) shown in figure 3 which is known as acceleration displacement response spectrum (ADRS)” (KHAN, 2013). Also the seismic demand has to change into ADRS form as capacity curve and the demand curve are in the same format (FEMA 356 ,2000).
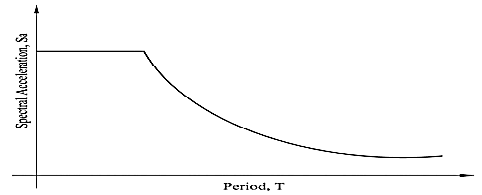
Figure 1. Spectral acceleration vs. period for the code-specified response spectrum
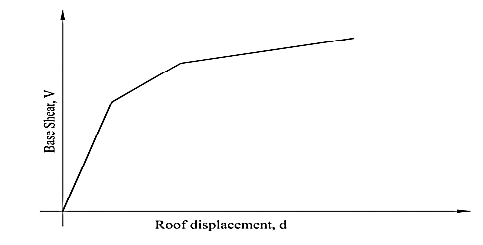
Figure 2. A typical capacity curve
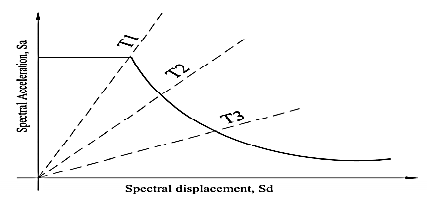
Figure 3. Response spectrum in ADRS format
ADRS form describes a period T, related to spectral acceleration and spectral displacement by the following Equation 10:
![]()
“From the typical capacity curve base shear vs roof displacement figure 2, if at any point with base shear Vi and the roof displacement ∆i converted to the point of spectral acceleration, Sai and spectral displacement, Sdi by the following equations (11) and (12)”(KHAN, 2013).
Sai =(Vi⁄W )/α1 (11)
and Sdi =∆roof /(PF1×Φ1,roof ) (12)
Here PF1 represents the modal participation factor and α represents the modal mass coefficient which is used to convert
the capacity curve to capacity spectrum. These two factors are calculated by the following equation (13) and equation (14):
PF1= ![]() (13)
(13)
and α = ![]() (14)
(14)
“Where:
Φ1, roof = roof level amplitude of the first mode.
Wi/g = mass assigned to level i
Φi1 = amplitude of mode 1 at level i
N = level N, the level which is the uppermost in the main portion of the structure
W = building dead weight plus likely live loads
∆roof = roof displacement” (KHAN, 2013).
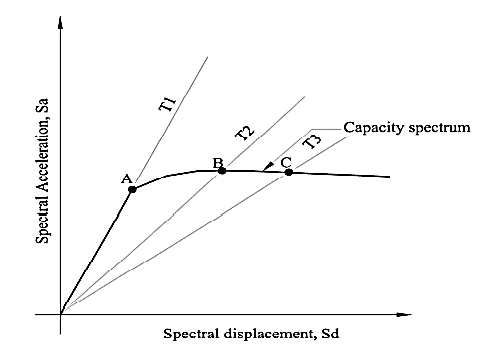
Figure 4. Capacity spectrum
As can be observed from the capacity spectrum curve in figure 4, the capacity spectrum remains constant at point A up to a certain displacement time T1. The structure is acting elastically at this moment. When the period is T2, the structure behaves like it is deforming inelastically when it deflects to point B. The structure’s performance point is determined using the capacity curve’s demand spectrum and converted into ADRS form. After the performance points have been established, the structure’s performance may be determined. To assess capacity, demand (displacement), and performance, there are three key components that must be present. Here, the subjects are thoroughly discussed. (Tafheem et al., 2016)
2.5.1 Capacity:
Structural behavior after exceeding their elastic limit can be determined from the capacity curve. Structural strength and deformation capacities of the individual elements can be identified by capacity curve. A typical capacity curve is needed to perform non-linear pushover analysis which is a series of different types of straight-line segments having a different kind of decreasing slope, which represents different types of events of the structure at different lateral displacements. So, by evaluating the cumulative effects of damage by increasing lateral displacement at each event, a total lateral displacement can be determined and also can be shown in the figure 5. As indicated in figure 5, this represents restrictions on different structural performance levels (ATC, 1996).
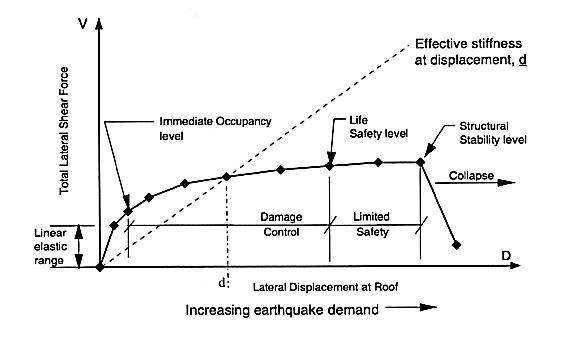
Figure 5. Total Lateral Shear Force Vs Lateral displacement at roof (Typical Capacity Curve)
2.5.2 Demand (Displacement):
During earthquake, it is unclear of the structural response to the ground motion due to the complex mechanism property of structural elements and also due to the variety of ground motion which may vary in time. So, a maximum response of the structure has to be approximated during ground motion which is known as displacement demand (FEMA 356 ,2000).
2.5.3 Performance:
The capacity spectrum curve in figure 6 shows the performance point, which is where the structure’s greatest inelastic capacity may be located(SABRI, S.A, 2002). According to (ATC 40, 1996), this performance point demonstrates where the capacity curve and the demand curve intersect. The performance point can be evaluated by two main approaches: Capacity-Spectrum Method of (ATC 40, 1996) and Coefficient Method of (FEMA 356 ,2000) Capacity-Spectrum Method is likely more appropriate and easy to approach to perform. In the Capacity-Spectrum Method of (ATC 40, 1996) a base shear Vs. displacement relationship is generated for the structure, then a performance based seismic analysis technique starts. After that, the resultant values are changed into an acceleration-displacement response spectrum (ADRS). Acceptance limit describes that the structural and infrastructural components do not damage in this performance limit. (KHAN, 2013)
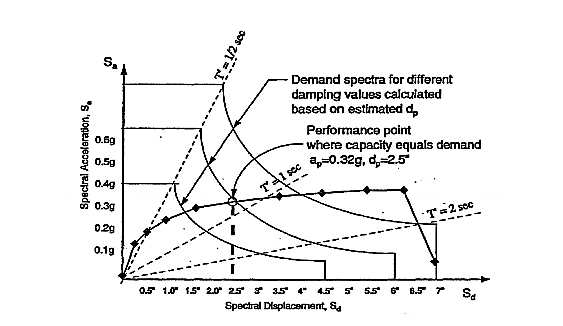
Figure 6. Determination of Performance Point Adopted from ATC 40, (1996)
Table 1 represent the performance level of building which describe about the operation level (OL), immediate occupancy level (IO), life safety level (LS), collapse prevention (CP) of the building. FEMA 356 (2000)
Table 1 Performance level of building
| Level | Description |
| Operational level (OL) | It causes very light damage. No permanent drift has occurred. The structure retains core strength and rigidity. In structural elements, the partition wall and ceilings show the major cracking. |
| Immediate occupancy level (IO) | At this level, there has been no permanent drift but very light damage has occurred. The structure retains core strength and rigidity. Minor cracks were observed in the partition wall and structural elements. Lifts are okay to start. Fire protection can also be run. |
| Life Safety Level (LS) | Some moderate damage, some permanent drift, in all stories stiffness was found and some residual strength in addition to the damage to partition, a building may be considered structurally damaged and need repairing. |
| Collapse Prevention | The amount of damage is fatal, large displacement occurred. The structure cannot retain core strength and rigidity. The column which bearing loads of the structures and wall function indicate that the building is nearing collapse. |
2.6 Non-Linear Plastic Hinge:
The nonlinear hinge of the frame defines the force vs displacement and also the moment rotation behavior of the structure which is used in static nonlinear analysis. The point of inelastic action of the structural member is known as a plastic hinge. Structural members start to lose strength to overcome the deformation. Hence, to observe the structural behavior of losing strength at different performance levels due to seismic effects, hinges are provided to the model. The following figure 7,force and displacement curve shows the structure’s performance level (FEMA 356 ,2000).
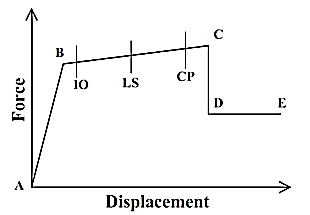
Figure 7. Force vs Displacement curve of a hinge
In this curve point, A shows the operating level of the structure. The load-displacement is linear from point A to B. Point B represent the yielding of the element. At points B to C the stiffness reduces. Point C shows the ultimate capacity for the analysis (KHAN, 2013). The points in B to C describe the acceptance for the hinge and that is the Immediate Occupancy Level (IO), Life Safety Level (LS), Collapse Prevention (CP) according to FEMA 356 ,(2000). Point D represents the remaining strength limit of the structure. After this limit, building began to collapse and point E shows a complete failure of the structure and at this point hinges are breakdown (ATC 40, 1996).
2.7. P-∆ Effects:
The P-delta effect is an important factor for pushover analysis as it increases the lateral displacement in a significant way. Interstory drift and the target displacement may increase by negative post-yield stiffness (CNCRP Manuals Seismic Design of Reinforced Concrete Buildings, 2015). P-∆ effects are the secondary effect of lateral deflection and column axial loads in the shear and overturning moment at the base of a significantly tall structure. These effects cannot be simply explained with linear procedures. P-delta effect is involved with so many parameters that it’s not easy to understand by a single modification factor. But it also cannot be ignored due to its significant effects of increasing displacement which might also lead to collapse. However P- delta effect can be neglected if the stability coefficient (θ) is not more than 0.10 (BNBC, 2017). The following equation (15) is the stability coefficient:
θ=(Px∆)/ (VxhsxCd) (15)
Where, 𝑃𝑥 = Total vertical design load at and above level 𝑥;
Where computing 𝑃𝑥, no individual load factor can exceed 1
∆ = Design story drift occurring simultaneously with 𝑉𝑥
𝑉𝑥 = Storey shear force acting between levels 𝑥 and 𝑥 − 1
ℎ𝑠𝑥 = Storey height below level 𝑥.
𝐶𝑑 = Deflection amplification factor.
MODELING AND ANALYSIS OF THE BUILDING
For analysis purpose a 5 storied building with 4×3 bays reinforced concrete frame structure which is located in Chittagong is selected. The structure is fixed at its support. The building has been designed in “ETABS,” (2017) according to BNBC, (2017). The building is modeled as a bare frame without infill walls. Figure 8 shows the plan view of the building.
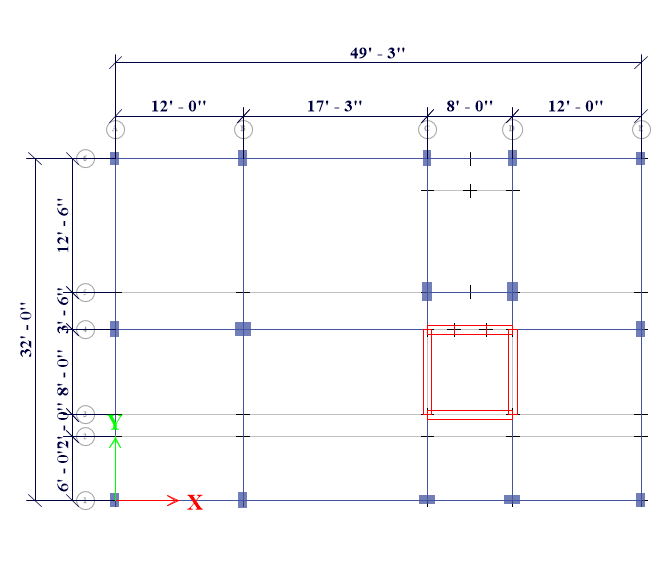
Figure 8. Plan view of the building
The plan of the building is symmetrical and the typical floor height is 10ft and the base height is 8ft. The dimension of the structural bay is non-uniform. The cross-sectional properties of the structure are shown in table 2. Table 3, table 4, table 5 and table 6 which consists of the materials properties, loads, seismic loads parameters and modeling parameters according to BNBC, (2017) respectively.
Table 2. The cross-sectional properties of the structure
| Column 1 | 12”×15” | Beam 1 | 12”×15” |
| Column 2 | 12”×18” | Beam 2 | 12”×18” |
| Column 3 | 15”×18” | Beam 3 | 12”×21” |
| Column4 | 12”×21” | Stair Beam | 12”×18” |
| Grade Beam 1 | 10”×12” | Slab thickness | 5 inch |
| Grade Beam 2 | 12”×15” | Shear wall thickness | 10 inch |
Table 3. Material properties
| Property | Concrete | Reinforcement |
| Ultimate Strength (ksi) | 4 | 60 |
| Modulus of Elasticity (Ksi) | 3600 | 29000 |
Table 4. Loads on building
| Load | Floor | Roof | Stair |
| Live Load (Psf) | 41.78 | 60.58 | 100.27 |
| Floor Finish (Psf) | 16.4 | 9.99 | 16.4 |
| Partition Wall (Psf) | 44.70 | ||
| Wall load on Beam = 0.51k/ft | |||
Table 5. Seismic loads parameters according to BNBC, (2017) and (ASCE 7-05)
| City | Chittagong |
| Seismic Zone coefficient (Z) | 0.28 (Zone 3) |
| Occupancy Category | 2 (For residential building) |
| Structural Importance Factor (I) | 1.00 |
| SPT N value | 25 (15-25) |
| Soil Type | Deep deposits of dense or medium dense sand, gravel or stiff clay with thickness from several tens to many hundreds of meters |
| Site Class | SC |
| Soil Factor (S) | 1.15 |
| Seismic design category | D (Stringent seismic detailing) |
| Response reduction factor (R) | 7 (Duel systems special moment frames capable of resisting at least 25% of prescribing seismic forces with bracing or shear wall for special reinforced concrete shear wall ) |
| System overturning factor (Ω) | 2.5 |
| Deflection amplification factor (Cd) | 5.5 |
| Structure type | Concrete moment-resisting frame
Ct = 0.0466 m = 0.9 |
| Height of the structure in meters from foundation or from top of the rigid basement (hn) | 19.81 m |
| Building period (T) | T= Ct(hn)m = 0.685sec |
| Spectral response Acceleration parameters | Ss = 0.7
S1 = 0.28 |
| Site coefficient | Fa = 1.15
Fv = 1.725 |
Table 6. Modeling Parameters
| Element | Beams and columns are made up of linear elements, while slabs are made up of shell elements. |
| P-delta effect | P-delta effect has been considered (Non-iterative based on mass) |
| Hinge property | At each end of the column P-M2-M3 hinges are considered
At each end of the beam, M3 hinge is considered. |
| Diaphragm | Shell element for slab (Rigid) |
| Support | Fixed |
3.1 Nonlinear Static Analysis:
Push over analysis is done by applying equivalent static seismic load patterns according to BNBC, (2017) and also all the load cases are defined and assigned as per the same code. Hinge properties are assigned as per ATC 40, (1996) and FEMA 356 ,(2000). For Beam, hinge of flexure (M3) and shear (V2) are assigned at the end of the beam, and axial force and bending moment (P-M2-M3) are considered at the end of the column. Two nonlinear static load cases are added along with X and Y directions. The geometrical nonlinearity effect which is P-delta effect and large displacement is also considered. Gravity load is applied to the building and then the lateral load is also applied. Horizontal displacement at the top of the corner is monitored for roof displacement. After the design, the nonlinear static pushover analysis has been performed. The pushover curve, performance point, hinge result displacement, and story drift are determined from this analysis.
RESULTS AND DISCUSSION
The nonlinear static analysis has been performed in “ETABS,” (2017). Pushover curve shown in figure 9 is obtained from the analysis according to ASCE 41-13 NSP. The maximum target displacement obtained from this curve for the long direction and the result is of magnitude 4.264602 inches and the base shear is 628.833 kip.
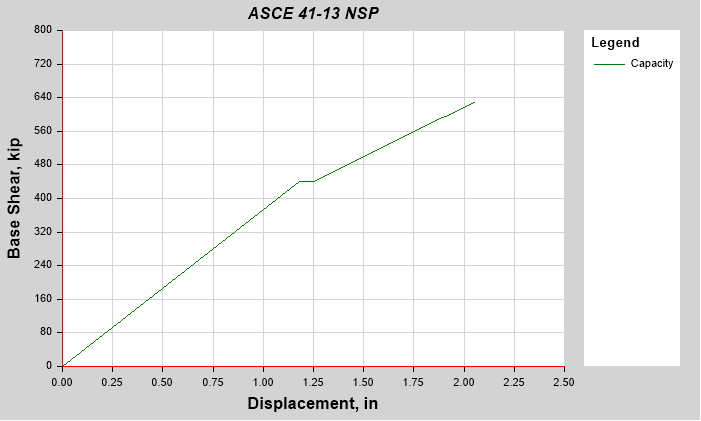
Figure 9. Pushover curve of the 6 story building
The performance point is obtained from the capacity spectrum curve as shown in figure 10 according to FEMA-440. The capacity spectrum curve shows the spectral acceleration Sa vs spectral displacement Sd relationship. The curve represents the frame’s fundamental behavior in terms of stiffness and ductility. The performance point is obtained from the curve. The capacity curve and demand curve are plotted in ADRS format in figure 10. The effective period and the effective damping were also found from the performance point. The demand spectrum of 5% damping is also controlled by the seismic coefficient. From the figure 10 performance point (Sa, Sd) of the structure for serviceability is 0.094895g, 0.743163in. At this performance point base shear is 440.681 kip and the displacement is 1.239565 inches. The effective period (Teff) is 0.881 sec and the effective damping ratio (Beff) is 0.0504. The ductility ratio is 1.084987.
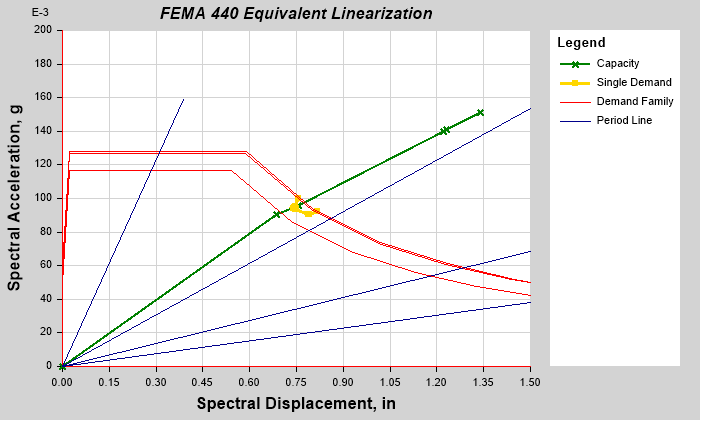
Figure 10. Capacity spectrum curve and performance point
Frame nonlinear hinge properties are used to determine the structure moment rotation behavior. The hinges are applied to the structure based on ATC 40, (1996) and FEMA 356, (2000,) At the end of the column P-M2-M3 and the end of the beam, M2 hinges are applied. Due to the seismic effect, the strength of the structure has been observed by assigning hinges. The hinge properties are designed by using “ETABS,” (2017) for concrete members. This property cannot be changed and also cannot be seen because of the section-dependent properties. Until the section to which they apply is identified, the default properties cannot be properly defined by the program. Thereby, to reveal the effect of the default properties, they should be designated to a frame element. Then the obtained hinge property should be evaluated. The plastic hinges result at different performance levels. Hinges were formed with beams and columns for the bottom story for both frames and then they spread to the top stories, continuing the yield of internal columns for the top stories. The following figure 11 and figure 12 shows the concrete moment and P-M2 hinges at X and Y direction and figure 13 and figure 14 shows concrete moment and M3 Hinge at X and Y direction.
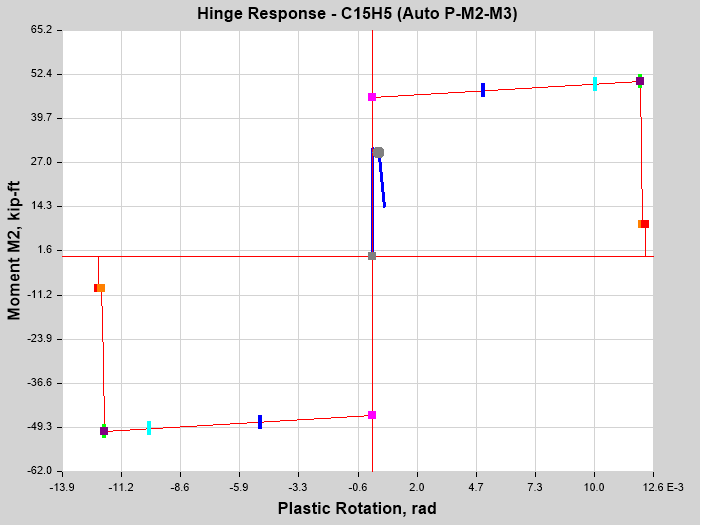
Figure 11. Concrete moment and P-M2 hinge at X direction
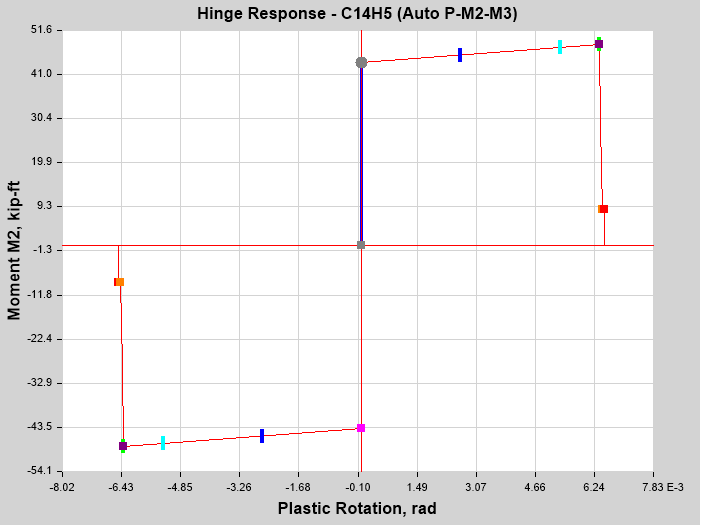
Figure 12. Concrete moment and P-M2 hinge at Y direction

Figure 13. Concrete moment and M3 Hinge at X direction
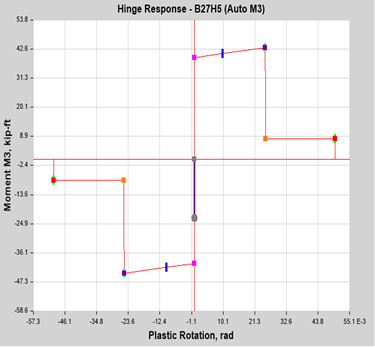
Figure 14. Concrete moment and M3 Hinge at Y direction
From the following figure 13 and 14, the slope is taken 10% total strain hardening for steel. At the performance point, no hinges are crossing the IO-LS limit. The requirement for the design of earthquake is, no hinges will cross the Life safety limit (LS). The following structure satisfies this requirement. The Story drift ratio for design earthquake should be less than the maximum life safety (LS) allowable limit 0.02. The following figure 15 and figure 16 shows the story drift ratio at EQX and EQY, which do not cross the life safety limit.
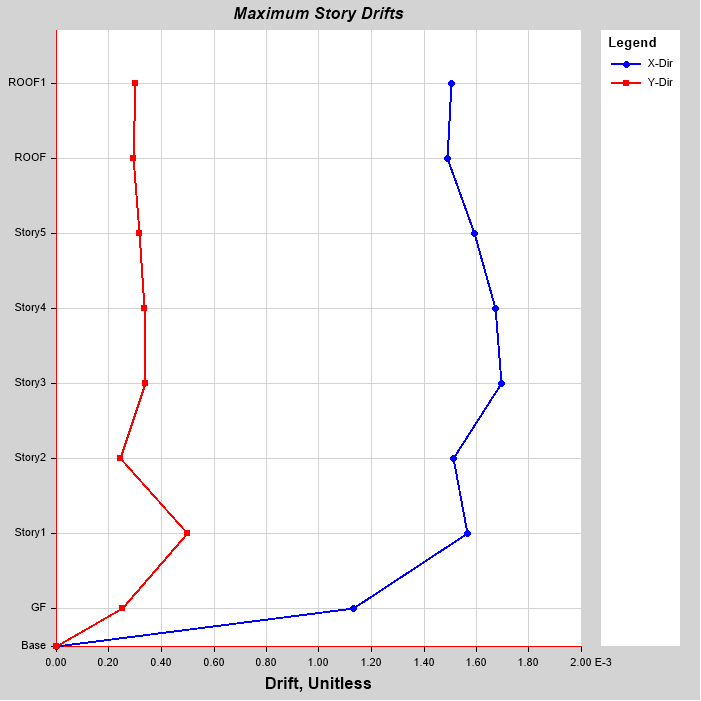
Figure 15. Story drift ratio for load case EQX
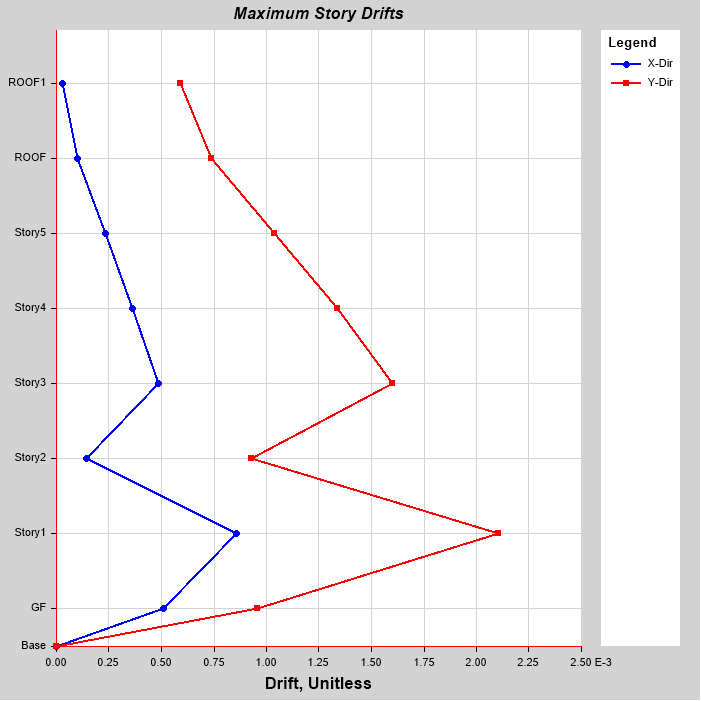
Figure 16. Story drift ratio for load case EQY
Maximum story displacement can be defined as the maximum displacement of a node situated at the top floor or roof of the building from its original location. According to BNBC, (2017) allowable maximum story displacement is L/500 where, L is the total height of the building in inches. From figure 17 and figure 18, the allowable maximum displacement for the structure is 1.55984 inch. The building can be considered as less stiff if the maximum story displacement is higher. Figure 17 and figure 18 shows the maximum story displacement for EQX and EQY which do not exceed the allowable limit. So the following structure satisfies the requirement.
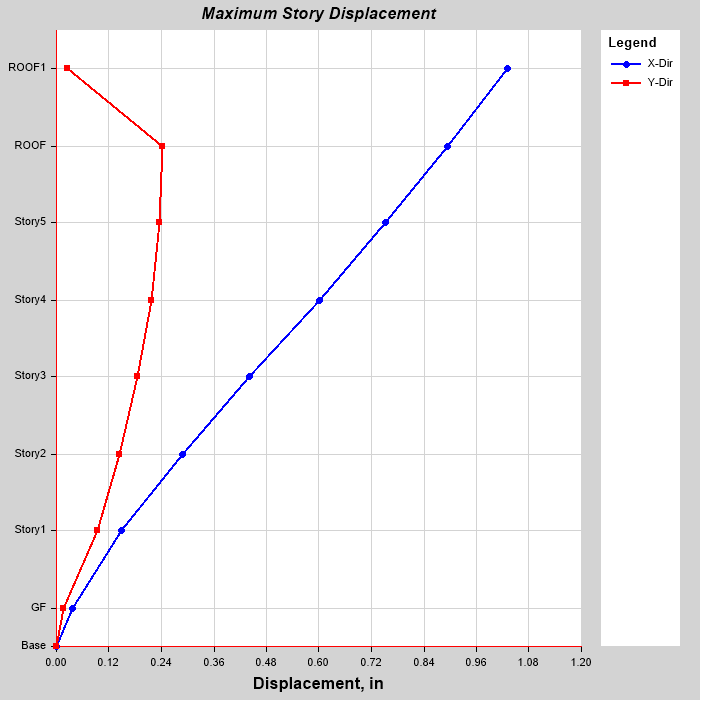
Figure 17. Maximum Story displacement for EQX
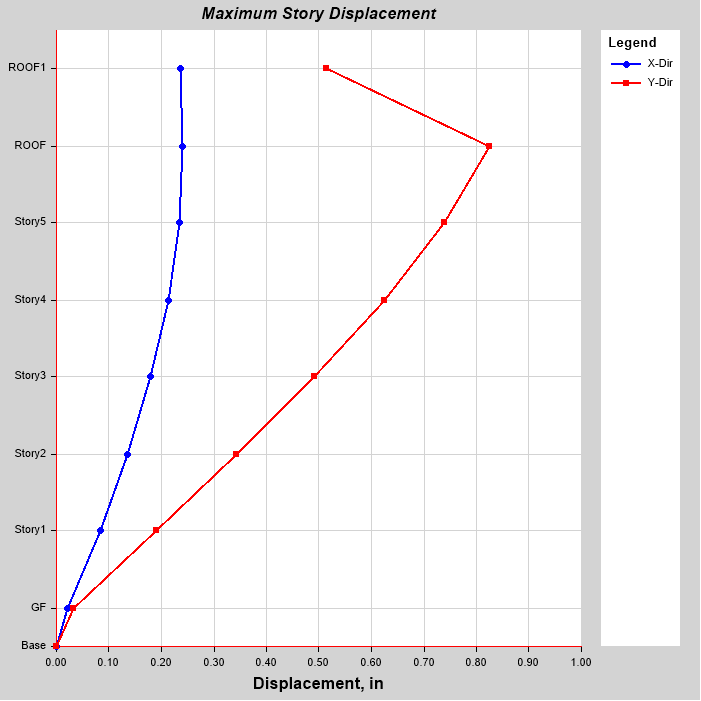
Figure 18. Maximum Story displacement for EQY
CONCLUSION
Pushover analysis for the reinforced concrete frame structure has been evaluated. Pushover analysis can identify the weak element of the structure predicting the failure mechanism. The performance point of the following structure is at IO level. Performance of building frames designed as per BNBC, (2017) has been evaluated using pushover analysis, against targeted performance levels for serviceability, design and maximum earthquakes and found to satisfy the ATC 40, (1996) local and global requirements. The target displacement, nonlinear hinge property, the maximum story drifts and maximum displacement all the criteria have been full filled. The building easily satisfies the seismic requirements of ATC 40, (1996). The nonlinear static analysis was a suitable approach to explore the nonlinear behavior of the structure and for assessing the inelastic strength and deformation demands and, most important, for exposing the design weakness of the structure.
REFERENCE
- Ali, M. and Choudhury (1992) “No Title,” paper presented at 36th annual convention of the institute of engineers, Bangladesh, 1: 4-8.
- Anam, I. and Muyeed-Ul-Azam, H.M. (2006) “Seismic behavior of nonlinear RC frames with masonry infills,” Wind and Earthquake Engineering – Proceedings of the 10th East Asia-Pacific Conference on Structural Engineering and Construction, EASEC 2010, 3, pp. 393–398.
- Ansary, M.. (2003) No Title. Bangladesh University of Engineering & Technology, Bangladesh.
- Ansary, M. and Al-hussaini, T. (2016) “Damage assessment of July 22 , 1999 Moheshkhali Earthquake , Bangladesh,” (March).
- ATC 40 (1996) ATC 40 Seismic Evaluation and Retrofit of Concrete Buildings Redwood City California, Seismic safety commisionsion.
- BNBC (2017) Bangladesh National BUILDING CODE (BNBC).
- Chintanapakdee, C. and Chopra,K., A. (2003) “Evaluation of modal pushover analysis using generic frames,” Earthquake Engineering and Structural Dynamics, 32, pp. 417–442. Available at: https://doi.org/https://doi.org/10.1002/eqe.232.
- Chopra, Anil, K. and Goel, K, R. (2002) “A modal pushover analysis procedure for estimating seismic demands for buildings,” Earthquake Engineering and Structural Dynamics, 31, pp. 561–582. Available at: https://doi.org/https://doi.org/10.1002/eqe.144.
- CNCRP Manuals Seismic Design of Reinforced Concrete Buildings (2015). Dhaka.
- Engineers, A.S. of C. (no date) “ASCE 7-05,” SEISMIC DESIGN CRITERIA, pp. 57–109.
- “ETABS” (2017). Berkeley, California: Computers and Structures Inc. (CSI).
- FEMA 356 ,2000 (no date).
- Habibullah, A. and Pyle, S. (1998) “Practical Three Dimensional Nonlinear Static Pushover Analysis,” Structure Magazine, 2(April), pp. 1–4. Available at: http://computersandengineering.de/downloads/technical_papers/CSI/PushoverPaper.pdf.
- Islam, A., Jameel, M. and Jumaat, M.Z. (2011) “Seismic isolation in buildings to be a practical reality: Behavior of structure and installation technique,” J. Eng. Technol. Res, 3(4), pp. 99–117. Available at: http://www.academicjournals.org/JETR/PDF/pdf 2011/Apr/Islam.pdf.
- KHAN, N.M. (2013) EVALUATION OF SEISMIC PERFORMANCE OF RC FRAME STRUCTURES BY PUSHOVER AND TIME HISTORY ANALYSES.
- Krawinkler, H. and Seneviratna, G.D.P.K. (1998) Pros and cons analysis of seismic evaluation, Engineering Structures.
- SABRI, S.A, M. (2002) No Title. BUET. Available at: https://www.scribd.com/document/443529070/Sabri-MSc-BUET-2002-pdf.
- Sasaki, K.., Freeman, S.. and Paret, T.. (1998) “Multimode pushover procedure (MMP)—A method to identify the effects of higher modes in a pushover analysis.,” S In Proceedings of the 6th US national conference on earthquake engineering [Preprint]. Available at: ftp://128.46.154.21/ayhan/Prasanth/Multi-Mode Pushover Procedure (SASAKI).pdf.
- Tafheem, Z. et al. (2016) “EARTHQUAKE RESPONSE ANALYSIS OF A MULTISTORIED RC BUILDING UNDER EQUIVALENT STATIC AND DYNAMIC LOADING AS PER BANGLADESH NATIONAL BUILDING CODE 2006,” Malaysian Journal of Civil Engineering, 28(1), pp. 108–123.
- Vojkokilar and Fajar, P. (1998) “Simple push over analysis of asymmetric buildings,” Earthquake Engineering & Structural Dynamics, 26, pp. 233–249.
- Ynel, M., Tjhin, T. and A.M., A. (2003) “The Significance of Lateral Load Pattern in Pushover Analysis,” Istanbul Fifth National Conference on Earthquake Engineering, Paper No:(Istanbul, Turkey).