
Spent Foundry Sand (SFS)-Gum Arabic Admixed Concrete: X-Ray Diffraction, Microstructure, Acid and Sulphate Analysis
- Elinwa, Augustine Uchechukwu
- 1653-1683
- Sep 23, 2024
- Engineering
Spent Foundry Sand (SFS)-Gum Arabic Admixed Concrete: X-Ray Diffraction, Microstructure, Acid and Sulphate Analysis
Elinwa, Augustine Uchechukwu
Department of Civil Engineering, Faculty of Engineering and Engineering Technology, Abubakar Tafawa Balewa University, P.M.B 0248, Bauchi, Bauchi State, Nigeria.
DOI: https://doi.org/10.51244/IJRSI.2024.1108127
Received: 13 August 2024; Accepted: 20 August 2024; Published: 23 September 2024
ABSTRACT
Concrete sustainability studies have opened opportunities in the use, and understanding of the characteristics, and performances of supplementary cementing materials (SCMs) using modern methods of investigation. The effect of spent foundry sand (SFS) with replacement levels of 10 and 20 % by wt. % of the fine aggregate (FA), 0.5 % dosage of gum Arabic (GA) on concrete, and its performance in acid and sulfate medium are presented. The investigations are carried out using crushed compressive strength test samples, prepared using a mix of 1: 3: 5, and cured for 28 days in water. The XRD analysis studied the crystalline and mineral phases of the concrete, the SEM-EDS analysis, the morphology (texture) and structural characteristics of the concrete samples, while the Acid and Sulphate analysis to understand the effects of these media on SFS-GA concrete. The results show that SFS and GA have acceptable characteristics for quality concrete. The XRD and SEM results show marked transformations in the crystalline and mineral phases, the morphology and structural characteristics of the hydration products of the concrete samples, because of the addition of GA and SFS, respectively. The performances of the concrete samples with GA and SFS, in the HNO3 medium show better performances than in the H2SO4 medium and better performances in Na2SO4 than in the MgSO4 medium with acceptable characteristics for quality concrete. The XRD and SEM results show marked transformations in the crystalline and mineral phases, the morphology and structural characteristics of the hydration products of the concrete samples, because of the addition of GA and SFS, respectively. The performances of the concrete samples with GA and SFS, in the HNO3 medium, show better performances than in the H2SO4 medium and better performances in Na2SO4 than in the MgSO4 medium
Keywords: XRD, SEM, Acid and Sulphate analysis, Gum Arabic; Spent foundry sand concrete.
INTRODUCTION
Concrete and its sustainability in the construction industry have become critical concerns arising from many prevailing factors such as CO2 emission and durability issues. One of the steps in reducing the environmental impact on sustainability is the use of supplementary cementing materials (SCMs) in concrete. One of its advantages in the construction industry is the safeguard and preservation of the ecosystem and environmental assets, while also providing durable construction. The use of industrial waste in concrete will always offset the shortage of environmental resources. However, the use of supplementary cementing material (SCM) comes with its own attendant problems such as variabilities in the material, processing conditions adopted, and the environment where the SCMs are sourced.
There are many classes of SCMs of which spent foundry sand (SFS) and gum Arabic are some of them. Spent foundry sand (SFS) is the by-product of the foundry industry containing a high-quality silica sand which is a byproduct from the production of both ferrous and nonferrous metal casting. The physical and chemical characteristics of spent foundry sand (SFS) material will therefore depend largely on the type of casting process and the industry sector from which it originates. Gum Arabic on the other hand, is a complex mixture of
glycoproteins and polysaccharides which are predominantly polymers of arabinose and galactose. Several researchers have investigated the suitability of these materials in concrete production. They have been primarily used as partial replacement of fine aggregate, and an emulsifier and admixture [1]. Their suitability has also been confirmed for concrete productions. The SFS is a pozzolana and proved to reduce water absorption by about 8 % to 28 % at 90 days but decreased the compressive strength. Kumar et al [2] researched on the tensile, splitting, flexural strengths and microstructural properties of concrete after curing for 1Corresponding Author, email: auelinwa@atbul.edu.ng / GSM: 0806504037690 days. They used replacement levels of 10 to 50 % of WFS, and analyzed using the SEM, EDS, and TGA/DCs methods of analyses. They concluded that the strength differences that occurred when fine aggregates are replaced with waste foundry sand in different proportions are better understood. An experimental investigation to study the influence of spent foundry sand (SFS) as partial replacement of fine aggregate on two grades of concrete mixtures was carried out by Rafat et al [3]. They used two control concrete mixtures M20 and M30, designed to have compressive strengths of 30 MPa and 40 MPa at 28 days of curing. The fine aggregate was replaced by SFS in proportions of 0 % to 20 % by wt. % of fine aggregate and compared with the originals (M20 and M30), cured for 365 days. They concluded that the test results showed marginal increase in strength and durability properties. Rafat et al [4] also studied the effect of used foundry sand on the mechanical properties of concrete using 10 %, 20 %, and 30 % to replace fine aggregate by wt. %, and cured for up to 365 days. Results showed marginal increase in the strength properties of plain concrete by inclusion of UFS as partial replacement of fine aggregate and can be effectively used in making quality concrete and construction material.
Sustainability of concrete is also enhanced by admixtures, which not only modifies the workability of concrete but also prolongs the life of the concrete, and it is considered a SCM. Gum Arabic falls into the class of admixtures with emulsifying effects. Mohammed et al [5] investigated the durability and microstructure properties of concrete with gum biopolymer admixture. The X-ray diffraction and SEM tests are to determine the rate of hydration and expose the microstructure properties of AGB cement mix and help explain its macroscopic behavior, respectively. Some of the findings were that the XRD results showed almost similar hydration pattern of AGB cement relative to the OPC cement, and. the scanning electron microscopy (SEM) of AGB concrete showed less voids dispersed in the AGB mix microstructure. They, therefore, concluded that the use of AGB can be beneficial as a water- reducing admixture in the construction sector resulting in decrease in the chemical admixture demand. The influence of GA admixture on the mechanical properties of lime-metakaolin paste used as binder in hemp concrete was carried out by Brzyski [6]. The paste was modified with powdered gum Arabic at 1 to 5 %, by mass as a partial replacement for the binder mix. The influence of the admixture on the pore size distribution as well as flexural and compressive strengths were investigated. The admixture enhanced the total porosity of the paste and the compressive and flexural strengths. Gum Arabic and sawdust ash (SDA) were used to address some of the gaps between pozzolanic and conventional concretes [7]. The concrete mixtures were designated as M_00, M-00-GA, M-10-GAS, and M-30-GAS with a GA dosage of 0.5 % by wt. 5 of cement and SDA replacement by wt. % of 10 %, and 30 %, respectively, and cured for 28 days. The results showed that 28 days of curing used for the conventional concrete in stripping the formwork, may not be appropriate for use on pozzolanic concrete. Therefore, he proposed for a strength beyond the 28 days of curing to carter for the pozzolanic effects which starts well above 28 days
The attendant problems associated with using SCMs in concrete have been stated above, it calls for further research works and documentation. This will enhance knowledge on their interactions in concrete, and therefore the proper understanding of their characteristics, use and applications in concrete production. It is therefore no doubt, incorporating SCMs in cement-based materials modifies the pore network and composition of the main hydration product, calcium (-aluminate)-silicate-hydrate (C(-A)-S-H) [5]. Another area of concern is the susceptibility of these materials in concrete, in acid and sulphate environments. This is because of their alkaline nature which has a lot to do with the hydraulic nature of cement, The hydraulic properties of cement depend quite substantially on the specific mineralogical phase and its relative abundance in cement and supplementary cementing materials (SCM). The qualitative and quantitative phase analyses of the components of cement are, therefore, very important to understand and predict the performance of cement and SCMs, and the resulting concrete [8 Ref]. Sulphuric acid is particularly corrosive due to the sulphate ion in addition to the dissolution caused by the hydrogen ion causing the deterioration of cement-based materials [9]. Different studies have demonstrated that durability problems in Portland cement concrete are associated with the decalcification of C-S-H and the formation of new products [10, 11]. The addition of supplementary materials to Portland cement systems such as hospital ash waste [12], rice husk ash [13] and groundnut husk ash [14] reduce the proportion of portlandite present in the mixture, and therefore, contribute to the refining of the pore structure. This results in lower concrete permeability and consequently higher resistance to attack from certain aggressive agents [15, 16]. Therefore, in this study, GA-admixture and SFS are used. The aim is to assess the effects of these SCMs on concrete in an acid or sulphate medium, using X-ray diffraction and scanning electron microscopy, to study the crystalline and mineral phases, and the morphology and structural characteristics of the concrete samples containing GA and SFS materials, respectively. These studies are important because of reinforcement rusting in concrete, and are carried out using crushed compressive cube samples (100 mm) cured for 28 days with a concrete mix of 0 to 20 % SFS replacement by wt. % of fine aggregate and 0.5 % GA.
MATERIALS CHARACTERISTICS
2.1. Physical and Chemical Properties of Concrete Materials
Tables 1-5 are the characteristics of the materials used for the investigations cement, SFS, GA-admixture, and the fine and coarse aggregates. The physical and chemical properties of the ‘Ashaka’ Portland cement conformed to BS EN 196 [17], and that for fine and coarse aggregates, to BS EN 12620 [18] The SFS conformed to ASTM D7765-18a [19]. The GA- admixture conformed to BS EN 934 [20].
Table 1: Physical and Chemical Properties of Cement
| Physical Property | ||
| Parameter | Value | |
| Specific gravity | 3.15 | |
| Blaine fineness (m2kg-1 | 375 | |
| Loss on Ignition (%) | 1.0 | |
| Soundness (mm) | 8.0 | |
| Consistency (%) | 33 | |
| Initial Setting Time (min.) | 143 | |
| Final Setting Time (min.) | 196 | |
| Chemical Property | ||
| Oxide Composition | Weight (%) | |
| SiO2 | 19.68 | |
| Al2O3 | 6.44 | |
| Fe2O3 | 3.32 | |
| CaO | 60.92 | |
| MgO | 0.97 | |
| SO3 | 2.28 | |
| K2O | 0.85 | |
| Na2O | 0.12 | |
Spent foundry sand (SFS) is a uniformly graded material and often contains metal from the casting and oversized mold and core material containing partially degraded binder. SFS may also contain some leachable contaminants, including heavy metals and phenols that are absorbed by the sand during the molding process and casting operations [21]. Table 2 is the physical and chemical characteristics of SFS.
Table 2: Physical and Chemical Properties of Spent Foundry Sand
| Physical Properties | |
| Parameter | Value |
| Specific Gravity | 2.54 |
| Bulk Density (kg/m3) | 2589 |
| Moisture Content (%) | 3.11 |
| LOI | 0.93 |
| Chemical Properties | |
| Oxide Composition | Spent Foundry Sand |
| SiO2 | 82.71 |
| Al2O3 | 10.20 |
| Fe2O3 | 3.92 |
| CaO | 0.98 |
| MgO | 0.15 |
| SO3 | 1.32 |
| K2O | -0.06 |
| Na2O | 0.29 |
| P2O5 | – |
| Mn2O3 | – |
| TiO2 | – |
| CaCO3 | – |
Gum Arabic structure consists mainly of high molecular weight polysaccharides and their magnesium, calcium, and potassium salts which of hydrolysis yield galactose, arabinose, glucuronic acid and rhamnose. Table 3 shows the physical and chemical properties of GA.
Table 3: Physical and Chemical Properties of Gum Arabic
| Property | Value |
| Density | 1.35-1.49 |
| Molecular Wt./Molar Mass | 0.25 x 10⁶ |
| Boiling Point | 250oC |
| Melting Point | 0-100oC |
| Odour | Odorless |
| Appearance | Glassy Appearance |
| pH | 4.5 |
| Emulsifying Properties | 50 % |
| Solubility (In Water) | 43-48 % |
| Chemical Properties | |
| Oxides | Weight. % |
| SiO2 | 8.36 |
| K2O | 0.76 |
| CaO | 3.47 |
| MnO | 0.07 |
| Fe2O3 | 0.22 |
| NiO | 0.03 |
| SrO | 0.06 |
| Y2O3 | 0.003 |
| Nb2O5 | 0.05 |
| MoO3 | 0.26 |
| Ag2O | 0.02 |
Table 4: Physical Properties of Fine and Coarse Aggregate
| Parameter | Aggregate/Value | |
| Fine | Coarse | |
| Specific gravity | 2.48 | 2.00 |
| Silt content (%) | 4.32 | – |
| Bulk Density (kgm-3) | 1648 | 1607 |
| Aggregate crushing value (%) | – | 16.00 |
Table 5: Sieve Analysis of the Fine and Coarse Aggregate
| Fine Aggregate (%) | Coarse Aggregate (%) | Spent Foundry Sand (%) | ||||
| Sieve Size (mm) | Retained | Passing | Retained | Passing | Retained | Passing |
| 75.00 | – | – | 0.00 | 100.00 | – | – |
| 63.00 | – | – | 0.00 | 100.00 | – | – |
| 50.00 | – | – | 0.00 | 100.00 | – | – |
| 37.00 | – | – | 25.00 | 75.00 | – | – |
| 28.00 | – | – | 24.10 | 50.92 | – | – |
| 20.00 | – | – | 21.96 | 28.96 | – | – |
| 14.00 | – | – | 17.04 | 11.92 | – | – |
| 10.00 | – | – | 6.36 | 5.56 | – | – |
| 6.00 | – | – | 4.08 | 1.48 | – | |
| 5.0 | 0.00 | 100.00 | 1.10 | 0.39 | 0.00 | 100.00 |
| 3.35 | 0.00 | 100.00 | 0.39 | 0.00 | 0.00 | 100.00 |
| 2.00 | 13.96 | 86.04 | – | – | 0.00 | 100.00 |
| 1.18 | 11.44 | 74.59 | – | – | 0.54 | 99.46 |
| 0.60 | 40.31 | 34.29 | – | – | 1.54 | 97.92 |
| 0.425 | 18.80 | 15.49 | – | – | 2.17 | 95.75 |
| 0.30 | 5.18 | 10.31 | – | – | 6.21 | 89.54 |
| 0.212 | 6.74 | 3.57 | – | – | 29.8 | 59.74 |
| 0.15 | 1.10 | 2.47 | – | – | 32.5 | 27.24 |
| 0.075 | 0.70 | 1.77 | – | – | 16.8 | 10.44 |
| Receiver | 1.77 | 0.00 | – | – | 10.44 | 0.00 |
2.2. X-Ray Diffraction Characteristics of the SFS and GA 2.2.1: Spent Foundry Sand
The XRD diffractograms of SFS is shown in Figure 1, while the crystalline phases and mineral peaks are shown in Table 6. The XRD diffractogram of the gum Arabic is shown in Figure 2 and it is amorphous.
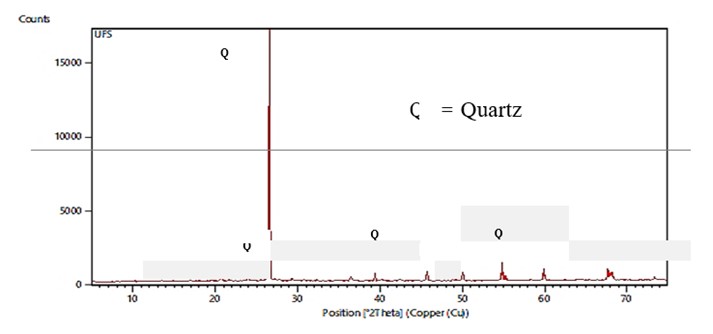
Figure 1: XRD Diffractogram of Spent Foundry Sand (SFS)
Table 6: XRD Peaks of Spent Foundry Sand
| Pos. [°2Th.] | Height [cts] | FWHM Left [°2Th.] | d-spacing [Å] | Rel. Int. [%] |
| 20.0892 26.7624 | 53.34 17500.36 | 0.1574 0.4723 | 4.23553 3.33121 | 0.30 100.00 |
| 39.5255 | 38.28 | 0.4723 | 2.28003 | 0.22 |
| 49.9133 55.0237 | 89.55 67.76 | 0.0984 0.4723 | 1.84524 1.70876 | 0.51 0.39 |
| 60.6416 | 51.24 | 0.0787 | 1.52709 | 0.29 |
| 68.1389 | 73.63 | 0.0960 | 1.37847 | 0.42 |
2.2.2: Gum Arabic
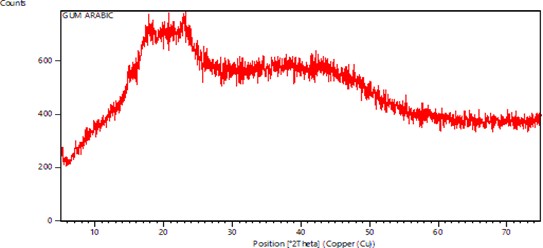
Figure 2: X-Ray Diffractogram of Gum Arabic
2.3. Scanning Electron Microscopy of SFS and GA 2.3.1: Spent Foundry Sand
Scanning electron microscope imaging performed on the internal structure is used to observe the arrangement of the minerals. The physical characteristics of the SFS obtained from the SEM micrographs show the diameter (length) and the morphology (texture) of the SFS. These are shown in Figure 3 (a and b), while the physical dimension of the SFS and in Table 7a. Energy Dispersion X-ray (EDX) was used to determine the composition of sample. The EDS image and data are shown in Figure 4 and Table 7b, respectively.
Table 7a: SFS Diameter (Length)
| Measurement | Diameter (µm) |
| L1 | 189.4 |
| L2 | 205.7 |
| L3 | 326.5 |
| L4 | 142.8 |
| L5 | 96.6 |
| L6 | 129.1 |
| L7 | 124.0 |
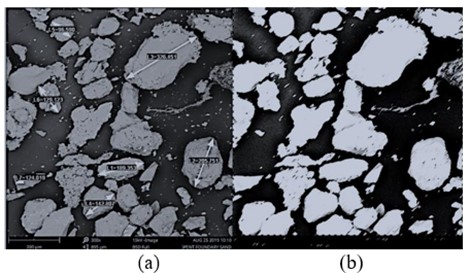
Figure: 3- Scanning Electron Micrograph of Spent Foundry Sand.
Table: 7b: Morphology Characteristics of SFS
| Element | Atomic (%) | Weight (%) |
| C | 68.06 | 45.18 |
| Si | 8.95 | 13.89 |
| Fe | 4.02 | 12.40 |
| O | 12.15 | 10.75 |
| Al | 4.96 | 7.40 |
| Ta | 0.54 | 5.42 |
| Pb | 0.25 | 2.86 |
| Ca | 0.71 | 1.57 |
| Mg | 0.30 | 0.40 |
| Ti | 0.05 | 0.14 |
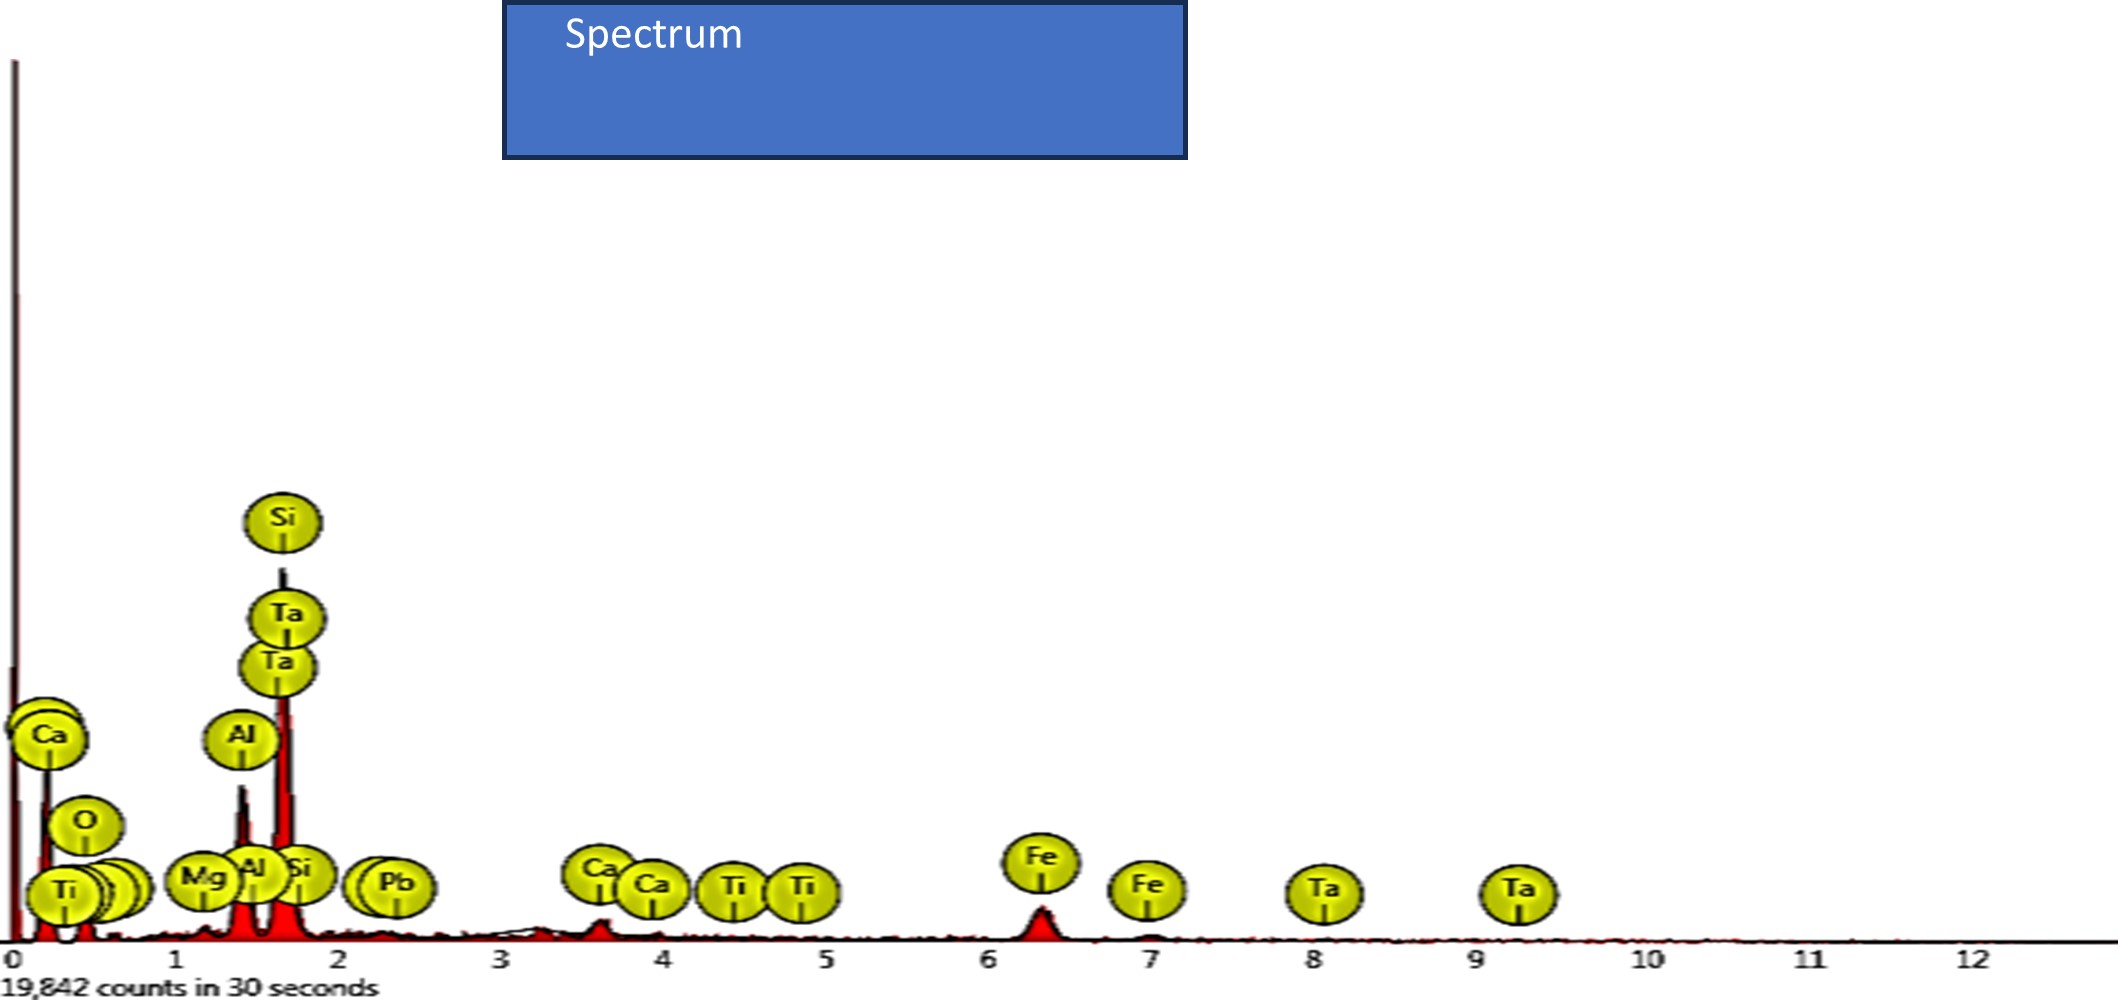
Figure 4: Energy Disperse X-Ray Spectrum of SFS
2.3.2: Gum Arabic
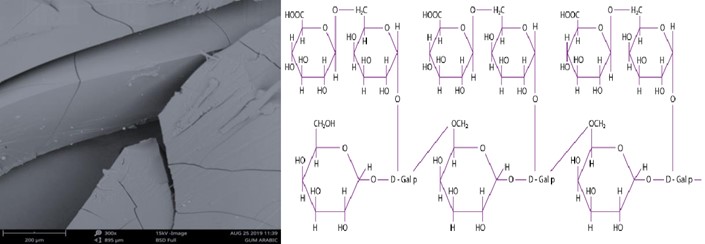
Figure 5: SEM of Gum Arabic (GA) and Gum Arabic Structure
Figures 5 and 6 are the morphological characteristics of the GA and its EDS spectrogram while Table 8 showed the elemental composition of the GA.
Table 8: Composition of Gum Arabic
| Element | Atomic (%) | Weight (%) |
| C | 68.18 | 59.61 |
| O | 22.02 | 25.64 |
| B | 5.60 | 4.40 |
| Te | 0.25 | 2.30 |
| N | 2.20 | 2.24 |
| Ga | 0.25 | 1.25 |
| Ca | 0.37 | 1.07 |
| Br | 0.14 | 0.83 |
| As | 0.11 | 0.60 |
| K | 0.16 | 0.46 |
| Si | 0.20 | 0.41 |
| Rb | 0.06 | 0.35 |
| P | 0.14 | 0.31 |
| Mg | 0.17 | 0.31 |
| F | 0.16 | 0.22 |
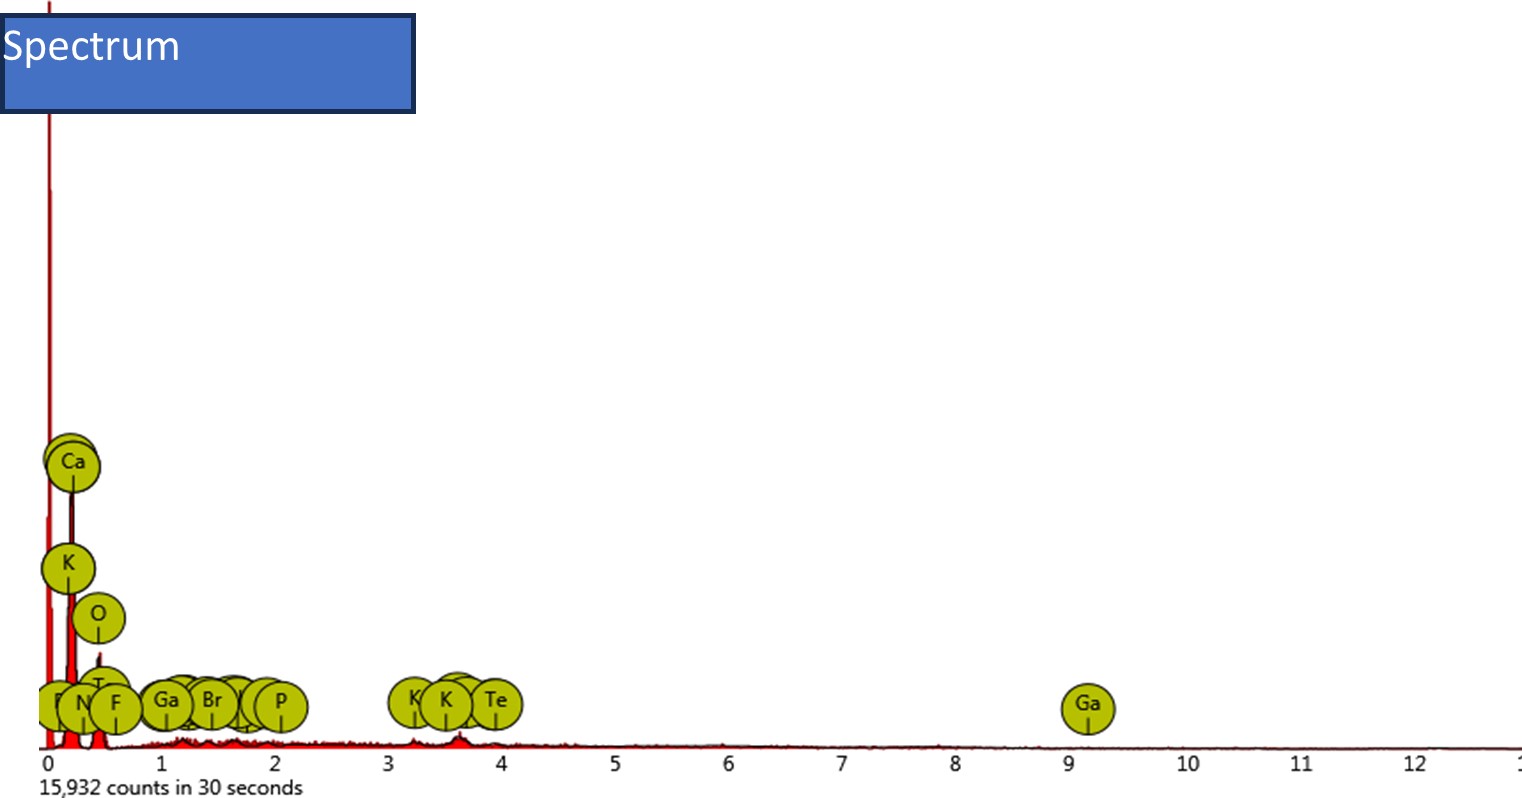
Figure 6: EDS spectrum of GA
EXPERIMENTS
The crushed cube compressive samples used for the studies on the XRD diffraction analysis and microscopy (texture) of concrete was produced from a concrete mix ratio of 1: 1.7: 2.6 with a water-cement (w/c) ratio of 0.5 to which 0 %, 10 %, and 20 % of SFS by wt. % of the fine sand and a dosage of 0.5 % gum Arabic, as an emulsifier and admixture. Concrete cube samples of 100 mm were cast and cured for 28 days before testing for the various concrete parameters shown in Table 9
Table 9: Mechanical Characteristics of Concrete Results for XRD and SEM Analysis
| Water Absorption (%) | Density ( kN/m3) | Compressive Str. (N/m2) | ||||
| Mix | 0.0% GA | 0.5 % GA | 0.0 %GA | 0.5 % GA | 0.0% GA | 0.5 % GA |
| M-00 | 1.55 | 0.77 | 2516 | 2567 | 36.9 | 26.0 |
| M-10 | 1.16 | 1.12 | 2613 | 2658 | 31.7 | 35.7 |
| M-20 | 1.18 | 1.12 | 2631 | 2621 | 25.8 | 30.6 |
3.1. X-Ray Diffraction and Microscopy Characteristics of the Concrete Samples
The samples used for the x-ray diffraction (XRD) and scanning electron microstructure (SEM) analysis are derived from test samples on cube compressive strength (100 mm), manufactured by replacing fine aggregate by wt. % with SFS from 0 to 20 % at replacement intervals of 10 %. These samples are cured for 28 days and tested to failure. The results of the water absorption, density and compressive strength are already given in Table 9. Tests on the crystalline and microscopy studies are done using the crushed samples obtained from the cube compressive strength cured for 28 days. The investigations on these concrete specimens were done using the x-ray diffraction equipment (XRD) and the scanning electron microscope (SEM).
3.1.1- X-Ray Diffraction Analysis of Concrete Samples Containing GA/and SFS 3.1.1.1: Control Concrete and Control Concrete With GA
The XRD diffractogram showing the crystalline phases and mineral oxides for the control concrete and that containing 0.5 % GA are shown in Figures 7a and 7b, respectively, while Tables 10 and 11, are the crystalline phases showing the peak heights and relative intensities. Table 12 is the qualitative analysis (QA) results showing the different mineral oxides contained in concrete samples, and a column of the weight (%) differences.
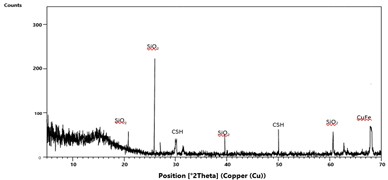
Figure 7a: XRD pattern of Control Concrete
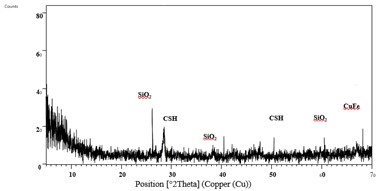
Figure 7b: X-Ray Diffraction of Control Concrete With GA
Table 10: XRD Peak of Control Concrete
| Pos. [°2Th.] | Height [cts] | FWHM Left [°2Th.] | d-spacing [Å] | Rel. Int. [%] |
| 20.0892 | 54.15 | 0.1574 | 4.23553 | 24.81 |
| 25.8565 | 218.21 | 0.2362 | 3.47906 | 100.00 |
| 27.1345 | 21.54 | 0.4320 | 3.12112 | 9.87 |
| 30.1065 | 45.84 | 0.1968 | 2.96838 | 21.00 |
| 31.4722 | 12.58 | 0.2362 | 2.84261 | 5.76 |
| 39.5255 | 38.28 | 0.4723 | 2.28003 | 17.54 |
| 49.3913 | 89.55 | 0.0984 | 1.84524 | 41.03 |
| 60.6416 | 51.24 | 0.0787 | 1.52709 | 23.48 |
| 62.8012 | 12.37 | 0.2362 | 1.47967 | 5.66 |
| 68.1389 | 73.63 | 0.0960 | 1.37847 | 33.74 |
Table11: Peaks of Control-GA Concrete
| Position. [°2Th.] | Height [cts] | FWHM Left [°2Th.] | d-spacing [Å] | Rel. Int. [%] |
| 26.8565 | 31.21 | 0.2362 | 3.47906 | 34.85 |
| 28.5767 | 21.54 | 0.4320 | 3.12112 | 24.05 |
| 38.5255 | 38.28 | 0.4723 | 2.28003 | 42.75 |
| 50.3913 | 89.55 | 0.0984 | 1.84524 | 100.00 |
| 60.6416 | 51.24 | 0.0787 | 1.52709 | 57.22 |
| 68.1389 | 73.63 | 0.0960 | 1.37847 | 82.22 |
Table 12: QA of Control Concrete and Control Concrete-GA
| Control Concrete | Control Concrete -GA | Diff. (%) | ||
| Mineral Name | Formula | Weight (%) | ||
| Hillebrandite | Ca3H2O7.5Si1.5 | 51.2 | 50.3 | -1.76 |
| Quartz | SiO2 | 21.0 | 28.9 | 37.62 |
| Brownmillerite | AlCa2FeO5 | 12.0 | 12.7 | 5.83 |
| Portlandite | CaH2O2 | 8.0 | 7.1 | -11.25 |
| Tricalcium Aluminate | Al2Ca3O6 | 6.9 | 1.0 | -85.51 |
3.1.1.2: 10 % and 20 % SFS without or with 0.5 % GA
In this section, two (2) phases of the investigations are considered: (i) 10 % and 20 % SFS effects on the hydration products of the concrete samples, and (ii) addition of 0.5 % GA to the concretes. i)- 10 % SFS Replacement
The XRD diffractograms of the crystalline phase and mineral oxides of using 10 % SFS with the control concrete is shown in Figure 8a. The addition of 0.5 % GA to this concrete sample is shown in Figure 8b. Their respective crystalline peak heights and relative intensities are shown in Tables 13a, while Table 13b is the qualitative analysis (QA) results showing the different mineral oxides contained in the concrete samples, and a column showing the weight (%) differences. The second phase of the investigation which is the addition of 0.5 % GA to the 10 % SFS concrete, with the aim to evaluate the compatibility of SFS with GA and the level of improvement attained, shows the XRD diffractogram results for this operation as Figures 8b. The crystalline peak heights and relative intensities are shown in Table 14a. Table 14b is the qualitative analysis (QA) results showing the comparison of the mineral oxides in 10 % SFS concrete with that of 10 % SFS concrete with 0.5 % GA concrete
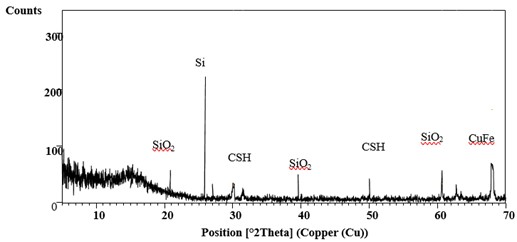
Figure 8a: X-Ray Diffraction of 10-SFS Concrete
Table 13a: Peaks of 10-SFS Concrete
| Pos. [°2Th.] | Height [cts] | FWHM Left [°2Th.] | d- spacing [Å] | Rel. Int. [%] |
| 20.0892 | 53.34 | 0.1574 | 4.23553 | 26.02 |
| 25.8565 | 210.21 | 0.2362 | 3.47906 | 100.00 |
| 27.1345 | 22.33 | 0.4320 | 3.12112 | 10.62 |
| 30.1065 | 25.84 | 0.1968 | 2.96838 | 12.29 |
| 31.4722 | 22.58 | 0.2362 | 2.84261 | 10.74 |
| 39.5255 | 38.28 | 0.4723 | 2.28003 | 18.21 |
| 49.3913 | 37.55 | 0.0984 | 1.84524 | 17.86 |
| 60.6416 | 51.24 | 0.0787 | 1.52709 | 24.38 |
| 62.8012 | 12.37 | 0.2362 | 1.47967 | 5.88 |
| 68.1389 | 81.73 | 0.0960 | 1.37847 | 38.88 |
Table 13b: QA for the Control Concrete with 10-SFS Concrete
| Mineral Name | Formula | Control Concrete | 10-SFS Concrete | Diff. (%) |
| Weight (%) | ||||
| Hillebrandite | Ca3H2O7.5Si1.5 | 51.2 | 52.2 | 1.95 |
| Quartz | SiO2 | 21.0 | 15.2 | -27.62 |
| Brownmillerite | AlCa2FeO5 | 12.0 | 14.7 | 22.50 |
| Portlandite | CaH2O2 | 8.0 | 9.2 | 15.00 |
| Tricalcium Aluminate | Al2Ca3O6 | 6.9 | 8.7 | 26.09 |
10-SFS-Concrete and 10-SFS-GA Concrete
Table 14a: XRD Peak of SFS-GA-Concrete
| Pos. [°2Th.] | Height [cts] | FWHM Left [°2Th.] | d-spacing [Å] | Rel. Int. [%] |
| 26.7624 | 20.14 | 0.4723 | 3.33121 | 15.33 |
| 29.6504 | 131.33 | 0.7085 | 3.01299 | 100.00 |
| 36.0186 | 23.59 | 0.6298 | 2.49356 | 17.96 |
| 39.5255 | 38.28 | 0.4723 | 2.28003 | 29.15 |
| 43.3446 | 39.01 | 0.5510 | 2.08758 | 29.71 |
| 47.6617 | 58.03 | 0.5510 | 1.90808 | 44.19 |
| 48.6905 | 43.81 | 0.3936 | 1.87014 | 33.36 |
Table 14b: QA for the 10-SFS and 10-SFS-GA Concrete
| Mineral Name | Formula | 10-SFS Concrete | 10-SFS-GA Concrete | Diff. (%) |
| Weight (%) | ||||
| Hillebrandite | Ca3H2O7.5Si1.5 | 52.2 | 51.5 | -1.34 |
| Quartz | SiO2 | 15.2 | 17.8 | 17.11 |
| Brownmillerite | AlCa2FeO5 | 14.7 | 13.7 | -6.80 |
| Portlandite | CaH2O2 | 9.2 | 8.9 | -3.26 |
| Tricalcium Aluminate | Al2Ca3O6 | 8.7 | 8.1 | -6.90 |
ii)- 20 % SFS Replacement
The crystalline phase and mineral oxides of the XRD diffractograms for 20 % SFS with the control concrete are shown in Figure 9a. Figure 9b is the concrete sample of 0.5 % GA added to the concrete. Their respective crystalline peak heights and relative intensities are shown in Tables 15a, while Table 15b is the qualitative analysis (QA) results showing the different mineral oxides contained in the concrete samples, and a column the weight (%) differences. The reasons for such an application have been stated above. The XRD diffractogram results for this operation is shown in Figures 9b. The crystalline peak heights and relative intensities are shown in Table 15a. Table 15b is the qualitative analysis (QA) results showing the comparison of the mineral oxides in 20 % SFS concrete with that of 20 % SFS concrete with 0.5 % GA concrete
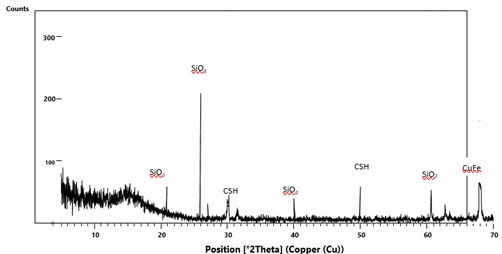
Figure 9a: X-Ray Diffraction of 20-SFS Concrete
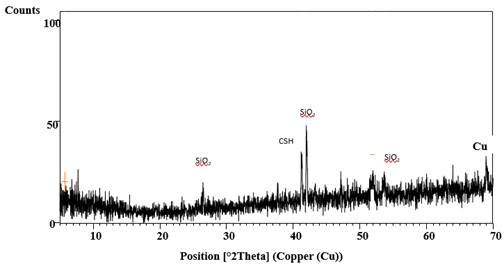
Figure 9b: X-Ray Diffraction of 20-SFS-GA Concrete Control Concrete with 20 % SFS
Table 15a: Peaks of 20-SFS-Concrete
| Pos. [°2Th.] | Height [cts] | FWHM Left [°2Th.] | d-spacing [Å] | Rel. Int. [%] |
| 20.0892 | 53.34 | 0.1574 | 4.23553 | 25.37 |
| 25.8565 | 210.21 | 0.2362 | 3.47906 | 100.00 |
| 27.1345 | 21.54 | 0.4320 | 3.12112 | 10.25 |
| 30.1065 | 23.31 | 0.1968 | 2.96838 | 11.09 |
| 31.4722 | 12.58 | 0.2362 | 2.84261 | 5.98 |
| 39.5255 | 38.28 | 0.4723 | 2.28003 | 13.86 |
| 49.3913 | 32.42 | 0.0984 | 1.84524 | 15.42 |
| 60.6416 | 51.24 | 0.0787 | 1.52709 | 24.37 |
| 62.8012 | 12.37 | 0.2362 | 1.47967 | 5.88 |
| 68.1389 | 87.63 | 0.0960 | 1.37847 | 41.69 |
Table 15b: QA Control Concrete and 20-SFS Concrete
| Mineral Name | Formula | Control concrete | 20-SFS Concrete | Diff. (%) |
| Weight (%) | ||||
| Hillebrandite | Ca3H2O7.5Si1.5 | 51.2 | 36.8 | -32.81 |
| Quartz | SiO2 | 21.0 | 21.6 | 54.29 |
| Brownmillerite | AlCa2FeO5 | 12.0 | 20.9 | 39.17 |
| Portlandite | CaH2O2 | 8.0 | 16.0 | 51.69 |
| Tricalcium Aluminate | Al2Ca3O6 | 6.9 | 4.7 | -56.52 |
Table 16a: Peaks of 20-SFS-GA Concrete
| Pos. [°2Th.] | Height [cts] | FWHM Left [°2Th.] | d-spacing [Å] | Rel. Int. [%] |
| 5.7294 | 9.78 | 0.9446 | 15.42564 | 14.94 |
| 26.7624 | 20.14 | 0.4723 | 3.33121 | 30.76 |
| 41.2813 | 37.30 | 0.1968 | 2.18702 | 56.97 |
| 42.0025 | 65.47 | 0.1968 | 2.15112 | 100.00 |
| 51.8875 | 19.71 | 0.6298 | 1.76219 | 30.10 |
| 53.6374 | 18.13 | 0.4723 | 1.70876 | 27.70 |
Table 16b: 20 % SFS-Concrete and 20 % SFS-GA
| Mineral Name | Formula | 20-SFS Concrete | 20-SFS-GA Concrete | Diff. (%) |
| Weight (%) | ||||
| Hillebrandite | Ca3H2O7.5Si1.5 | 34.4 | 36.8 | 6.98 |
| Quartz | SiO2 | 32.4 | 21.6 | -33.33 |
| Brownmillerite | AlCa2FeO5 | 16.7 | 20.9 | 25.15 |
| Portlandite | CaH2O2 | 13.5 | 16.0 | 18.52 |
| Tricalcium Aluminate | Al2Ca3O6 | 3.0 | 4.7 | 56.67 |
Table 16c: QA of 10-SFS Concrete and 20-SFS Concrete
| Weig | ht (%) | |||
| Hillebrandite | Ca3H2O7.5Si1.5 | 52.2 | 36.8 | -29.50 |
| Quartz | SiO2 | 15.2 | 21.6 | 42.11 |
| Brownmillerite | AlCa2FeO5 | 14.7 | 20.9 | 42..18 |
| Portlandite | CaH2O2 | 9.2 | 16.0 | 73.91 |
| Tricalcium Aluminate | Al2Ca3O6 | 8.7 | 4.7 | -45.98 |
3.2. Microstructure and Structural Morphology of SFS and GA Concrete
As mentioned earlier crushed samples of the compressive strength at its maximum strength cured for 28 days are used for this investigation. The study on the morphology and structural characteristics of the concrete samples are carried out using a Phenom Pro-X desktop scanning electron microscope (SEM) with energy X-ray (EDX). These results of SEM and EDX are shown in Figures 10 to 12, and the structural characteristics of the hydration products are shown in Tables 16 to 18.
3.2.1. Control Concrete without or with Gum Arabic
Figures 10a and 10b show the microstructure and the structural characteristics of the control concrete, and that to which 0.5 % is added. The structural characteristics (EDS) showing the atomic and weight concentrations (%) of the oxides of the hydration products are Table17.
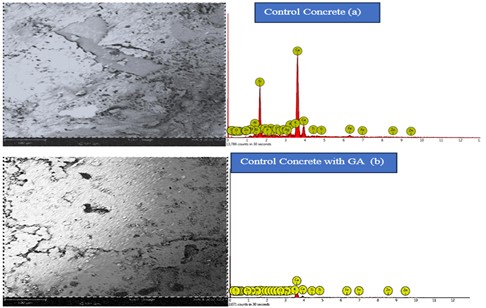
Figure 10: Micrograph and EDS Spectrum – Control Concrete: Control-GA Concrete
Table 17: Comparison of the Structural Characteristics of Control and Control-GA
| Control Concrete | Control Concrete-GA | |||
| Element | Symbol | Wt. (%) | Wt. (%) | Wt.% Diff |
| Calcium | Ca | 61.38 | 80.90 | 24.13 |
| Silver | Ag | 17.24 | 3.90 | -342.05 |
| Iron | Fe | 4.38 | 3.07 | -42.67 |
| Carbon | C | 3.63 | 2.63 | -38.02 |
| Potassium | K | 3.07 | 2.27 | -35.24 |
| Silicon | Si | 17.24 | 2.17 | -37.33 |
| Potassium | P | 1.71 | 1.18 | -44.92 |
| Aluminum | Al | 1.30 | 1.08 | -20.37 |
| Sodium | Na | 1.18 | 0.91 | -29.67 |
| Sulphur | S | 1.04 | 0.87 | -19.54 |
| Magnesium | Mg | 0.88 | 0.55 | -60.00 |
| Chlorine | Cl | 0.68 | 0.46 | -47.83 |
| Oxygen | O | 0.40 | 0.00 | Disappeared |
| Titanium | Ti | 0.14 | 0.00 | Disappeared |
| Zinc | Zn | 0.00 | 0.00 | 0.00 |
3.2.2. Effect of SFS on Concrete
This section deals with the cases of replacing the fine aggregate in the control concrete with 10 % and 20 % SFS on one hand, and adding 0.5 % GA, on the other hand and evaluating their effects on the hydration products.
3.2.2.1 a. Spent Foundry Sand Effect at Ten (10) Percent Replacement
Figures 11a and 11b are the microstructures and EDS Spectra for the hydration products of the concrete sample with 10-SFS, and that to which 0.5 % GA (10-SFS-GA concrete.) is added Tables 18 are the structural characteristics (EDS) for the hydration products, for the same concrete samples.
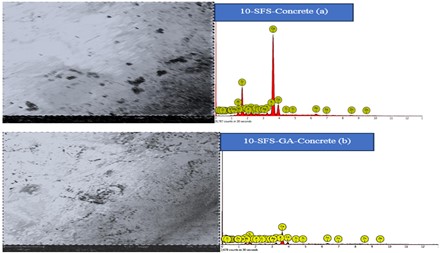
Figure 11: Micrograph and EDS Spectrum – Control Concrete: Control-GA Concrete
Table 18a: Comparison of Control Concrete and 10-SFS-Concrete
| Control Concrete | 10-SFS-Concrete | |||
| Element | Symbol | Wt. (%) | Wt. (%) | Wt.% Diff |
| Calcium | Ca | 61.38 | 68.77 | 12.04 |
| Silver | Ag | 17.24 | 2.80 | -83.76 |
| Iron | Fe | 4.38 | 3.14 | -28.31 |
| Carbon | C | 3.63 | 1.09 | -69.97 |
| Potassium | K | 3.07 | 1.53 | -50.16 |
| Silicon | Si | 2.98 | 11.38 | 281.88 |
| Potassium | P | 1.71 | 1.04 | -39.18 |
| Aluminum | Al | 1.30 | 3.57 | 174.62 |
| Sodium | Na | 1.18 | 0.31 | -73.72 |
| Sulphur | S | 1.04 | 1.41 | 35.58 |
| Magnesium | Mg | 0.88 | 0.23 | -73.86 |
| Chlorine | Cl | 0.68 | 1.09 | 60.29 |
| Oxygen | O | 0.40 | 0.58 | 45.00 |
| Titanium | Ti | 0.14 | 0.22 | 57.14 |
| Zinc | Zn | 0.00 | 2.84 | 100.00 (New) |
Table 18b: Comparison of 10-SFS-Concrete and 10-SFS-GA-Concrete
| 10-SFS-Concrete | 10-SFS-GA-Concrete | |||
| Element | Symbol | Wt. (%) | Wt. (%) | Wt.% Diff |
| Calcium | Ca | 68.77 | 54.74 | -20.40 |
| Silver | Ag | 2.80 | 3.73 | 33.21 |
| Iron | Fe | 3.14 | 11.89 | 278.66 |
| Carbon | C | 1.09 | 4.71 | 332.11 |
| Potassium | K | 1.53 | 5.54 | 262.09 |
| Silicon | Si | 11.38 | 9.27 | -18.54 |
| Potassium | P | 1.04 | 0.62 | -40.38 |
| Aluminum | Al | 3.57 | 3.68 | 3.08 |
| Sodium | Na | 0.31 | 1.10 | 254.84 |
| Sulphur | S | 1.41 | 1.15 | -52.48 |
| Magnesium | Mg | 0.23 | 0.31 | 34.78 |
| Chlorine | Cl | 1.09 | 1.31 | 20.18 |
| Oxygen | O | 0.58 | 1.94 | 234.48 |
| Titanium | Ti | 0.22 | 0.00 | -100.00 |
| Zinc | Zn | 2.84 | 0.00 | -100.00 |
3.2.2.1b. Spent Foundry Sand Concrete at Twenty (20) Percent Replacement
Figures 12a and 12b are the microstructures and EDS Spectra for the hydration products of the concrete sample with 20-SFS, and that to which 0.5 % GA (20-SFS-GA concrete.) is added. Tables 19a, 19b and 19c are the structural characteristics (EDS) of the hydration products, for the same concrete samples.
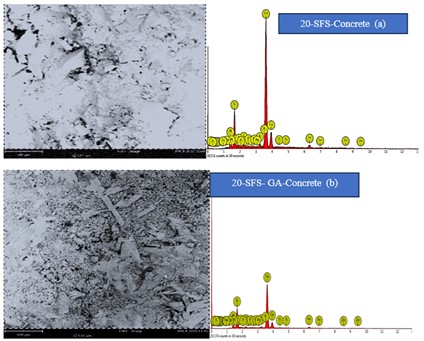
Figure 12: Micrograph and EDS Spectrum of 20-SFS and 20-SFS-GA Concrete
Table 19a: Comparison of Control Concrete and 20-SFS Concrete
| Control Concrete | 20-SFS-Concrete | |||
| Element | Symbol | Wt. (%) | Wt. (%) | Wt.% Diff |
| Calcium | Ca | 61.38 | 64.62 | 5.28 |
| Silver | Ag | 17.24 | 2.66 | -85.15 |
| Iron | Fe | 4.38 | 6.23 | 42.24 |
| Carbon | C | 3.63 | 1.38 | -61.98 |
| Potassium | K | 3.07 | 1.75 | -43.00 |
| Silicon | Si | 2.98 | 13.82 | 363.76 |
| Potassium | P | 1.71 | 1.04 | -39.18 |
| Aluminum | Al | 1.30 | 3.61 | 177.69 |
| Sodium | Na | 1.18 | 0.17 | -85.59 |
| Sulphur | S | 1.04 | 1.52 | 46.15 |
| Magnesium | Mg | 0.88 | 0.34 | -61.36 |
| Chlorine | Cl | 0.68 | 0.76 | 11.76 |
| Oxygen | O | 0.40 | 0.15 | -62.5 |
| Titanium | Ti | 0.14 | 0.00 | -100.00 (Disappeared) |
| Zinc | Zn | 0.00 | 1.95 | New |
Table 19b: Comparison of 20-SFS Concrete and 20-SFS-GA Concrete
| 20-SFS Concrete | 20-SFS-GAConcrete | |||
| Element | Symbol | Wt. (%) | Wt. (%) | Wt.% Diff |
| Calcium | Ca | 64.62 | 71.94 | 11.33 |
| Silver | Ag | 2.66 | 2.40 | -9.77 |
| Iron | Fe | 6.23 | 6.11 | -1.93 |
| Carbon | C | 1.38 | 1.01 | -26.81 |
| Potassium | K | 1.75 | 1.74 | -0.57 |
| Silicon | Si | 13.82 | 9.87 | -28.58 |
| Potassium | P | 1.04 | 0.86 | -78.85 |
| Aluminum | Al | 3.61 | 2.80 | -22.44 |
| Sodium | Na | 0.17 | 0.27 | 58.82 |
| Sulphur | S | 1.52 | 1.47 | -3.29 |
| Magnesium | Mg | 0.34 | 0.31 | -8.82 |
| Chlorine | Cl | 0.76 | 0.70 | -7.89 |
| Oxygen | O | 0.15 | 0.51 | 240.00 |
| Titanium | Ti | 0.00 | 0.00 | 0.00 |
| Zinc | Zn | 1.95 | 0.00 | -100.00 |
3.2.3.2. 10-SFS and 20-SFS Concrete
Table 19c: Comparison of 10-SFS Concrete and 20-SFS Concrete
| 10-SFS-Concrete | 20-SFS-Concrete | |||
| Element | Symbol | Wt. (%) | Wt. (%) | Wt.% Diff |
| Calcium | Ca | 68.77 | 64.62 | -6.03 |
| Silver | Ag | 2.80 | 2.66 | -5.00 |
| Iron | Fe | 3.14 | 6.23 | 98.41 |
| Carbon | C | 1.09 | 1.38 | 26.61 |
| Potassium | K | 1.53 | 1.75 | 14.38 |
| Silicon | Si | 11.38 | 13.82 | 21.44 |
| Potassium | P | 1.04 | 1.04 | 0.00 |
| Aluminum | Al | 3.57 | 3.61 | 1.12 |
| Sodium | Na | 0.31 | 0.17 | -45.16 |
| Sulphur | S | 1.41 | 1.52 | 7.80 |
| Magnesium | Mg | 0.23 | 0.34 | 47.83 |
| Chlorine | Cl | 1.09 | 0.76 | -30.28 |
| Oxygen | O | 0.58 | 0.15 | -74.14 |
| Titanium | Ti | 0.22 | 0.00 | -100.00 |
| Zinc | Zn | 2.84 | 1.95 | -31.34 |
3.3. Acid and Base Effects on Concrete
The acid and sulphate attack on concrete samples (with or without SFS and GA), are studied using crushed samples from the cube compressive strength just as already explained for the XRD and SEM analysis above. These concrete samples are immersed in Acid (H2SO4 and HNO3) and Sulphate (Na2SO4 & MgSO4) solutions of 20 % dilution for 7, 14, 28, and 56 days, respectively. These are carried out to assess the levels of deterioration when concrete is in such media. An average of three samples are recorded at each age of immersion and medium. The calculation for the decay or growth are calculated using Eqn. 1. The results are in Table 20.
(𝑊2− 𝑊1)/ 𝑊1 𝑋 100 % ……. 1
Where W𝑤1 = the original weight of the concrete sample
𝑊2 the final weight of the concrete sample after immersion in the acid or sulphate solutions
Table 20: Acid and Sulphate Effects on Concrete
| Medium | Mix | No Gum Arabic (%) | With Gum Arabic (%) | ||||||
| 7d | 14d | 28d | 56d | 7d | 14d | 28d | 56d | ||
| Control | -34.56 | -48.70 | -65.23 | -86.33 | -33.57 | -47.59 | -64.14 | -85.14 | |
| H2SO4 | 10SFS-Concrete | -38.52 | -56.90 | -73.88 | -94.61 | -36.78 | -54.80 | -71.14 | -92.93 |
| 20SFS-Concrete | -40.63 | -51.78 | -75.14 | -90.84 | -39.93 | -50.07 | -73.82 | -90.24 | |
| Control | -27.41 | -28.91 | -31.58 | -59.03 | -26.44 | -27.83 | -30.51 | -58.79 | |
| HNO3 | 10SFS-Concrete | -27.62 | -44.26 | -79.30 | -90.82 | -28.19 | -42.39 | -68.65 | -88.80 |
| 20SFS-Concrete | -24.51 | -29.87 | -69.42 | -80.15 | -24.79 | -28.58 | -67.07 | -78.58 | |
| Control | 0.28 | 3.02 | 6.45 | 22.34 | 0.19 | 2.23 | 5.61 | 20.07 | |
| Na2SO4 | 10SFS-Concrete | 0.43 | 1.28 | 5.12 | 45.52 | 0.47 | 1.02 | 4.01 | 38.76 |
| 20SFS-Concrete | 0.76 | 2.85 | 8.50 | 45.54 | 0.17 | 2.58 | 7.67 | 43.27 | |
| Control | 1.93 | 2.42 | 4.13 | 7.02 | 2.02 | 2.21 | 4.12 | 6.85 | |
| MgSO4 | 10SFS-Concrete | 1.05 | 2.97 | 4.40 | 9.91 | 1.22 | 2.88 | 4.11 | 8.72 |
| 20SFS-Concrete | 1.12 | 1.88 | 3.99 | 11.89 | 0.93 | 1.50 | 3.47 | 8.73 | |
DISCUSSIONS
4.1. Characteristics of the materials
Tables 1, 2, and 3 are the physical and chemical properties of cement, spent foundry sand (SFS) and gum Arabic (GA). Tables 4 and 5 are the physical characteristics of the aggregates (fine and coarse), and the sieve analysis of these aggregates and SFS, respectively. The totals of the oxides of (SiO2, Al2O3, Fe2O3), and CaO, in the cement, are 29.44 % and 60.92%, in SFS it is 96.83 % and 0.98 %, and in GA it is 8.36 % and 3.47, respectively. The CaO content in the cement gives the cement the cementing factor. The SFS on the other hand has the characteristics of a pozzolana with high affinity for water [3]. ASTM [22] stipulates a total of (SiO2 + Al2O3 + Fe2O3) > 70 % with a CaO < 10.0 %. SFS therefore, has no cementing factor, but occupies more surface area due to its ultra fineness, and thus requires more water demand to achieve the requirements of concrete. The GA is an emulsifier with a specific gravity, density and percentage passing the 150µm sieve as 2.48, 1648 kg/m3, and 2.47 %. That for the fine aggregate is 2.54, 2589 kg/m3, and 27.24 % [1, 4]. The characteristics of these materials influenced the final hydration products of the concrete samples. Studies on the physical and chemical properties of SFS showed variability which are tied to some factors like the environment and conditions of use [4].
The XRD diffractogram of the SFS is shown in Figure 1 with a peak value at 2Theta 27o, reflecting the amount of crystalline structure in the SFS. The dominant mineral in SFS is Quartz which is a hard crystalline mineral of silica (silicon dioxide), whose atoms are linked in a continuous framework of SiO4 silicon–oxygen tetrahedra. Each oxygen is shared between two tetrahedra giving an overall chemical formula of SiO2 in which magnesium, iron, aluminum, and silicon substitute for each other in the crystal structure. Table 6 is the crystalline phases and mineral compositions of SFS. The gum Arabic (GA) XRD diffractogram is shown in Figure 2. This is amorphous with no distinct peak structure [23]. It is reported in [21] that the variability in the particle size distribution, morphology and mineralogy of SFS together with the various residual binders and various metallic particles may explain the greater variability in density of the by-product. The morphology (Texture) and particle dimensions of the SFS sample used are shown in Figure 3 (a and b). The specific gravity of the SFS is 2.54 and the bulk density, 2589 kg/m3. The EDS elemental spectrogram and the structural values are shown in Figure 4, and Table 7a, while the particle diameters are shown in Table 7b. The microstructure shows that SFS is generally irregular in shape measuring approximately 205.7 µm to 96.0 µm. The mechanism responsible for surface charge of oxide minerals in additions such as SFS is dependent on the pH. At high pH, which is typical of cementitious suspension, negative silanolate groups > 𝑆𝑖𝑂𝑛− predominant on the surface of the siliceous clinker phases (C3S, C2S) and additions such as sawdust ash (SDA), groundnut husk ash (GHA), and SFS. [24]. They contain micro-porous surfaces, and discreet widely with dominant oxides of C, Si, Fe, O, Ta, Pb, and Ca and trace oxides of Mg and Ti (Tables 7a and 7b). Gum Arabic is an emulsifier and used as a superplasticizer and conforms to BS EN 9341 [20]. The morphology (texture) of GA (Figure 5), shows the internal structures to consist of different pulp-layers which has clear lines of separation characterized with hair cracks on them and consists mainly of high molecular weight polysaccharides, and their magnesium, calcium and potassium salts which of hydrolysis yield galactose, arabinose, glucuronic acid and rhamnose. The EDS elemental result showed that the dominant oxides are C, O, B, Te, N, Ga, and Ca, with minor oxides as Br, As, K, and Si, respectively (Figure 5 and Table 8).
4.2. X-Ray Diffraction Analysis of Concrete Samples Containing GA-Admixture and SFS The crystalline phases and the mineral oxides of the concrete samples are replicates of the effects of the GA and SFS materials. In this case cement, SFS and GA are the parent materials and make up the composition of the paste. The paste is approximately 35 % of the concrete and is the most susceptible to attack from deleterious materials. Concrete samples were made with these materials, using them separately or in combination and tested using the x-ray diffraction analysis machine. The results for the x-ray diffractograms for the different categories of the concrete samples are shown in Figures 7 to 9. Tables 10a, 12a, and 14a are the crystalline peaks for concrete without the addition of GA, while the concrete samples with 0.5 % dosage of GA are shown in Tables 11a, 13a, and 15a. The Qualitative Analysis (QA results are shown respectively, in Tables 10b, 12b, and14b, and 11b, 13b, and 15b, respectively.
4.2.1. Effect of GA on Concrete
The XRD diffractograms for both the control concrete and that with 0.5 % GA are shown in Figures 7a and 7b. The dominant mineral oxides in the two concrete samples diffractographs are SiO2, C-S-H, and CuFe. Marked differences in the shapes, and crystalline peaks and heights are observed between the two concrete samples diffractograms arising from the addition of 0.5 % GA. The 2θ for the two concrete samples are shifted with the crystalline peaks as 20.0892 and 26.8565, respectively. The crystalline phases are reduced from ten (10) in the control concrete to six (6) in the concrete with GA (Tables 10a and 11a). The crystalline peak heights for GA-concrete are also reduced and can be attributed to the emulsifying and sugar effects of GA. GA morphology consists mainly of high molecular weight polysaccharides, and their magnesium, calcium and potassium salts which of hydrolysis yield galactose, arabinose, glucuronic acid and rhamnose. Therefore, the transformations that happened in the concrete sample can be tied to the actions of the GA. The magnitudes of the peak height at 2θ (60.6416) and (68.1389) did not change but their relative intensities increased by 110.26 % and 134.71 %, respectively.
The quantitative analysis for the two concrete samples shows the mineral oxides are the same but with varying concentrations (wt. %) shown in Tables 10b and 11b. The mineral oxides are Hillebrandite, Quartz, Brownmillerite, Portlandite, and Tricalcium Aluminate. A comparison of the wt.% differences of the mineral oxides are shown in Table 12. Hillebrandite, Portlandite, and Tricalcium Aluminate decreased in quantity as 0.5 % GA is added by 1.76 %, 11.25 %, and 85.51 %, while Quartz in the form of silica, and brownmillerite increased by 37.62 % and 5.83, respectively. Hillebrandite is rhombic and belongs to a member of a series of hydrated calcium silicates which resemble each other. Calcium silicate hydrate (C-S-H) is the major hydration product of cement and responsible for its mechanical strength properties. Portlandite formation produced a rapid expansion in the cement paste and contained granules of dead-burn lime (CaO) that produce crystals of portlandite (Ca (OH) 2) when they enter in contact with water. Tricalcium aluminate (C3A) is the most reactive component of the Portland cement, and its hydration has an important impact on the workability and early strength of concrete. There are four main minerals, alite (C3S), belite (C2S), tricalcium aluminate (C3S), and tetra calcium aluminoferrite (also known as brownmillerite) in Portland cement clinker, and C2S has the characteristics of lower hydration heat, higher later mechanical properties, higher growth rate of mechanical properties, and excellent durability [25, 26].
4.2.2. Effect of SFS on Concrete
4.2.2.1. Control Concrete with 10-SFS.
Figure 8a diffractogram is the case when 10 % SFS is added to the control concrete. Amorphous and crystalline phases are also identified as observed for the control concrete (Figure 7a and Table 10), having the same 2θ and the same number of the crystalline peaks, but with different height (Counts) and relative intensities (%). The crystalline peaks are shown in Tables 13a. The 2θ crystalline peaks that experienced shifts in their original heights because of the effects of SFS are observed at 25.8565, 30.1065, 31.4722, 49.3913, and 68.1389, respectively. Their accompanying effects on the relative intensities are -43.65 %, 79.60 %, 31.39, -58.08, 0.04 %, and 10.99 %, respectively. However, at 2θ (39.5255 and 60.6416), the heights remain the same but with different effects on their relative intensity. The QA results (Table13b) show a reduction in the quantity of Silica of about 27.62 % when 10 % SFS is added. Hillebrandite marginally increased, while others increased approximately from 15 % to 26 %.
4.2.2.2. 10-SFS-Concrete with Gum Arabic (GA)
The X-ray diffractogram and the new crystalline peaks developed by the 10-SFS concrete due to the addition of 0.5 % GA are shown in Figure 8b and Table 14a. From the X- ray diffraction diffractograms results (Figures 7 to 9), and comparing all the mineral oxides on the diffractographs (Figure 7 to 9), it is observed that all have mineral oxides of SiO2, C-S-H, and CuFe, except the concrete sample containing 10 % SFS and GA. The mineral oxide of CuFe, is not found in Figure 8b. No reasons can be adduced meanwhile. Also, the addition of GA admixture to the 10-SFS concrete changed the shape of the diffractogram. This may be because GA is a normal branched-chain multi-functional hydrocolloid with a complex of calcium, magnesium, and potassium that is strongly neutral or mildly acidic, arabinogalactan proteins. Apart from the adhesion effects of gum Arabic the maximum level of replacement of SFS may be another probable reason which is 10 %. It is also observed that the crystalline peaks of ten (10) for 10-SFS-concrete, are reduced to six (6) for 10-SFS-GA concrete. The crystalline peak height at relative intensity of 100 % (210.21) for 2θ (25.8565) is reduced to 131.33 at 2θ (29.0504) because of 0.5 % GA, approximately 37.54 %. Also, the crystalline peaks at 2θ (39.5255) for 10-SFS and 10-SFS-Ga concrete have the same Peak height (38.28) but the relative intensities for 10-SFS-GA concrete reduced by approximately 23.85 %. The reduced peaks have been tied to the pH of the GA, which is approximately 4.0 [1], and the sugar, the emulsifying effects of GA. This is what gives GA an admixture status.
A comparison of QA results of the mineral oxide quantities, due to the transformative effects of using SFS and GA together, show that the wt. % of Hillebrandite, Brownmillerite, Portlandite, and Tricalcium aluminate decreased because of the presence of GA-admixture by 1.34 %, 6.80 %, 3.26 % and 6.90 %, respectively. Quartz, in the form of Silica increased by 17.11 % (Table 14b), Gum Arabic (GA) admixture acting as an emulsifier can act on silica. Silica in concrete coagulates due to the presence of hydroxide ions on its surface. Therefore, the action of GA reverses this action to allow better workability and flow of the control concrete with GA.
4.2.2.3. Control Concrete and 20-SFS-Concrete
The crystalline height and relative intensities percentage differences for the control concrete and 20-SFS concrete are shown in Table 15a. Out of the ten (10) crystalline phases in the concrete samples, only four (4) of the phases are transformed after the addition of 20-SFS. The peak heights and relative intensities at 2θ (30.1065, and 49.3913) are reduced in magnitude. At 2θ (68.1389) and (25.8565), respectively, there are increases in the peak heights and relative intensity of 68.1389 and increase only in the peak height for 25.8565.
The QA results’ comparison of the mineral oxides is shown in Table 15b. Hillebrandite and Tricalcium aluminate are reduced by 32.81 % and 56.52 %, respectively, by the addition of 20-SFS to the control concrete, and Quartz, Brownmillerite and Portlandite are increased by 54.29 %, 39.17 % and 51.69 %.
4.2.2.4: 20-SFS Concrete and 20-SFS-GA Concrete
The crystalline peaks for the 20-SFS and 20-SFS-GA concrete samples are shown in Tables 15a and 16a, respectively. They vary in number in their crystalline phase occurrences. The concrete sample with 20 % SFS only has ten (10) crystalline peaks, while that containing both 20 % SFS and 0.5 % GA, are reduced to five (5) with different 2θ, showing significant transformation of about 50 % took place within the concrete matrix. The relative intensities of these changes as observed show increases. The QA results, which is a comparison of the mineral oxides in both concrete samples show that, apart from Hillebrandite that decrease in wt. % (33.33 %), mineral oxides like Quartz, Brownmillerite, Portlandite, and Tricalcium aluminate, increase from 6.98 % to 56.67 % as shown in Table 16b.
4.2.2.5. 10-SFS and 20-SFS Concrete
The crystalline peaks and relative intensities of 10-SFS and 20-SFS concrete samples are shown in Tables 13a and 15a. Both concrete samples have ten (10) crystalline phases with five (5) of the crystalline peaks different in the 2θ peak heights (25.8565, 30.1065, 31.4722, 49.3913, and 68.1389). The differences show that four (4) of the crystalline peaks out of the five (5) decreased due to the increase from 10 % to 20 %, an indication that 10 % SFS is the maximum replacement level. The relative intensities again reduced by 50 % and increased by 40 %, respectively. The remaining five (5) crystalline phases remained unchanged both in peak height and relative intensity. Comparison of the effects of 10 % SFS and 20 % SFS on the mineral oxides show that Hillebrandite and Tricalcium aluminate decreased in wt. % for 20 % SFS, while the other mineral oxides gained weight (%) from 42.11 % to 73.91 %. These are shown in Table 16c.
4.3. Scanning Electron Microscopy (SEM)
The microscopy interpretations for all the concrete samples are based on the SEM results from Figures 10-12, and Tables 17-19. The analyses in this section are used to substantiate the characteristic behavior observed on the crystalline phases and mineral oxides from the X-ray diffraction diffractogram results.
4.3.1a: Gum Arabic Effect on the Morphology of the Control Concrete
The control concrete micrograph (Figure 10a) shows C-S-H gels with nodules and vast areas of somehow chalky gel dotted with unhydrated cement, calcium hydroxide and voids. The addition of GA-admixture improved the texture of the concrete showing a well distributed gel of C-S-H with reduced void sizes. Patches of aggregates and unhydrated cement observed on the micrograph of the control concrete disappeared due to the addition of GA-admixture (Fig.10b), confirming the dual function of GA-admixture. GA acts both as an emulsifier and an admixture. The observations made on the XRD crystalline peaks and heights tend to lend much credibility to the findings observed on the SEM results which are the compactness of the microscopy (Table 9), and the structural characteristics (Table 16, Figure 10). The water absorption was reduced by 49.7 %, and the density increased by approximately 4.4 % (Table 9). Therefore, one of the characteristics of GA admixture is it reduces water absorption and increases the density of concrete.
The dominant mineral oxides from the structural characteristics (EDS spectrometer), with significant impact on the internal rearrangements of the concrete compositions are shown in Table 17. These are responsible for the observed characteristics on the control concrete and that with 0.5 % GA mentioned earlier. The weight (%) taken into consideration in determining the oxides that impacted on the concrete microstructure are wt. % ≥ 3%. The mineral oxides for the control concrete are Ca (61.38 %), Si (17.24 %), Fe (4.38 %), K (3.07 %), C (3.63 %) and Ag (17.24 %), while that for the control concrete with 0.5 % GA are Ca (80.90 %), Ag (3.90 %), Fe (3.07 %), respectively. The effect of GA, therefore, is seen with the weight (%) differences between the two concrete samples. Seventy-three (73) percent of the weight (%) from the oxides in the control concrete transformed (reduced) because of the addition of 0.5 % GA. One of the characteristics of GA is giving the concrete a negative adhesion causing the molecules to disperse. It is also worth noting that oxygen (O) and Titanium (Ti) which appeared in the control concrete disappeared from the GA-concrete. Earlier research detected minerals such as Sepiolite, Palygorskite and Mordenite as found GA-concrete samples. These mineral oxides improved the properties of the concrete. [27]
4.3.2. Spent Foundry Sand (SFS) Effect on Concrete
4.3.2.1. Effect of 10 % SFS on Control Concrete
The use of 10 % SFS was extensively discussed in an earlier publication [26], and there were remarkable transformations on the hydration products with a well distributed C-S-H gel, dotted portions of voids, and a well-developed texture (Figure 11). The compactness of the concrete sample shows that the WA decreased by approximately 25 %, the density increased by ≈ 4 %, and the compressive strength decreased by 14 %, respectively (Table 9). This is an indication that the internal grain structure is more compact and better dispersed than the control concrete. It is therefore concluded, the addition of SFS reduced water absorption and increased the density of the concrete. However, the decrease in the compressive strength is because of the texture of SFS. It has also been mentioned in the literature that SFS can increase water absorption [28], which leads to decrease in compressive strength [29]. This needs further confirmation. The mineral oxides (EDS spectrometer) with wt. % ≥ 3% shows significant impact on the internal rearrangement of the concrete composition and therefore, responsible for the observed characteristic developed with the addition of 10 % SFS to the control concrete (Table 18a). Therefore, the structural characteristics with relative abundance of ions of the mineral oxides are Ca (68.77 %), Fe (3.14 %), Si (11.38 %), and Al (3.37 %). The effectiveness of this addition stems from the differences in wt. % (Table 18a) which shows 64 % of the oxides from the control concrete are reduced in wt. %. The probable reason for this will be the hydration that followed when 10 % SFS is added. The wt. % magnitude of oxides of Si (281.88%), Al (174.62 %), S (35.58 %), Cl (60.29 %), O (45.00), and Ti (57.14 %) are noteworthy.
Oxygen (O) and Ti (Ti) which disappeared in the control concrete when 0.5 % GA is added, increased by 45. 00 % and 57.14 %, respectively, as 10 % SFS is added to the control concrete. It is also noticed that Zinc (Zn) which is 0.00 % in both the control concrete and concrete with GA, appeared in 10 % SFS concrete.
4.3.2.2. Effect of GA on 10-SFS Concrete
With the addition of GA-admixture a more compact texture was achieved with C-S-H gel and other features noticed (Figure 12b). The same observation is made with the structural characteristics shown in Table 18b. These assertions are further confirmed with the concrete characteristics (WA, density, comp. str.) in Table 9. The observations on the x-ray diffraction results for the 10 %-SFS, follows also for 10 %-SFS-GA-admixture to support the findings observed in the microscopy (texture) of the samples (Figure 12b). The final shapes (Figures 8a and 8b) signify a change in the concrete morphology. These are reflected in the differences in the water absorption and density which showed improvement of 27.74 % and 5.64 % respectively. Therefore, the same conclusions for 10-SFS concrete could be made for the SFS concrete mix with GA. SFS and GA admixture therefore are compatible and can be used together as cement and concrete addition materials. The dominant mineral oxides (wt. % ≥ 3%) for 10 % SFS concrete are Ca (54.74), Ag (3.73), Fe (11.89), C (4.71), K (5.54), Si (7.29), and Al (3.68), and that with the addition of 0.5 % GA are Fe (278.66), C (332.11 %), K (262.09%), Na (254.84 %), O (234.48), respectively. The changes that occurred in their microstructures taken from the wt. % differences show that forty (40) percent of the oxides (wt. %) are reduced in weight, while 60 % increase in weight. Notable among these increases (Table 18b) are Fe (278.66), C (332.11 %), K (262.09 %), Na (254.84 %), O (234.48). However, Ti and Zndisappeared completely with the addition of GA to 10-SFS-concrete. Gum Arabic, therefore, seems to have suppressive effects 0n oxides of Ti and Zn.
4.3.2.3. 20 % SFS and Control Concrete
The microstructure and structural characteristics for the 20 % SFS are shown in Figure 12a and Table 19a. The micrograph shows C-S-H gels with a harsher texture with patches of SFS aggregate because of the higher percentage of SFS replacement. The maximum replacement level of SFS for optimum hydration is 10 % in the literature [1] and in this work. The excess of the 20 % SFS acts as filler material and thus, may justify the harsher texture of the microstructure. The mineral oxides in the 20 % SFS that are considered to impact on the microstructure (wt. % ≥ 3 %) are the oxides of Ca (64.62 %), Fe (6.23 %), Si (13.82 %), and Al (3.61 %). The transformation with this inclusion (Table 19a) shows weight reduction of 53.33 % from their initial weights (Control concrete). Remarkable wt. % differences are noticed with some oxides like Si (363.763 %), and Al (177.69 %), with weights over 100 % increase. Equally important to note are oxides of Fe (42.24 %), S (46.15 %), and Cl (11.76 %), with wt. % less than 100 %, but with remarkable effects. Titanium which appeared in the control concrete disappeared with the addition of 20 % SFS, and Zn appeared as a new oxide.
4.3.2.4. Effect of addition of GA to 20 % SFS Concrete
Figure 19b is the microstructure for the 20 % SFS containing 0.5 % GA. The microstructure shows a more uniform and well dispersed concrete with the formation of C-S- H gel and moderately formed nodules. GA-admixture helped to modify the harsh texture noticed with 20 % SFS concrete (Figure 19a), and reduced the pore sizes, thereby, given a more homogenous texture. The dominant mineral oxides (Table 19c) showing the wt. % ≥ 3 % are Ca (71.84 %), Fe (6.11%), Si (9.87%). The transformations in this instance are evaluated by comparing the mineral oxides in the 20 % SFS concrete with 20 % SFS-GA concrete. The wt. % reduction of 73 % is achieved in this transformation with the following mineral oxides Ca (11.33 %), and O (240.00 %) recorded as increase. The transformation is followed by no appearance of Titanium and the disappearance of Zinc.
4.3.2.5. 10-SFS and 20 % SFS Concrete Compared
The effect of increasing the replacement level from 10 % SFS to 20 % reduced the wt. % in the 10 % SFS concrete sample by 40 %. However, oxides such as Fe (98.3 %), C (26.01 %), K (14.38 %), Si (21.44 %), and Mg (47.83); recorded increase less than 100 %. The implication of this is that it shows minimal effect in the transformation when the use of SFS is more than 10 %. Potassium and Titanium detected in 10 % SFS concrete sample are not found in 20 % SFS concrete sample.
Of importance to note are the appearances and disappearances of Oxygen, Zinc, and Titanium, as hydration proceeded in the presence of GA or SFS, or both (GA + SFS). A summary of such actions is shown in Table 21. Oxygen present in the control concrete disappears with the addition of GA. Oxygen, however, remains with the addition of SFS (10% and 20 %) to the control concrete unlike GA. Therefore, oxygen seems not to be compatible with GA, but compatible with SFS. Zinc and SFS (10 & 20 %) is only compatible with GA when the SFS is > 10 %. The only probable explanation can be tied to the Potassium (1.04 %). Zinc appears in replacement levels of 10 and 20 % SFS (Table 19c) and disappears for 10 % SFS when GA is added. Zinc appears again in 20 % SFS with the addition of GA. The only probable explanation for this behaviour is tied to the oxide of Potassium (1.04 %) whose reaction with GA seems it must be greater than threshold level of 10 % (the maximum replacement level). Therefore, the excess from the 20 % triggers the reaction with the Potassium in the presence of GA to produce the Zinc in the 20 % SFS-GA concrete sample. Titanium is not compatible with GA and only compatibility with 10 % SFS.
Table 21: GA and SFS Effects Compatibility with Some Oxides
| Mineral Oxide | Mix | |||||
| Control | Control + GA | 10-SFS | 10-SFS-GA | 20-SFS | 20-SFS-GA | |
| Oxygen | Appeared | Disappeared | Appeared | Appeared | Appeared | Appeared |
| Zinc | NA | NA | New | Disappeared | Appeared | Appeared |
| Titanium | Appeared | Disappeared | Appeared | Disappeared | Disappeared | Disappeared |
4.4. Acid and Sulphate Effect on Concrete
4.4.1. Acid Exposure Acid Exposure
Table 20 shows the results of the experiments on the Acid and Sulphate media of the recorded deteriorations and growths that occurred at the end of the 56 days of immersions, and for concrete samples with and without GA-admixture. The deteriorations in the H2SO4 medium for both concrete samples at the end of 56 days are 86.3 %, 94.6 %, and 90.8 %, and 85.0 %, 90.8 %, and 80.2 %, respectively. In the HNO3 medium the deteriorations for both concrete samples are 59.0 %, 90.8 %, 80.2 %, and 58.8 %, 88.8%, and 78.6 %, respectively. Comparing the performances of the concrete samples in the Acid medium it is evident that H2SO4 was harsher than in HNO3. However, with the addition of 0.5 % GA there is minimal recovery for both concrete samples.
A cross comparison of the effects between the various mixes of SFS and GA shows that the control concrete (with or without GA) performed better than the SFS-concrete (with and without GA) at the end of 56 days. It was also observed that a better performance was recorded with 20-SFS-concrete than 10-SFS-concrete. Therefore, it may be concluded that with a higher percentage of SFS better performance may be achieved. Ahmad et al [20] reported that acid attacks, due to H2SO4 decreased with the substitution of waste foundry sand (WFS) instead of natural river sand. The least acid resistance was detected at 0 % replacement of WFS, while maximum acid resistance was detected at 40 % replacement of WFS. Concrete is susceptible to acid attack because of its alkaline nature. Sulphuric acid is particularly corrosive due to the sulphate ion in addition to the dissolution caused by the hydrogen causing the deterioration of cement-based materials [9]. Chemical attacks are adjudged as one of the main factors that reduce concrete durability. Many studies on durability problems in Portland cement concretes are associated with the decalcification of C-S-H and formation of new products [10, 11] The consequence of an acid attack has been identified to cause an increase in capillary porosity, a decrease in cohesiveness and ultimately reduced strength [30]. Cracking and disintegration may also occur because of an acid attack.
4.4.2. Sulphate Exposure
The same line of thought is toed in considering the Sulphate effect. The deteriorations (growth) in the Na2SO4 medium for both concrete samples at the end of 56 days are 22.34 %, 45.52 %, 45.54 %, and 20.07 %, 38.76 %, and 43.27 %, respectively. In the MgSO4 medium the deterioration (growth) for both concrete samples are 7.02 %, 9.91 %, 11.89 %, and 6.85 %, 8.72 %, and 8.73 %, respectively. A comparison of the two effects (Na2SO4 and MgSO4) shows harsher effect by Na2SO4 than MgSO4. The same conclusion as for the acid medium can be held for the Sulphate medium. The control concrete (with and without GA) performed better than the SFS-concrete with and without GA. In another investigation fine aggregate (FA) hybrid subjected to exposure condition for 450 days in Na2SO4 and MgSO4 solutions showed that OPC samples were more affected than the FA/OPC samples in Na2SO4. This of course is at variance to the findings of this investigation at 56 days of exposure where the control concrete (with and without GA-admixture) performed better than SFS/OPC. However, FA/OPC expanded more in MgSO4 than in Na2SO4 [31].
CONCLUSION
An evaluation of the hydration of concrete made with spent foundry sand as SCM and gum Arabic (GA) as an admixture and an emulsifier has been conducted with the following conclusions.
i- The crystalline phases and the mineral oxides of the concrete samples are replicates of the effects of the GA and SFS materials as shown in the XRD and microscopy results. The SFS is pozzolanic with a high affinity for water and it occupies more surface area due to its ultra fineness, and thus requires more water demand to achieve the requirements of concrete. The dominant mineral in SFS is Quartz which is a hard crystalline mineral of silica. SFS has irregular shapes of diameters approximately 206 µm to 96 µm and contain micro-porous surfaces with dominant oxides of C, Si, Fe, O, Ta, Pb, and Ca. crystalline in nature, while the GA is amorphous and classified as an emulsifier and an admixture. The GA is an emulsifier and an admixture whose internal structures consist of different pulp- layers, and mainly of high molecular weight polysaccharide and their magnesium, calcium and potassium salts. The dominant oxides are C, O, B, Te, N, Ga, and Ca.
ii- The XRD and SEM results show marked transformations in the crystalline peak heights and relative intensities, and the morphology and structural characteristics of the hydration products arising from the effects of GA and SFS. The addition of these materials either reduced or increased the concrete parameters such as the water absorption density, and compressive strength of the concrete. Therefore, SFS and GA, could be said to be compatible and so good materials for self-compacting concrete (SCC).
iii- The interactions of the oxides of Oxygen, Zinc, and Titanium, in the presence of GA and SFS suggest that the oxide of Oxygen is not compatible with GA but compatible with SFS, while the oxide of Zinc is compatible with GA only for SFS> 10 %. However, the oxide of Titanium is not compatible with GA, and compatible for 10 % SFS.
iv- The performances of concrete samples with GA and SFS in HNO3 medium show better performances than in H2SO4 medium. The performances of concrete samples with GA and SFS show better performances in Na2SO4 r than in MgSO4 medium.
REFERENCES
- Augustine Uchechukwu Elinwa (2014). “Spent Foundry Sand as Partial Replacement of Fine Aggregate in the Production of Concrete.” IOSR Journal of Mechanical and Civil Engineering (IOSR-JMCE) e-ISSN: 2278-1684, p-ISSN: 2320-334X, 11, (5 Ver. V), 76-82.
- Archaneswar Kumar, K. Rajasekhar, C. Sashidhar (2022). “Experimental Research on the Effects of Waste Foundry Sand on the Strength and Micro-Structural Properties of concrete”. Civil Engineering Journal, 8, (10), 2172-2189.
- Rafat Siddique, Gurpreet Singh, Rafik Belarbi, Karim Ait-Mokhtar, Kunal (2015). “Comparative investigation on the influence of spent foundry sand as partial replacement of fine aggregates on the properties of two grades of concrete.” Construction and Building Materials, (83), 216–222.
- Rafat Siddique, Geert de Schutter, Albert Noumowe (2009). “Effect of used-foundry sand on the mechanical properties of concrete.” Construction and Building Materials 23, 976–980.
- Abdeliazim Mustafa Mohamed, Mohd Hanim Osman, Hichem Smaoui, and Mohd Azreen Mohd Ariffin (2018). “Durability and Microstructure Properties of Concrete with Arabic Gum Biopolymer Admixture.” Hindawi Advances in Civil Engineering Volume 2018, Article ID 1962832, 9 pageshttps://doi.org/10.1155/2018/1962832.
- Brzyski P. (2014). “The Influence of Gum Arabic Admixture on the Mechanical properties of Lime Metakaolin Paste Used as Binder in Hemp Concrete. Materials, 14, 6775. https://doi.org/10.3390/ ma14226775.
- Elinwa AU (2021). “Mechanical strengths of sawdust-ash-admixed gum Arabic concrete.” Journal of Modern Materials, 2 (1), 12-29.
- Rohan Jadhav and N C Debnath (2011). “Computation of X-ray powder diffractograms of cement components and its application to phase analysis and hydration performance of OPC cement.” Bull. Mater. Sci., 34, (5), 1137–1150
- Skalny, J; Marchand, J; Odler, I. “Sulphate attack on concrete, Spon Press: London, UK; New York, NY, USA, 2002, ISBN0-419-24550-2.
- Alexander, M.; Bertron, A.; De Belie, N. RILEM State of the Art Reports, RILEM TC 211. In Performance of Cement-Based Materials in Aggressive Aqueous Environments; Springer: Berlin, Germany, 2013; Volume 10.
- Aye, T.; Oguchi, C.T. Resistance of plain and blended cement mortars exposed to severe sulfate attacks. Constr. Build. Mater. 2011, 25, 2988–2996. [CrossRef].
- Augustine U. Elinwa (2016). “Hospital Ash Waste-Ordinary Portland Cement Concrete.” Science Research. 4, (3), 72-78. doi: 10.11648/j.sr.201604.
- Elinwa, A U; Olakunle J O; Duna, S. (2022). “Characteristics of Ordinary Portland Cement Paste Containing Rice Husk Ash and Conplast [SP 430].” Journal of Building Material Science | Volume 04 | Issue 01, 1-10.
- Ogork E.N; Okorie, A U; Elinwa, A.U (2015). “Hydrochloric acid aggression in groundnut shell ash (GSA)-rice husk ash (RHA) modified concrete. Sch. J. Eng. Tech., 2015; 3(2A):129-133.
- Lothenbach, B.; Le Saout, G.; Gallucci, E.; Scrivener, K. Influence of limestone on the hydration of Portland cements. Cem. Concr. Res. 2008, 38, 848–860. [CrossRef].
- Gollop, R.S.; Taylor, H.F.W. Microstructural and microanalytical studies of sulfate attack. IV. Reactions of a slag cement paste with sodium and magnesium sulfate solutions. Cem. Concr. Res. 1996, 26, 1013–1028. [CrossRef]
- BS EN 196 -Methods of testing cement. https//doi/org/10.3403/BSEN 196.
- BS EN 12620: 2013 – Aggregates for concrete.
- ASTM-D7765 › Standard Practice for Use of Foundry Sand in Structural Fill and Embankments
- BS EN 934: European standard – ‘Admixtures for concrete, mortar and grout’.
- Paola Paul, Essia Belhaj, Cécile Diliberto, Komla Lolonyo Apedo and Françoise Feugeas (2021). “Comprehensive Characterization of Spent Chemical Foundry Sand for Use in Concrete. Sustainability, 13, 12881. https://doi.org/10.3390/su132212881
- American Society for Testing and Materials (ASTM) C-618. Standard specification for coal fly ash and raw or calcined natural pozzolan for use in concrete; 2005.
- Garcia Frichnes Missengue Mouanda, Sylvester Ochieng Abuodha, Joseph N. Thuo (2021). “Structural Performance of Concrete mixed with Gum Arabic as a Biopolymer Admixture and Calcined Kaolin as a Partial Replacement for Cement.” SSRG International Journal of Civil Engineering, 8 (11), 41-47, ISSN: 2348 – 8352 doi:10.14445/23488352/IJCE-V8I11P106 ©2021 Seventh Sense Research Group.
- Dirk Lowke and Christoph Gehlen (2017). “The zeta potential of cement and additions in cementitious suspensions with high solid fraction.” Cement and Concrete Research, 95, 195–204.
- Li, H.; Du, T.; Xiao, H.; Zhang, Q. Crystallization of calcium silicate hydrates on the surface of nanomaterials. J. Am. Ceram. Soc. 2017, 100, 3227–3238. [CrossRef].
- Borrmann, T.; Johnston, J.H.; McFarlane, A.J.; Richardson, M.J.; O’Connor, S.J. Nano-structured calcium silicate hydrate functionalized with iodine. J. Colloid Interface Sci. 2009, 339, 175–182. [CrossRef] [PubMed].
- Elinwa AU and Shuaibu SI (2023). A Comparative Study on the Sieve Size Effects on the X-Ray and Microscopy of Spent Foundry Sand-Admixed Concrete. Global J Mater Sci Eng 5 (3): 154 DOI: https://doi.org/10.36266/GJMSE/154.
- Augustine U Elinwa, Mohammed Umar (2017). “X-ray diffraction and Microstructure studies of gum Arabic-cement concrete.” Construction and Building, 156 632–638.
- Khatib, J.M.; Baig, S.; Bougara, A.; Booth, C. Foundry Sand Utilization in Concrete Production. In Proceedings of the Second International Conference on Sustainable Construction Materials and Technologies, Ancona, Italy, 28 June 2010; Citeseer: Princeton, NJ, USA, 2010; Volume 1, pp. 1490–4507
- De Barros Martins, M.A.; Barros, R.M.; Silva, G.; dos Santos, I.F.S. Study on Waste Foundry Exhaust Sand, WFES, as a Partial Substitute of Fine Aggregates in Conventional Concrete. Sustain. Cities Soc. 2019, 45, 187–196. [CrossRef]
- Ahmad, J.; Zhou, Z.; Martínez-García, R.; Vatin, N.I.; de-Prado-Gil, J.; El-Shorbagy, M.A. “Waste Foundry Sand in Concrete Production Instead of Natural River Sand: A Review. Materials 2022, 15, 2365. https://doi.org/10.3390/ ma15072365.
- Valencia-Saavedra W.G. and Mejia de Gutiérrez, R (2020). “Resistance to chemical attack of hybrid fly ash-based alkali-activated concretes.” Molecules, (25), 3389, doi:10-3390/molecules 25153389.