
Strategies and Impacts of COVID-19 Vaccine Rollout: A Deterministic SEIVR Model Approach
- Eirene O. Arierhie
- Ngozika J. Egbune
- Eloho B. Akponana
- Akindele M. Okedoye
- 631-650
- May 16, 2024
- Health
Strategies and Impacts of COVID-19 Vaccine Rollout: A Deterministic SEIVR Model Approach
Eirene O. Arierhie*, Ngozika J. Egbune, Eloho B. Akponana, Akindele M. Okedoye
Federal University of Petroleum Resources, Effurun, Nigeria
DOI: https://doi.org/10.51244/IJRSI.2024.1104047
Received: 07 April 2024; Revised: 22 April 2024; Accepted: 26 April 2024; Published: 16 May 2024
ABSTRACT
Immunization has come to play a key role in our primary health care as it has saved millions of lives yearly since it came into existence. The Corona virus disease (COVID-19) pandemic brought about an urgent need for Covid-19 vaccines. Various researches have been done and are still ongoing to help produce vaccines to help protect people by creating an immune response without the potentially severe illness or post-COVID conditions associated with COVID-19 infection. In this work, vaccine deployment strategies and their impact using a deterministic SEIVR model was examined. This consists of investigating the disease-free and endemic equilibria, basic reproduction number and stability. The local stability of the disease-free equilibrium was determined by solving the Jacobian matrix of the system of the system of differential equations. The study calculated the basic reproduction number, R0 , using the next generation matrix method and found it to be R0=1.1251426e−10. This low value suggests that vaccination efforts can be effective in reducing the spread of COVID-19.
Keywords: Corona virus, basic reproduction number, immunization, pandemic, vaccine
INTRODUCTION
The Corona virus also known as COVID-19 which is caused by a novel virus severe acute respiratory syndrome Corona virus 2 (SARS-CoV-2). In December 2019, the first cases of the disease were reported in Wuhan, China. By January 2020, the disease had spread to other countries, and the World Health Organization (WHO) declared the COVID-19 outbreak as a global health emergency. It was later declared as a pandemic by WHO on March 11, 2020 [1]. It is believed to have originated from a seafood and wet animal market in which the first victims contacted the disease. The virus spreads mainly between people who are in close contact with each other, for example a conversational distance. The virus can spread from an infected person’s mouth or nose in small liquid particles when they cough, sneeze, speak, sing or breathe. To help build immunity against the disease various vaccines have been researched upon and some have been authorized and approved for administration to the public. The COVIS-19 vaccines available are: Pfizer-BioNTech COVID-19 vaccine which are available for people age 6 months and older, Moderna COVID-19 vaccine available for people age 6 months and older and Novavax COVID-19 vaccine available for people age 12 years and older [2]. Although the emergency phase of COVID-19 is over, the virus continues to spread and endanger people’s lives particularly those who are older, have chronic diseases are immunocompromised or pregnant. Safe and effective vaccines help ensure that COVID-19 does not result in severe disease and death. In 2021 alone, COVID-19 vaccines saved an estimated 14.4 million lives worldwide. Strict precautions have also been put in place to ensure the safety of all COVID-19 vaccines. Since 2021, more than 13 billion COVID-19 vaccine doses have been administered globally [3].
The issue of the deployment of the vaccines remains a challenge however, several researchers have been able to suggest ways to go about it. Bilgin et al.[4] explored strategies to address COVID-19 vaccine coverage challenges in Sierra Leone by developing a compartmental model of transmission. The study showed that prioritizing booster doses for older adults and those with comorbidities could reduce severe disease by 23% and deaths by 34%. Booster doses for pregnant women during antenatal care could prevent 38% of neonatal deaths from COVID-19. Vaccination of children should only occur if there are sufficient doses for adults. The conclusions aligned with WHO SAGE guidelines, advocating prioritization for those at high risk and opportunistic vaccination in areas with limited capacity. Reference [5] used a calibrated deterministic SEIRD+V model to simulate the spread and containment of COVID-19, comparing the effectiveness of vaccination and social distancing. The study found that vaccination significantly reduced total deaths, total infections, and peak infections, while social distancing played a role in reducing these outcomes but was less impactful when vaccine efficacy and vaccination fraction were high. The impact of social distancing on total deaths and peak infections was reduced in the presence of effective vaccination. The research used a thresholding approach to evaluate the conditions required to maintain total COVID-19 deaths and peak infections below a 5% threshold. The findings contribute to public health policies for managing COVID-19 and can guide responses to future outbreaks or evolving SARS-CoV-2 variants.
Due to the significant challenges faced by low and middle income countries in accessing COVID-19 vaccines during the early stages of the pandemic, [6]examined vaccine strategies in Thailand, an upper-middle-income country facing COVID-19 vaccine shortages. Using an age-structured model, they compared different vaccination approaches, including heterologous vaccination where CoronaVac (CV) was followed by ChAdOx1 nCoV-19 (AZ), against traditional AZ homologous vaccination. Results showed that combined CV and AZ vaccines, whether in parallel or heterologous schemes, were more effective than solely relying on AZ homologous vaccination. Prioritizing vaccination for the elderly aged 60 and above was most effective in reducing mortality, while prioritizing workers aged 20-59 lowered COVID-19 cases. Rapid vaccine rollout speeds were crucial to reducing infections and deaths, suggesting that low- and middle-income countries should use any available vaccines early in combination with others, instead of waiting for higher-efficacy vaccines. As optimal distribution of vaccines to achieve high population immunity levels is an aim in infectious disease epidemiology, [7] looked into the optimal vaccination strategies using a distributed model applied to COVID-19. The model took into account the heterogeneity of the infected sub-population with respect to the time since infection based on which they analyzed several vaccination scenarios and an optimal vaccination policy. They also considered random vaccination over the whole population and the prioritization of age groups such as the elderly and compared the effects with the optimal solution. Numerical results of the model showed that random vaccination is efficient in reducing the overall number of infected individuals and prioritization of the elderly leads to lower mortality. The optimal strategy in terms of total deaths is early prioritization of those groups having the highest contact rates.
A study on the early rollout of the COVID-19 vaccine in New York City showed that low-income areas with high proportions of older adults had lower vaccination rates and higher COVID-19 mortality rates, while wealthier areas saw many younger people receiving vaccines ahead of schedule. The researchers suggested prioritizing vaccine rollout in low-income areas with more older residents to help reduce overall COVID-19 mortality and urged policymakers to consider local contexts for future vaccine distribution [8]. An age-structured SEIR model was used by [9] to evaluate COVID-19 vaccine allocation strategies in India. The simulations examined different strategies for reducing mortality and morbidity by prioritizing age groups and considered the impact of non-pharmaceutical interventions. The study found that prioritizing vaccines for those over 60 resulted in the greatest reduction in deaths, despite varying vaccine efficacy, rollout speed, or immunity dynamics. However, this strategy also led to higher total symptomatic infections and more pronounced peak incidences compared to other strategies. The research supports global recommendations to prioritize COVID-19 vaccine allocation for older age groups, with the speed of vaccine rollout being a significant factor in determining overall strategy effectiveness. Risk communication plays a critical role in managing risks during the COVID-19 pandemic. As European nations prepare to roll out vaccines to address high death rates and lockdowns in 2020, public willingness to get vaccinated becomes crucial since vaccines are not mandatory [10] examined communication strategies for vaccine rollouts in five European countries: the UK, France, Germany, Sweden, and Switzerland. It identified two key focus areas: communicating the vaccine rollout timeline and expectations, and detailing which groups are prioritized for vaccination. To encourage high vaccine uptake and maintain public trust, they suggested promoting informed consent, following scientific advice, managing expectations carefully, and ensuring transparency about vaccine distribution and uncertainties.
During the COVID-19 pandemic in Italy, various measures were implemented to contain the spread, including non-pharmaceutical interventions and a mass vaccination campaign. Here [11] analyzed the impact of these measures from March 2020 to October 2021 through a time-trend analysis of new confirmed COVID-19 cases, hospitalizations, and deaths. The results showed that with increased immunization coverage starting in March 2021, there was a noticeable decline in COVID-19 cases, hospitalizations, and deaths. Despite differences in implementation, vaccine coverage grew at a similar rate across regions, suggesting that the mass vaccination campaign had a major impact on controlling the pandemic. Additionally, non-pharmaceutical measures like face masks and requiring a green pass for indoor entry were also effective in containing the virus before vaccines became widely available. Reference [12] introduced a panel dataset of COVID-19 vaccine policies from 185 countries and several subnational jurisdictions, documenting vaccination prioritization, eligibility, costs, and mandatory policies using 52 standardized categories. It reveals that “eliminator” countries prioritized border workers and economic sectors, while “mitigator” countries prioritized the elderly and healthcare sectors, with high-income countries typically publishing plans and starting vaccinations earlier than low- and middle-income countries. Furthermore, 55 countries implemented at least one mandatory vaccination policy, showcasing diverse approaches to vaccination strategy and rollout worldwide. Other works by researchers with regards to vaccine and vaccination includes [13], [14], [15] amongst others.
MATHEMATICAL/PROBLEM FORMULATION
In this study, we propose a model which will be based on the SEIVR framework which divides the population into compartments: Susceptible (S), Exposed (E), Infectious (I), Vaccinated (V) and Recovered (R). This model incorporates vaccine deployment strategies and their impact on the dynamics of COVID-19 as the model extends the basic SEIR framework to include compartments for vaccinated individuals and considers parameters related to vaccination deployment and efficacy.
Assumptions: Taking all the subclasses enumerated above into consideration, we assume the following:
1. Recovered population could still become susceptible
2. Exposed persons could either become infected or get vaccinated after exposure.
3. Susceptible individuals can get vaccinated
4. Vaccinated individuals could still become infected as the immunity wanes
5. Infected humans could recover or die due to the disease, every other person in the system could die a natural death.
Owing to the above assumptions, the compartmental block diagram presented below, shows the interaction within the community.
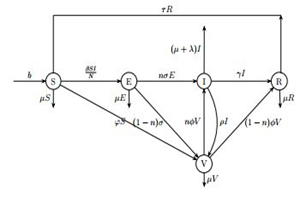
Fig. 1 Compartmental Diagram
Mathematically these interactions are described by a system of ordinary differential equations as shown below:
dSdt=b−βSIN−φS−μS+τR (1)
dEdt=βSIN−nσE−(1−n)σE−μE (2)
µ dIdt=nσE+nϕV−γI−λI−ρI−µI (3)
µdVdt=φS+(1−n)σE+ρI−nϕV−(1−n)ϕV−µV (4)
µdRdt=γI+(1−n)ϕV−µR−τR (5)
Subject to these assumed initial conditions
(S(0)= 9000,E(0)= 400,J(0)= 50,@V(0)=1000,R(0)= 550 (6)
N(t)=S(t)+E(t)+I(t)+V(t)+R(t) (7)
Table I Biological Description of Model Parameters
|
Parameters |
Biological Significance |
Values[16] |
|
b |
birth rate |
0.00018 |
| µµ |
natural death rate |
0.1724 |
| β |
transmission rate without interventions |
0.00414 |
| φ |
rate of vaccination deployment |
0.0115 |
| σ |
rate of transition from exposed to infectious class |
0.09 |
| γ |
recovery rate |
0.15 |
|
λ |
disease-induced death rate |
0.0018 |
| τ |
rate of transition from recovered to susceptible class |
0.075 |
| ϕ |
waning rate of immunity |
0.25 |
| ρ |
rate of infected individuals getting vaccinated |
0.5 |
The assumed values include those of λ,τ,ϕandρ.
METHOD OF SOLUTION
A. Positivity or non-negativity of Solutions
For the model of equations to be epidemiologically meaningful and mathematically well posed, it is necessary to establish that all solutions of system with positive initial data will remain positive for all times t>0. This will be established in the following theorem.
Theorem 1 Suppose
Γ={(S,E,I,V,R)∈R5:S(0)>0,E(0)>0,I(0)>0,V(0)>0,R(0)>0), then the solution set {S,E,I,V,R} is positive for all t≥0.
Proof: Observe that from the (2) equation,
dE(t)dt=βSIN−nσE−(1−n)σE−μE≥−(σ+μ)E (8)
That is
dE(t)E(t)≥−(σ+μ)dt (9)
Integrating the above,
lnE(t)≥−(σ+μ)t+k (10)
Imposing the initial conditions gives
E(t)≥E(0)e−(σ+μ)t (11)
From equation (3), we have
µµdI(t)dt=nσE+nϕV−γI−λI−ρI−µI≥−(γ+λ+ρ+µ)I (12)
That is
µ dI(t)dt≥−(γ+λ+ρ+µ)I (13)
Integrating the above,
µlnI(t)≥−(γ+λ+ρ+µ)t+k (14)
Imposing the initial condition gives
µ I(t)≥I(0)e−(γ+λ+ρ+µ)t (15)
From equation (1)
dSdt=b−βSIN−φS−μS+τR≥−βSIN−(φ+μ)S (16)
That is
dSS(t)≥−(βI(t)N−(φ+μ))dt (17)
Substituting for I(t) and integrating gives
S(t)≥S(0)e(βI(0)N(γ+λ+ρ+µ)e(−(γ+λ+ρ+µ)t))e−(φ+μ)t (18)
Also, using the same procedure equation (4) becomes
dVdt=φS+(1−n)σE+ρI−nϕV−(1−n)ϕV−µV≥−nϕV−(1−n)ϕV−µV (19)
dVV(t)≥−(ϕ+µ)dt (20)
Integrating the above,
lnV(t)≥−(ϕ+µ)t+k (21)
Imposing the initial conditions gives
V(t)≥V(0)e−(ϕ+µ)t (22)
Equation (5) becomes
dRdt=γI+(1−n)ϕV−µR−τR≥−µR−τR (23)
dRR(t)≥−(τ+µ)dt (24)
Integrating the above, µ
lnR(t)≥−(τ+µ)t+k (25)
Imposing the initial conditions gives
R(t)≥R(0)e−(τ+µ)t (26)
It could be observed from equations (7)-(11) that, (1)
S(t)≥S(0),E(t)≥E(0),I(t)≥I(0),V(t)≥V(0), R(t)≥R(0)whent=0 (2)
maxiϕ(t)i=ϕ(0)i∀iatt≥0,wherei=1⋯5, ϕ=(S,E,I,V,R)
It follows that all solutions of the model are non-negative. This completes the proof.
B. Feasible Region for System Solutions
Let us discuss the region in which the total population size exists. It is important to show the region where every solution of the model exists, and all such solutions must be bounded. We shall obtain such bound for the total population size. This is shown in the proof of the theorem below.
Theorem 2 The sets are feasible solution sets for the model(1)-(5) subject to (6).
Proof: We recall that the total human population size at time t is given by
N(t)=S(t)+E(t)+I(t)+V(t)+R(t)
Differentiating this with respect to time, we obtain
dN(t)dt=dSdt+dEdt+dIdt+dVdt+dRdt (28)
=b−μS−μE−μI−λI−µV−µR (29)
=−μ(S+E+I+V+R)+b−λI≤b−μN (30)
dN(t)dt≤b−μN (31)
and solving for N(t) gives
N(t)≤bμ+N(0)e−μt(32) As
t→∞ , we obtain N(t)≤bμ(33)
Therefore, the threshold human population level is b/μ . It follows that the feasible solution sets of the model remain in the regions:
Γ1={(S,E,I,V,R)∈R+5:0≤S+E+I+V+R=N≤b/μ)
. Observe that if the population is higher than the threshold level, the population reduces to the carrying capacity. If the population is less than the threshold level, then the solutions of the model remain in the invariant region for all t>0. Therefore, the regions Γ1 are positively invariant. This completes the proof.
C. Equilibrium Point
An equilibrium point refers to a stable state in the dynamics of an infectious disease within a population. It represents a situation where the prevalence of the disease remains constant over time, with no significant changes occurring in the number of infected individuals.
I)TheDisease-free Equilibrium Point (DFEP):This represents the average size of each of the compartments when the entire population is free from the infection. It is denoted by E0. We obtain E0 by equating the right-hand side of the model (1) to zero and solving the resulting algebraic system of equations. Since we are considering the disease-free equilibrium point, we put I=0, and which when substituted into the equations gives E=V=R=0. We then have:
S=bµ+φ (34)
Therefore,
E0=(bµ+φ,0,0,0,0)
II) The Endemic Equilibrium Point (EEP):The endemic equilibrium point is the average size of each of the model compartments, when the disease has become part of the human population. The model admits an endemic equilibrium Ee=(S,E,I,V,R)e when I>0. Ee is obtained by equating the right-hand side of the model (1) to zero and solving the corresponding system. Thus, we obtain the following result:
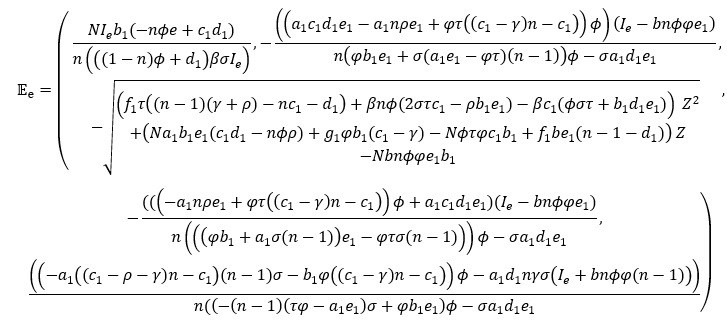
Where: a1=φ+µ,b1=σ+µ,c1=γ+λ+ρ+µ,d1=ϕ+µ,e1=µ+τ,f1=βnϕσ,g1=Nnϕτ
D. Local Stability of the Disease-free Equilibrium
We shall use the Jacobian matrix J(E0) in establishing the local stability of the disease-free equilibrium. The Jacobian matrix which is evaluated at the disease-free equilibrium, is given by
Theorem 3 The disease-free equilibrium (DFE) is locally asymptotically stable if R0<1 and unstable if R0>1.
Proof: For local stability, the Jacobian matrix with respect to the system of equations at the disease-free equilibrium is given by:
[−a10−βba1N0τ0−b1βba1N000nσ−c1nϕ0φd2ρ−d1000γe2−e1]
Where:
a1=φ+µ+Λ,b1=σ+µ+Λ,
c1=γ+λ+ρ+µ+Λ,d1=ϕ+µ+Λ,
d2=(1−n)σ,e1=µ+τ,e2=(1−n)ϕ
The polynomial equation is given by
AZ5+BZ4+CZ3+DZ2+EZ+F
Where,
A=Na1
B=Na1(a1+b1+c1+d1+e1),
C=Na1(a1(b1+c1+d1+e1)+b1(c1+d1+e1)+c1(d1+e1)+d1e1−nσβbNa1−ρnϕ),
D=a12N(b1(c1+d1+e1)+c1(d1+e1)+d1e1)+Na1(b1c1(d1+e1)+d1e1(b1+c1)−ρnϕ(a1+b1+e1)−e2φτ)+βbn(ϕ(φ−d2)−σ(a1+d1+e1)),
E=(Na1b1c1d1e1−Nγnϕτφa1−Nnϕρa12b1−Nnϕρa1e1(a1+b1)−Nτa1φe2(b1+c1)+Na12(b1c1(d1+e1)+(b1+c1)d1e1)+bβn(ϕφ(b1+e1)−(a1+e1)(ϕd2−σd1)−σa1e1)),
F=(Na12b1(c1d1−nϕρ)e1−Nτφa1b1(γnϕ+c1e2)+bβn(ϕe1φb1−ϕe1a1a2−σa1d1e1+στφe2))
By Descartes rule of signs [17], the number of negative real roots of f(x) is given by the number of sign changes of f(x) or is less than the number of sign changes of f(−x) by an even number. Here, the sign from left to right are ++++++
f(−x)=A(−Z)5+B(−Z)4+C(−Z)3+D(−Z)2+E(−Z)+F(35)
=−AZ5+BZ4−CZ3+DZ2−EZ+F
Here the sign changes from – to +, + to –, – to +, + to –, – to +
Therefore, the number of negative solutions is 5. Hence from the above the disease-free equilibrium is locally asymptotically stable. This completes the proof.
E. The Basic Reproduction Number
The basic reproduction number is the average number of secondary infections caused by a single infectious individual in an entirely susceptible population during his/her infective period. The next generation matrix approach is used to obtain R0 . Let X(t)=(E,I) and obtain that X′(t)=F(t)−V(t)
where:
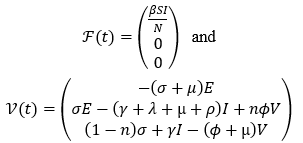
Evaluating the derivatives of F and V at the disease-free equilibrium point obtained above, yields FV−1 as seen below:
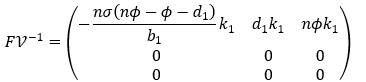
where βSN(γnϕ−c1d1)=k1
By solving the dominant eigenvalue of the next generation matrix FV−1, we get the basic reproduction number to be
Where: b1=σ+µ,c1=γ+λ+ρ+µ,d1=ϕ+µ,S=bµ+φ
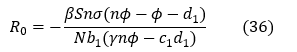
Therefore, the basic reproduction number of the given system of equations denoted by R0 is:
R0=−βbnσ(nϕ−µ−2ϕ)N(µ+φ)(σ+μ)(γnϕ−(γ+λ+µ+ρ)(ϕ+µ))
Using the values in table 1 and the initial conditions in equation (6) we get
R0=1.1251426e−10<1
F. Sensitivity Analysis
Intervention strategies to reduce the mortality and morbidity due to covid 19 perhaps any other epidemiology treatment and control should target the parameters that have a high impact on the effective reproduction number, R0.Sensitivity analysis is used to obtain the sensitivity index that is a measure of the relative change in a state variable when a parameter changes. We compute the sensitivity indices of R0 to the model parameters with the approach used by [18]. These indices show the importance of each individual parameter in the disease transmission dynamics and prevalence. The sensitivity of a parameter, say β, of R0 is defined as
ξβR0=∂R0∂β×βR0 (14)
The sensitivity indices of the parameters are thus presented as follows:
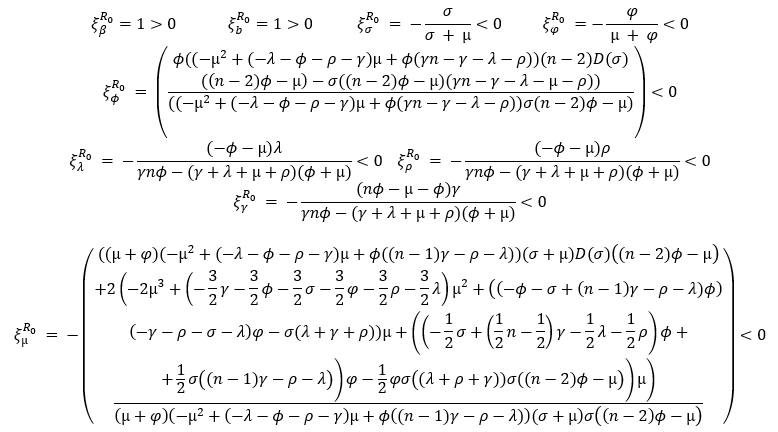
The analysis revealed that the positively sensitive parameters of the basic reproduction number, R0 are the recruitment rate (b) into the susceptible class, the probability (β) that each contact is effective enough to cause infection and the waning rate of immunity. Thus, reducing the number of susceptible individuals, reducing or eliminating contact with infected persons and the waning immunity rate can greatly lower the value of the basic reproduction number (R0) and thereby increasing the stability of the disease-free equilibrium. Increasing the values of the positively sensitive parameters has the effect of increasing the value of the basic reproduction number (R0), which implies an increase in the endemicity of the disease since the indices have positive signs. On the other hand, when the parameter values σ,φ,λ,ρ,γ and μ are decreased while the rest of the parameter values are kept fixed, the value of R0 decreases. This shows a decrease in the disease endemicity because the indices have negative signs.
NUMERICAL SIMULATIONS
A. Method of Solution
The ‘dsolve’ command in computer algebra systems, such as those like Maple or Mathematica, provides a method for finding numerical solutions to ordinary differential equations (ODEs)
Table II Numerical values of sensitivity indices of R0
|
Parameter |
Sensitivity Index |
| β |
1.0000 |
| b |
1.0000 |
| σ |
-0.3430 |
| φ |
-0.0625 |
| ϕ |
-0.5782 |
| λ |
-0.0023 |
| ρ |
-0.6269 |
| γ |
-0.1547 |
| μ |
-2.2324 |
or systems of ODEs. When used with the ‘numeric’ or ‘type=numeric’ option, it computes a numerical solution. This command is versatile and can handle both initial value problems (IVPs) and boundary value problems (BVPs), as well as initial differential algebraic problems. The maple software was used in this case and a function within the ‘plots’ package, ‘odeplot’ was used to plot the result while another function ‘plots[display]’ also in the ‘plots’ package was used to display the graph in two-dimensional plane.The result of the above procedure is discussed below.
B. Discussion of Result
From Fig. 2 through to 6, we see the effect that the natural death rate has on each of the classes. A higher natural death rate can reduce the size of the susceptible population over time as individuals leave the population due to natural causes which could slow down the spread of the disease. On the exposed class a higher natural death rate reduces the number of individuals in this class before they become infectious which leads to a lower number of individuals transitioning to the infectious class. On the infectious class the impact of the natural death rate depends on the disease induced death rate as shown in Figure 7. If the death rate from the disease is higher than the natural death rate, the infectious class would decline due to deaths but if the natural death rate is higher, it may counteract the effect of the disease on the infectious class. The natural death rate influences the vaccinated population by potentially reducing the overall vaccinated population size. The natural death rate affects the recovered class by contributing to the number of individuals who leave the infectious class due to death. Fig. 14 and 15 displays the effect of the rate of infected humans getting vaccinated on both the infectious and vaccinated classes respectively. When infected individuals get vaccinated, they move from the infected class to the vaccinated class which reduces the number of actively infected individuals in the population. On the other hand, the number of vaccinated individuals increases as infected individuals receive vaccination which contributes to the growth of the vaccinated class, potentially reducing the susceptible population and slowing down the spread of the disease.
Fig. 8 displays the effect of waning immunity on the vaccinated class as a higher waning rate means that over time individuals lose their immunity to the disease thereby making them more susceptible to reinfection which can lead to an outbreak of the disease. The effect of rate of transition from exposed to either infectious or vaccinated class on exposed, infectious and vaccinated classes can be seen in Fig. 9, 10 and 11 respectively. A faster transition rate from the exposed class to either the infectious or vaccinated classes means that individuals spend less time in the exposed state which results in a smaller number of individuals who are exposed but not yet showing symptoms or immune responses. If the transition rate from exposed to infected is high, it can lead to a quicker progression of the disease within the population resulting in more individuals becoming actively infected. Also, a higher transition rate from exposed to vaccinated means that more individuals are getting vaccinated after exposure to the disease. This can contribute to a faster increase in the vaccinated population, potentially reducing the susceptible population and slowing down the spread of the disease.
Fig. 12 and 13 shows the effect of rate of vaccination deployment on both the susceptible and vaccinated classes. As susceptible individuals receive the vaccine, they move to the vaccinated class thereby reducing the number of susceptible individuals in the population which helps in decreasing the number of individuals who are at risk of getting infected. The rate of susceptible individuals taking the vaccine determines the pace at which the vaccinated population grows. A higher rate of vaccination results in a faster increase in the vaccinated population thereby providing greater immunity within the population and slowing down the spread of the disease. Fig. 14 displays the effect of the rate of infected humans getting vaccinated on the infected classes. Increasing the rate of vaccination among infected individuals can reduce the number of infectious individuals and potentially decrease the spread of the disease within the population. Fig. 15 shows the effect of transition from vaccinated to recovered class. As more individuals transition from the vaccinated to the recovered class, the proportion of the population with immunity increases. Vaccinated individuals who transition to the recovered class are no longer susceptible to the disease and cannot transmit it to others which helps to reduce the number of individuals capable of spreading the infection potentially leading to faster control of the disease outbreak.
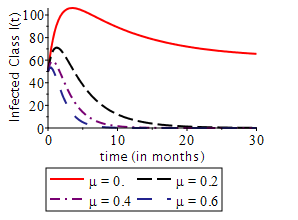
Fig.2 Effect of natural death rate on the infected class
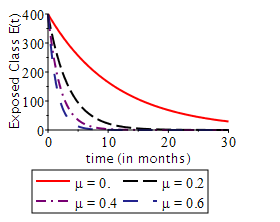
Fig.3 Effect of natural death rate on the exposed class
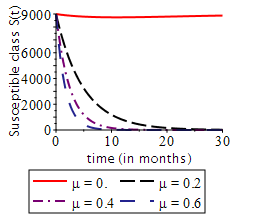
Fig. 4 Effect of natural death rate on the susceptible class
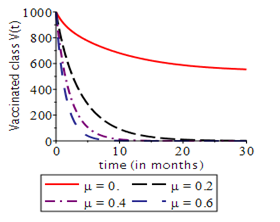
Fig. 5 Effect of natural death rate on the vaccinated class
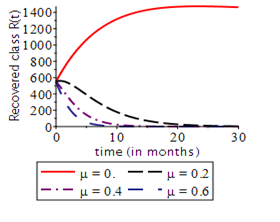
Fig. 6 Effect of natural death rate on the recovered class
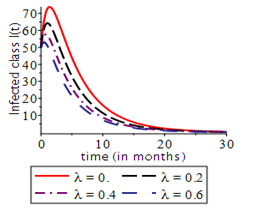
Fig. 7 Effect of disease induced death on infected class
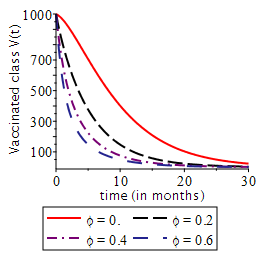
Fig. 8 Effect of waning immunity on the vaccinated class
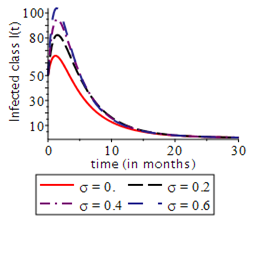
Fig.9 Effect of rate of transition from exposed to either infectious or vaccinated class on the infected class
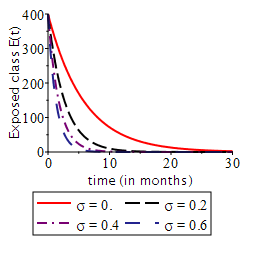
Fig. 10 Effect of rate of transition from exposed to either infectious or vaccinated class on the exposed class
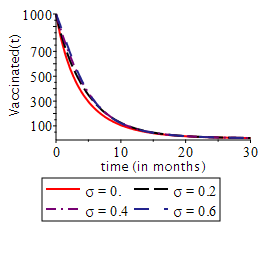
Fig. 11 Effect of rate of transition from exposed to either infectious or vaccinated class on the vaccinated class
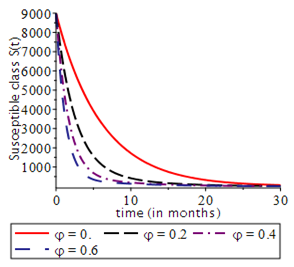
Fig. 12 Effect of rate of vaccination deployment on susceptible class
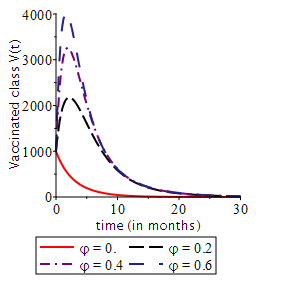
Fig. 13 Effect of rate of vaccination deployment on vaccinated class
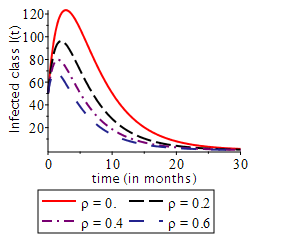
Fig. 14 Effect of rate of infected humans getting vaccinated on the infected class
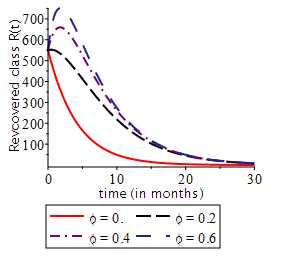
Fig. 15 Effect of rate of transition from vaccinated to recovered class on the recovered class
CONCLUSION
In this paper, we examined a SEIVR model to explore the vaccine deployment strategies and their impact on the dynamics of Covid-19. We determined the existence and local stability of the disease-free equilibrium along with the existence of the endemic equilibrium. The study calculated the basic reproduction number, R0, using the next generation matrix method and found it to be R0=1.1251426e−10. This low value suggests that vaccination efforts can be effective in reducing the spread of COVID-19. Also, from the numerical simulations of the model, it was shown that the spread of the disease can be reduced greatly when vaccination is being deployed but when the rate of vaccination deployment is low, it leads to an increase in the spread of the disease. We recommend that further researchers should consider validating their results with real-world data to ensure accuracy. Explore conditions for backward bifurcation and include non-pharmaceutical interventions to determine optimal control strategies and also, explore model extensions to account for emerging factors like new virus variants and global vaccine distribution challenges.
ACKNOWLEDGEMENTS
The authors express gratitude to the Federal University of Petroleum Resources for fostering a conducive research environment that facilitated the timely and high-quality development of this report.
REFERENCES
- Cennimo, D. J. (2023, June 12). Corona virus Disease 2019 (COVID-19). Retrieved from A Medscape Web site: https://emedicine.medscape.com/article/2500114-overview#a1
- Mayo. (2023, November 3). Get the facts about COVID-19 vaccines-Mayo Clinic. Retrieved March 2024, 2024, from A Mayo Clinic Website: https://www.mayoclinic.org/diseases-conditions/Corona virus/in-depth/Corona virus-vaccine/art-20484859
- WHO. (2023, December 5). COVID-19 Vaccines Advice. Retrieved March 24, 2024, from A WHO Website: https://www.who.int/emergencies/diseases/novel-Corona virus-2019/covid-19-vaccines/ advice
- Bilgin, G. M., Lokuge, K., Jabbie, E., Munira, S. L., & Glass, K. (2023). COVID-19 vaccination strategies in settings with limited rollout capacity: a mathematical modelling case study in Sierra Leone. BMC Public Health, 2466(2023). doi:https://doi.org/10.1186/s12889-023-17374-0
- Alexander, J., & Husham, S. (2022, October 27). A SEIRD+V Model for the Effect of Vaccination and Social Distancing on SARS-CoV-2 Infection and Mortality. Journal of Scientific & Technical Research, 46(5), 37866-37880. doi:10.26717/BJSTR.2022.46.007413
- Anupong S, Chantanasaro T, Wilasang C, Jitsuk NC, Sararat C, Sornbundit K, Pattanasiri B, Wannigama DL, Amarasiri M, Chadsuthi S, Modchang C. Modeling vaccination strategies with limited early COVID-19 vaccine access in low- and middle-income countries: A case study of Thailand. Infect Dis Model. 2023 Nov 15;8(4):1177-1189. doi: 10.1016/j.idm.2023.11.003. PMID: 38074078; PMCID: PMC10709621.
- Angelov, G., Kovacevic, R., Stilianakis, N. I., & Veliov, V. M. (2022). Optimal vaccination strategies using a distributed model applied to COVID-19. Central European Journal of Operations Research, 31(2), 499-521. doi:https://doi.org/10.1007/s10100-022-00819-
- Schwalbe, N., Nunes, M. C., Cutland, C., Wahl, B., & Reidpath, D. (2024). Assessing New York City’s COVID-19 vaccine rollout strategy: A case for risk-informed distribution. Journal of Urban Health, https://doi.org/10.1007/s11524-024-00853-z
- Foy, B. H., Wahl, B., Mehta, K., Shet, A., Menon, G. I., & Britto, C. (2021). Comparing COVID-19 vaccine allocation strategies in India: A mathematical modelling study. International Journal of Infectious Diseases, 103, 431–438. https://doi.org/10.1016/j.ijid.2020.12.075
- Warren, G. W., & Lofstedt, R. (2021). COVID-19 vaccine rollout risk communication strategies in Europe: a rapid response. Journal of Risk Research, 24(3–4), 369–379. https:// doi .org/ 10. 1080/ 13669877.2020.1870533
- Reno, C., Sanmarchi, F., Stoto, M. A., Fantini, M. P., Lenzi, J., & Golinelli, D. (2022). The impact of health policies and vaccine rollout on the COVID-19 pandemic waves in Italy. Health Policy and Technology, 11(2), 100604. https://doi.org/10.1016/j.hlpt.2022.100604
- Cameron-Blake, E., Tatlow, H., Andretti, B. et al. A panel dataset of COVID-19 vaccination policies in 185 countries. Nat Hum Behav 7, 1402–1413 (2023). https://doi.org/10.1038/s41562-023-01615-8
- Yang, B., Yu, Z., & Cai, Y. (2022). The impact of vaccination on the spread of COVID-19: Studying by a mathematical model. Physica A: Statistical Mechanics and its Applications, 590, 126717.
- Wagner, C. E., Saad-Roy, C. M., & Grenfell, B. T. (2022). Modelling vaccination strategies for COVID-19. Nature Reviews Immunology, 22(3), 139-141.
- Diagne, M. L., Rwezaura, H., Tchoumi, S. Y., & Tchuenche, J. M. (2021). A mathematical model of COVID-19 with vaccination and treatment. Computational and Mathematical Methods in Medicine, 2021.
- Mwalili, S., Kimathi, M., Ojiambo, V., Gathungu, D., & Mbogo, R. (2020). SEIR model for COVID-19 dynamics incorporating the environment and social distancing. BMC Research Notes, 13(1), 352. https://doi.org/10.1186/s13104-020-05192-1
- Hosch, W. L. (2011, April 28). Descartes’s rule of signs. Encyclopedia Britannica. https://www.britannica.com/science/Descartess-rule-of-signs
- Chitnis, N., Hyman, J., & Cushing, J. (2008). Determining important parameters in the spread of malaria through the sensitivity analysis of a mathematical model. Bulletin of Mathematical Biology, 70 (4), 1272-1296. https://doi.org/10.1007/s11538-008-9299-0