
The Extent of Land Use Changes in Nnewi Metropolitan Area, Anambra State and it’s Planning Consideration.
- EGBUNA O.K.
- EDMUND. A. IYI
- CHIJIOKE, Edmond Ogochukwu
- 959-967
- Jun 17, 2024
- Urban and Regional Planning
The Extent of Land Use Changes in Nnewi Metropolitan Area, Anambra State and it’s Planning Consideration.
1EGBUNA O.K., 2EDMUND. A. IYI, 2CHIJIOKE, Edmond Ogochukwu.
1Department of Urban and Regional Planning, Nnamdi Azikiwe University Awka, Anambra State, Nigeria.
2Department of Urban and Regional Planning. Enugu State University of Science and Technology, Enugu State, Nigeria.
DOI: https://doi.org/10.51244/IJRSI.2024.1105061
Received: 10 May 2024; Accepted: 18 May 2024; Published: 17 June 2024
ABSTRACT
One of the prime prerequisites for better use of land is information on the existing land use patterns and changes in land cover. The land use dynamics of the metropolitan areas present complex challenges and opportunities for sustainable urban development. One major factor that influences effective land use planning and sustainable development but has not been adequately addressed is the absence of a database on the rate of urban growth in most developing countries, Nigeria inclusive. This study focuses on the trend of land use change in Nnewi metropolitan area, which has accelerated the main driver of land use and land cover change with a concomitant effect on the environment. It relied on data generated from remote sensing and geographic information systems to create the map and examine the land cover change in the study area. The classification of land cover using LANDSAT data and land cover transitions for 30 years (1993–2023) were mapped, and the net land cover change was computed. The results showed an increase in the urban built-up area, ranging from 2.24% in 1993 to 20.34% in 2023. The dispersion pattern revealed a large concentration of the built-up spaces to be in the northern region, and the expansion continued from west to south and south-east. The study recommends the need for urban planners to decentralize urban planning and development control with adequate provision of affordable urban facilities at the peripheries of cities in Nigeria. Furthermore, massive integration of green infrastructure in built-up areas is required to mitigate the effects of vegetation loss in the area.
Keywords: Spatial growth dynamics; Land use; planning implications; remote sensing.
INTRODUCTION
Land-use change is one of the main drivers of environmental change. It influences the basic resources of land, including the soil. Its impact on soil often occurs so creepingly that land managers hardly contemplate initiating ameliorative or counterbalance measures. Poor land management has degraded vast amounts of land, reduced our ability to produce enough food, and is a major threat to livelihoods in many developing countries (Sebhatleab, 2014). Examining how land use styles, infrastructure improvement, and population distribution adjust in reaction to exclusive inner and external impacts is the look at of spatial growth. Local policy choices and international economic pressures are two examples of these forces. Understanding the dynamics of city increase, population shifts, and the consequences of diverse forces on the spatial shape of towns and areas is made simpler with the resource of this approach. Researchers can examine the efficacy of packages, spot tendencies, and provide guidance for sustainable development plans that take into account the complex relationships among human activity and the environment by way of the usage of spatial boom studies (Reia, Rao, Barthelemy, & Ukkusuri 2022). Urbanization and spatial growth are significantly influenced by a trend of population increase and population out-migration. A city or region that is experiencing such a surge in population may have to record a rate of growth proportional to the rise in population with a commensurate high demand for housing, infrastructure, and services. Economic activities that encourage spatial growth include industrialization, availability of jobs and investment. Economic growth and development would have the tendency to be localized, thereby generating urbanization and suburban sprawls. Technological innovation, through the spread of transportation and communication networks, could alter the landscape once again. Improved mobility would generate greater decentralization of metropolitan areas since people could now afford to stay at a greater distance from the central business district but would still be in touch. The zoning regulations, land use planning, and infrastructural investments influence the physical arrangements of urban spaces and pattern residential, commercial, and industrial development. In other words, the natural resources, climatic conditions, and ecological sustainability can impact change in spatial growth (Ahmed, Bramley, Verburg, 2014). Cities can grow in directions where they are ecologically friendly, wherein the ecological balance will be a consideration for the planners during development. Cultural preferences, social dynamics, and lifestyle choices are also contributors to spatial growth change. Preferences for urban living, suburban lifestyles, or rural retreats can influence the distribution of population and development (Kumar, Pathan, & Bhandari 2007).
Additionally, this growth is taking place more in the Global South, and most places continue to record urban growth in this regard with impacts on land noted at regional and local environmental dynamics levels. This is further attested to by Montgomery and Hewett (2005) and also by Arifeen, Phoungthong, Mostafaeipour, Yuangyai, Techato, & Jutidamrongphan, (2021), that the land use or cover changes have really occurred at the highest rates in the developing countries. Therefore, it may imply that cities in the developing countries are doubling their built-up or impervious surface areas so as to accommodate the growing population. This is further expounded in the literature that has established the fact that urban areas’ global growth is a significant front in habitat destruction. It all begins with habitat loss and eventually leads to species’ extinction. The most significant human-led landuse activity has been urbanization, which has had massive and irreversible impacts on the ecological ecosystem. It is one of the main driving factors to changes in land use, climate, vegetation cover, biogeochemical cycle, hydrological processes, and loss of biodiversity (Cohen, 2006; Okeke. Uzuegbunam, Nnaemeka-Okeke, & Ezema, 2021). Still, another factor that can be associated with the unprecedented rate of urban sprawl is population growth (Daramola & Ibem, 2010; Echendu, Okeke, & Nnaemeka-Okeke, 2020). While in the past century the growth of cities has been from small isolated population centers to large, interlinked urban centers with colossal human populations and massive physical infrastructure. The land use and land cover transformations as cited by Lilly and Monsingh (2009) to contribute to the major differences. In most instances, natural surfaces are replaced by high-reflective parking lots, concrete pavements, asphalt roads, and other surfaces creating urban heat islands, together with some other adverse environmental and social challenges. A typical example of this was in 2012 when the Lagos state government planned gentrification for the Makoko waterfront, looking to solve the social development of the community with asphalt plains, concrete boxes, and cubic glass phallic symbols. Indeed, human activities within the urban environment are now giving more concern to the local climate system, considering the upsurge in these activities (EPA, 2016). For instance, the state of affairs is even worse in such cases as poorly planned rapid spatial growth in the urban areas, often leading to an increased threat to sustainable development when it is not synchronized with the development of physical infrastructure or when there is poor implementation of well-developed policies that provide enough guidance and support for the growth. Particularly in quickly growing metropolitan areas like Nnewi, the spatial growth dynamics of the urban areas are vital factors to take into account during the planning and development process.
The Nnewi Metropolitan Area as one of Nigeria’s rapidly expanding metropolitan centers, offers an engaging case study for analyzing the complex interactions between urban growth and planning considerations. Nnewi, a Nigerian town in the state of Anambra, has grown and changed dramatically in recent years, the city which is renowned for its industrial might and spirit of entrepreneurship, has seen a major increase in population, economic activity, and infrastructure development. The inevitable geographical growth brought about by this migration has altered the metropolitan area’s social and physical landscape. Understanding the geographical growth dynamics of the Nnewi Metropolitan Area requires a thorough approach that takes into account the myriad of factors that contributed to its expansion. Changes in land use, transportation networks, economic trends, government frameworks, and demographics are a few examples of these issues. Planners and policymakers may create successful strategies to manage the consequences of urban growth and obtain insights into the underlying drivers of urban growth by taking a comprehensive look at these factors. Furthermore, for the Nnewi Metropolitan Area to ensure sustainable development and improve the quality of life for its citizens, planning issues related to the area’s spatial growth are crucial. Important issues include land use conflicts, inadequate infrastructure, environmental deterioration, and social inequality must be addressed by successful urban planning projects. Additionally, they must work to advance equitable growth, financial stability, maintain the city’s cultural legacy and character while promoting environmental sustainability.
Enoguanbhor, Gollnow, Nielsen, Lakes & Walker (2019) evaluated the change in urban land cover in the Abuja (Federal Capital Territory) region of Nigeria in 1987, 2002, and 2017 using GIS and remote sensing techniques in an effort to comprehend landuse and land cover change in sub-Saharan cities. According to the report, the categories of bare land cover and urban/built-up areas grew while the green belt shrank. The authors also noted discrepancies between the current land use plan and the historical and current land cover. A mismatch between uncontrolled city expansion and the land use plan was documented in previous studies conducted in different Nigerian cities (Umunnakwe, Abarikwu, & Azubuine, (2018); Umunnakwe & Azubuine, 2019a; 2019b; Chukwurah, Okeke, Isimah, & Igwe, 2022), and this mismatch was linked to a variety of elements, including commercialization and industrialization, the advancement of transportation and communication, the provision of recreational and educational amenities, the economic attraction of cities, and advancements in technology. Numerous cities in the Global South have seen an increase as a result of fast urban growth. If urbanization occurs within acceptable bounds, good things can come of it. However, excessive urbanization or the indiscriminate expansion of cities may have unfavourable outcomes like the overstretching of the current infrastructure beyond its capacity, the growth and proliferation of slums, an increase in the cost of living, a rise in crime, pollution, traffic congestion, air, sewer, and water pollution, noise, and pollution. According to several academics (Sahoo 2016; Merem, Twumasi, Wesley, Isokpehi, Fageir, Crisler, Romorno et al. 2018; Arora, Fatima, Mishra, Verma, Mishra, & Mishra, (2018), land degradation, biodiversity loss, a shortage of drinkable water, and climate change are some of the major issues connected to fast urban growth. The urban environmental challenges associated with Nigerian urbanization have been studied in the past by researchers like Daramola and Ibem (2010); others have looked at urban land use patterns and spatial changes in Nsukka, Enugu State (Umunnakwe, Abarikwu, & Azubuine, 2018); Umuahia Abia State (Umunnakwe & Azubuine, 2019); and land use spatial changes in Enugu State, South Eastern Nigeria (Umunnakwe & Azubuine, 2019b); as well as how Enugu’s landuse structure affects urban mobility (Okeke, 2021). Present information on land cover change in Nnewi Metropolis is required given the city’s present rapid spatial growth. This study’s primary goal is to close this gap by evaluating the extent of land use changes and the planning implications they have for the Nnewi Metropolitan Area. It also examines the patterns, drivers, and consequences of these dynamics for urban planning. It looks at historical patterns and forecasts future ones in an effort to offer insightful analysis to decision-makers, urban planners, and other stakeholders who are involved in determining the course of the city in the future. By means of pre-emptive and deliberate planning measures, Nnewi can optimize its expansion prospects while averting possible obstacles, ultimately cultivating a more a robust, liveable, and successful metropolitan setting for its people.
THE METHODOLOGY
Nnewi metropolis is located in Anambra State, south-eastern Nigeria. It is situated in the south-eastern part of Nigeria and, more specifically, in the Anambra South Zone. Nnewi metropolis is known for its industrial and commercial activities and is one of the major urban centers in the state. It is not far from the city of Onitsha, which is another prominent city in south-eastern Nigeria. Nnewi Metropolitan geographic coordinates are approximately 5055’0”N–6050’00”N latitude and 6050’0”E and 7000’0”E longitude (see Figure 2). The boundaries of the Nnewi metropolitan area are not precisely defined by universally accepted administrative or geographic standards. The area is bound in the east by the Aguata local government area, in the west by the Ogbaru local government, in the in the north by the Idemili South and Anaocha local government areas, and in the in the south by the Ihiala local government area (see Figure 1). Metropolitan areas often develop organically, and their boundaries can be somewhat fluid and subject to interpretation. Additionally, metropolitan areas can expand over time due to urbanization and population growth. The Nnewi metropolitan area generally includes Nnewi city and other local government areas surrounding it, which are characterized by economic, social, and cultural connections to Nnewi.
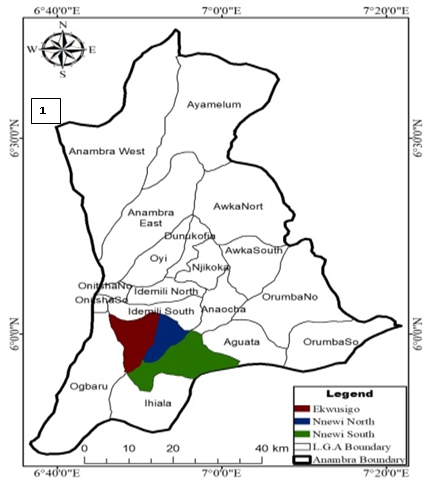
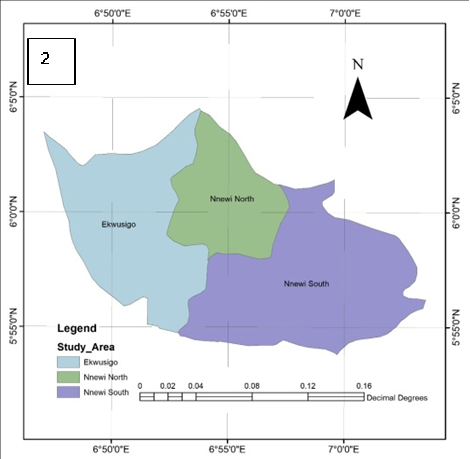
Figure 1: Map of Anambra State showing the three Figure 2: The study area
LGAs… The study area
The Nnewi Metropolitan Area has witnessed one of the fastest population growths in the state. The annual growth rates witnessed in the area for the past sixteen years are 2.24% per annum for the three local government areas (UN-HABITAT, 2009; Anambra Bureau of Statistics, 2022). According to the 2006 census projected figure, the population of the three local government areas that make up the Nnewi Metropolitan Area is 800,456, with an average annual growth of 2.24% per annum recorded during the past sixteen years (UN-HABITAT, 2009).
Remote sensing and the Geographic Information System (GIS) were used to gather the data for this investigation. This was done in order to map the region to record, examine, and evaluate the metropolitan area’s spatial growth pattern and geographic distribution. The study’s design allows for the collection of comprehensive data on the growth trend every ten years, beginning in 1993 and continuing through 2003, 2013, and 2023. In this study, four Periods of virtualized Landsat series images for 1993, 2003, 2013, and 2023 were retrieved from the Earth Explorer website (2023) through the Internet search engine. The downloaded satellite pictures were created from the source and were ortho-rectified, also known as georeferenced L1T (terrain corrected). The geometric accuracy was verified through superimposition and comparison with pre-existing maps, nevertheless. The coordinate system was specifically validated and projected to Minna Datum, WGS 1984, and UTM Zone 32. Using the information from the header file and the radiometric calibration module of ENVI-5, the digital numbers (DN) were converted to at-sensor radiance to perform the radiometric correction.
RESULT AND DISCUSSION
The outcome (see Figure 3) displays the Nnewi Metropolitan Area’s land cover in 1993. The city region’s built-up area is comparatively modest, with the most of it located near the north and few at the west end. The percentage of land cover and other factors in 2003 are also depicted in Figure 4. Figure 4 shows that although the bare ground area has been heavily covered by flora, the extent of the city’s built-up area has expanded. These findings show that over a ten-year period, the built-up area of Nnewi metropolis has grown by 3.3%, whereas the amount of open space and vegetation cover has decreased by 2.33% and 0.79%, respectively. In a similar vein, Figures 5 and 6 show the Nnewi metropolis’s built-up area, vegetation cover, open space, and water body in 2013 and 2023, respectively.
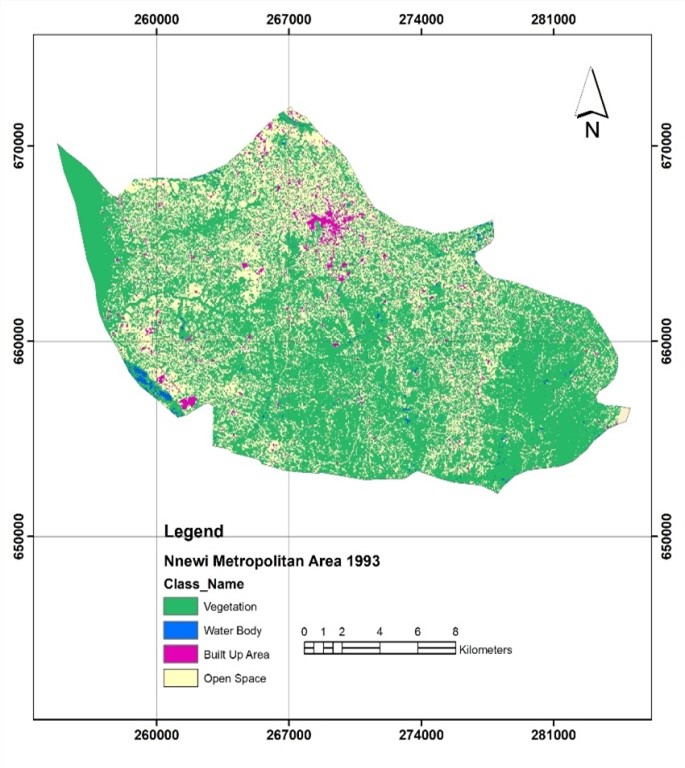
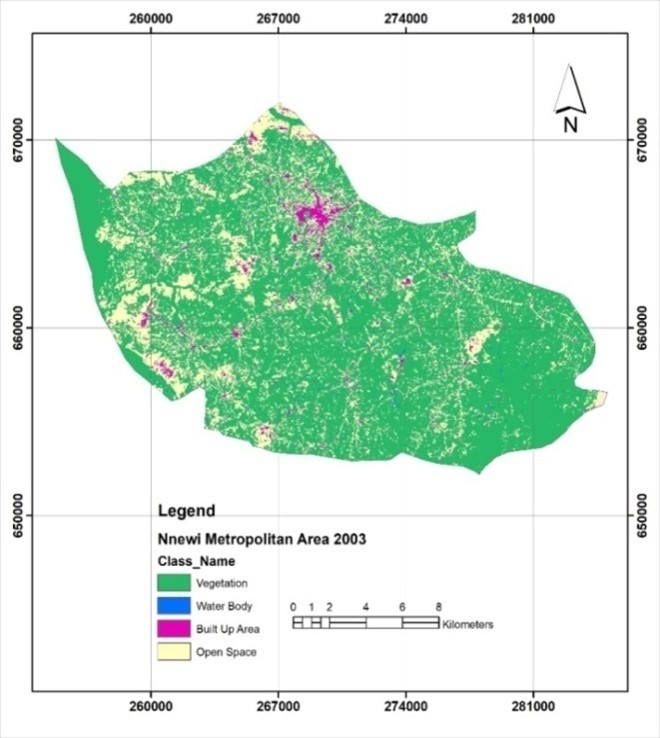
Figure 3: LULC 1993 Figure 4: LULC 2003
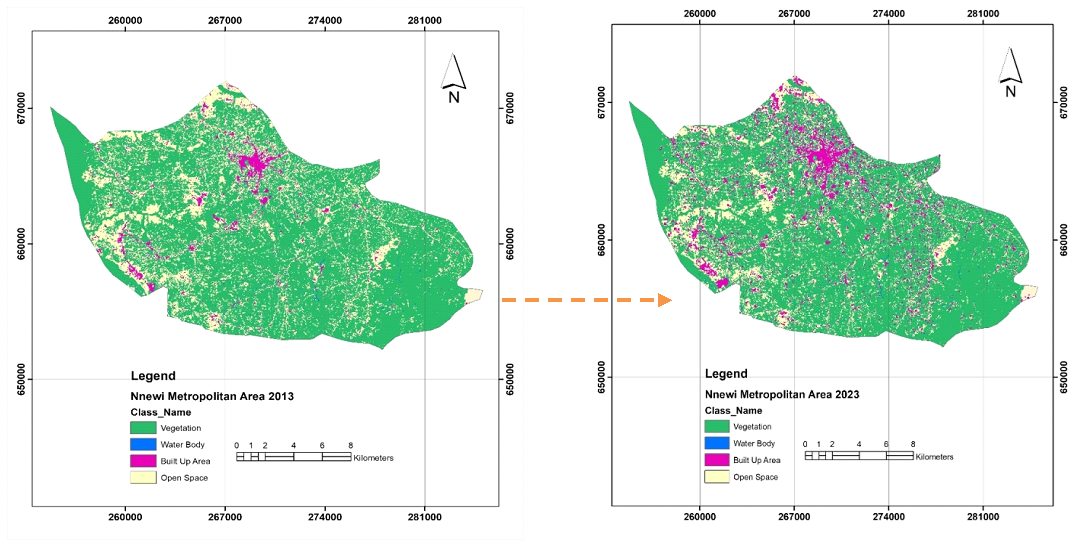
Figure 5: LULC 2013 Figure 6: LULC 2023
Table 1 presents a comparison of the built-up area, the greenbelt vegetation cover, the open space, and the water bodies in the study area as recorded by GIS and a remote sensing technology between 1993 and 2023. Analyzing the data shows that throughout the 30-year period from 1993 to 2023, the built-up area rose by 69.94 km2, or roughly 20.34%, while the vegetation cover decreased to 227.73 km2, or roughly 66.23%. Comparably, the open space has shrunk to 43.35 km2, or roughly 12.60% less, whereas just 0.81% was observed in the change of water body in the study area.
Table 1: Landcover/landuse distribution of Nnewi Metropolitan Area from 1993 to 2024
| 1993 | 2003 | 2013 | 2023 | |||||
| % | Area | % | Area | % | Area | % | Area | |
| Built-up Area | 2.24 | 7.7 | 5.54 | 18.75 | 9.37 | 32.22 | 20.34 | 69.94 |
| Water | 1.15 | 3.94 | 1.06 | 3.65 | 0.85 | 2.94 | 0.81 | 2.81 |
| Open Space | 22.53 | 77.47 | 20.20 | 69.45 | 17.11 | 58.83 | 12.60 | 43.35 |
| Vegetation | 74.08 | 254.72 | 73.29 | 251.98 | 72.66 | 249.84 | 66.23 | 227.73 |
| Total | 100 | 343.83 | 100 | 343.83 | 100 | 343.83 | 100 | 343.83 |
Source: Researchers computation (2024)
Table 2 also presents the human population dynamics in the research area for those reference years. It is clear that between 1993 and 2003, the research area’s population increased from 389,391 to 502,557. The population increased by 22% between 2003 and 2013, meaning that there were 627,329 more people living there in 2013 than there were in 2003 (502,557). Based on calculations, the population of 800,456 in 2023 will have grown by 34% (Table 2). The data in Table 2 makes it clear that the metropolitan area is experiencing rapid population increase, which has a significant impact on cities’ spatial growth, particularly when it comes to the conversion of green spaces into developed forms like social and economic infrastructural facilities.
Table 2: Population of the study area
| Year | Population | |||
| Nnewi North | Nnewi South | Ekwusigo | Total | |
| 1993 | 116,523 | 154,106 | 118,762 | 389,391 |
| 2003 | 145,410 | 208,945 | 148,202 | 502,557 |
| 2013 | 181,511 | 260,820 | 184,998 | 627,329 |
| 2023 | 231,604 | 332,800 | 236,052 | 800,456 |
| Source: Projected 1991 & 2006 census figure (2024) | ||||
Figure 2 illustrates and quantifies the spatial pattern of land cover for 1993. It shows that the built-up and urbanized regions (purple patches) were centered mostly in the north. About 2.24 percent of the land was made up of urbanized and built-up areas, 74.08 percent consisted of greenbelt vegetation, 22.53 percent consisted of open space, and 1.15 percent consisted of water bodies. According to the distribution pattern, 5.45% of the metropolitan region’s total area was made up of urbanized and built-up areas in 2003. According to Figure 3, vegetation accounted for 73.29 percent of the land, open space for 20.20 percent, and water for 1.06 percent. Similar to this, the 2013 study’s findings showed that the coverage of urbanized and built-up areas increased from the north to the northwest, accounting for 9.37 percent of the total land area; greenbelt vegetation covered 72.66 percent of the area, open space made up 17.11 percent, and water covered 0.85 percent (Figure 5). Additionally, in 2023, the results (see Figure 6) showed that the land area was distributed throughout, with urbanized and built-up areas making up 20.34 percent; greenbelt vegetation accounted for 66.23 percent, while open space and water accounted for 12.60 percent and 0.81 percent, respectively. The numerous nuclei theory, which postulates that cities have multiple development points from which growth radiates, appears to be supported by these data. One could argue that, among other things, the observed spread of the built area from the north to other areas of the region was caused by the fast increase in the human population, as Table 2 illustrates. This is in line with the findings of Raynolds and Holwell (2010) regarding the direct influence of demographic factors on urban growth.
Furthermore, the results of the transition mapping demonstrate a rapid urban explosion at the expense of greenbelt cover, and the spatial distribution pattern clearly demonstrates that the urbanized and built-up areas were primarily centered in the area’s north and have continued to scatter throughout the metropolis. These findings further demonstrate unregulated and rapid urban development in the absence of any land use plan in the state. The boundaries of urban development, however, did not mark the end of urban expansion. Urban areas kept expanding from Nnewi North into Nnewi South and into the Ekwusigo local government region between 2003 and 2023. In the city region, several land uses designated for intensive farming, animal production, and environmental conservation have been lost to built-up and urbanized regions, and this loss has been worse recently. In 1993, there was only 2.24 percent of the region’s land covered by built-up areas, when the majority of the area was made up of a few isolated homes. The percentage of built-up and urbanized regions increased to 5.54 percent in 2003. The percentage went from 9.37% in 2013 to 20.34% in 2023. These results also highlighted how rapid urban expansion has led to a major loss of greenbelt and a sharp decline of open space in tandem with the growth of metropolitan areas. The research area’s vegetation covering and open space have decreased.
CONCLUSION
The spatial growth patterns of the Nnewi metropolitan area were examined in this study, along with the planning implications. The statistics demonstrated an increase in built-up and urbanized regions, which resulted in a decrease in open space and greenbelt vegetation cover. The kinds of land cover that showed the largest observed net change were vegetation, followed by built-up, urbanized, and open space. Since land intended for nature reserves, intensive farming, and livestock production is now being replaced by the haphazard urbanization process and unplanned city expansion, the shrinkage of the vegetation zone and removal of open space are now important concerns. Urgent action is required to guarantee that developers intentionally work to enhance the green content of the city by including green infrastructure into residential, commercial, and industrial constructions, given the significant loss of vegetation cover. To do this, an appropriate land use plan needs to be implemented, increasing the existing percentage of developable areas within plots and allocating a larger share to the provision of vegetation, such as trees, shrubs, and grasses. Furthermore, urban greenbelts must to be included into the urban landscape, particularly in the places where the city is now growing. The urbanized region within the Nnewi metropolitan area has been extending eastward and southward. This suggests that in order to guarantee strict adherence to the proposed city master plan, state urban planners should focus more on the observation of physical developments along these city axes. Additionally, the study suggests that physical planning and monitoring operations in the city and its environs should be expanded to include peri-urban areas as well as adjacent towns and neighbourhoods, rather than being limited to the central business district (CBD). A thorough investigation should be conducted into the administrative issues preventing land use plans from being developed. According to the study, it is possible to implement critical steps toward strategic and comprehensive action (such as land use policies and compliance) by offering such geographic information. For efficient land use planning to enhance ecological sustainability and urban growth, these statistics are essential.
REFERENCE
- Ahmed, S.J., Bramley, G., & Verburg, P.H. (2014). Key Driving Factors Influencing Urban Growth: Spatial-Statistical Modelling with CLUE-s. In: Dewan, A., Corner, R. (eds) Dhaka Megacity. Springer Geography. Springer, Dordrecht. https://doi.org/10.1007/978-94-007-6735-5_7
- Anambra State Government (2022). Facts about Anambra State. Anambra state.gov.ng. [accessed]16/9/2023.
- Arifeen, H.M., Phoungthong, K., Mostafaeipour, A., Yuangyai, N., Yuangyai, C., Techato, K., & Jutidamrongphan, W. (2021) Determine the Land-Use Land-Cover Changes, Urban Expansion and Their Driving Factors for Sustainable Development in Gazipur Bangladesh. Atmosphere 12, 1353. https://doi.org/ 10.3390/atmos12101353
- Arora, N.K., Fatima, T., Mishra, I., Verma, M.K., Mishra, J., & Mishra, V. (2018). Environmental sustainability: challenges and viable solutions. Environmental Sustainability, 1, 309-340. https://doi.org/10.1007/s42398-018-00038
- Chukwurah, G.O., Okeke, F.O., Isimah, M.O., & Igwe, A. E. (2022) Assessment of the performance of railway transportation in Nigeria from 1970 to 2010. Scientific African 15 (6) 1-12 e01120 https://doi.org/10.1016/j.sciaf.2022.e01120
- Cohen, B. (2006) Urbanization in Developing Countries: Current Trends, Future Projections, and Key Challenges of Sustainability. Technology in Society. 28, 63-80 http://dx.doi.org/10.1016/j.techsoc.2005.10.005
- Daramola, S.A & Ibem, E.O. (2010). Urban Environmental Problems in Nigeria: Implications for Sustainable Development. Journal of Sustainable Development in Africa (JSDA), 12(1), 124-145
- Earth Explorer, http://earthexplorer.usgs.gov/. 2019.
- Echendu, I.F., Okeke, F.O. & Nnaemeka-Okeke, R.C. (2020). An investigation of challenges in the existing pattern of intra-city traffic in Enugu metropolis. Tema. Journal of Land Use, Mobility and Environment, 13 (2), 191-208. http://dx.doi.org/10.6092/1970-9870/6097
- Enoguanbhor, C., Gollnow, F., Nielsen, J.O., Lakes, T & Walker, B.B (2019). Land Cover Change in the Abuja City-Region, Nigeria: Integrating GIS and Remotely Sensed Data to Support Land Use Planning. Sustainability, 11, 1313: 1-18 doi:10.3390/su11051313
- EPA (2016) Climate Impacts on Society. United States Environmental Protection Agency Document. Available online @ https://19january2017snapshot.epa.gov/climate-impacts/climate-impacts-society_.html. Accessed 12th June, 2020
- Kumar, J. A. V., Pathan, S. K., & Bhanderi, R. J. (2007). Spatio-temporal Analysis for monitoring urban growth: A case study of Indore city. Journal of the Indian Society of Remote Sensing. 35, 11-20
- Lilly, R. A. & Monsingh, D. D. (2009). Analysis of Land Surface Temperature and Land Use/Land Cover Types Using Remote Sensing Imagery. The seventh International Conference on Urban Climate, Yokohama, Japan. 29 June – 3 July 2009
- E.C., Twumasi, Y., Wesley, J., Isokpehi, P., Fageir, L., Crisler, M., Romorno, C., Hines, A., Ochai, G.S., Leggett, S., & Nwagboso, E. (2018). Analyzing emerging environmental issues in major areas: the case of Lagos in South west Nigeria. Architecture Research. 8(1), 19–38. http://dx.doi.org/10.5923/j.arch.20180801.03
- Montgomery, M.R. & Hewett, P.C. (2005). Urban health in developing countries: Household and neighbourhood effects. Demography, 45, pp. 397-425
- Okeke, F. O (2021) Analyzing the Role of Architects in Achieving the Sustainable Cities Goal by 2030 In University-Led Knowledge and Innovation for Sustainable Development. Published by Boldscholar Research Ltd. Abuja, Nigeria Pp. 104-112
- Okeke, F.O., Echendu, F.I. & Nnaemeka-Okeke, R.C. (2021) Determinants of intra-urban travel in southeast Nigeria; evidence from city of Enugu, Transport Problem 16 (4); 185–198, doi:10.21307/tp-2021-070.
- Reia, S.M., Rao, P.S.C., Barthelemy, M. & Ukkusuri S.V (2022).Spatial structure of city population growth. Nat Commun 13, 5931. https://doi.org/10.1038/s41467-022-33527-y
- Reynolds, M. & Holwell .S. (2010) “Introducing Systems Approaches. In Systems Approaches to Managing Change: A Practical Guide”; Reynolds, M., Holwell, S., Eds.; Springer: London, UK; pp. 1–23.
- J (2016). Solid waste management as green infrastructure: Pune. DMN 602: climate change and sustainable development, Indian institute of technology, Roorkee center of excellence in disaster mitigation and management. [accessed 2019 May 4] www.academia.edu//solid_waste_manage ment_as_green_infrastructure
- Sebhatleab .M. (2014) Impact of land use and land cover change on soil physical and chemical properties: a case study of Era-Hayelom tabias, northern Ethiopia. United Nations University Land Restoration Training Programme [final project] http://www.unulrt.is/static/fellows/document/Sebhatleab2014.pdf
- Umunnakwe, C., Abarikwu, K.O., & Azubuine, E.C (2018). Analysis of Urban Land Use Pattern and Spatial Changes in Nsukka, Enugu State, South-Eastern Nigeria. Journal of Physical Science and Environmental Studies. 4 (1), 1- 9
- Umunnakwe, H. C & Azubuine, C. E. (2019a). Analysis of Land use Spatial Changes in Enugu State, South Eastern Nigeria, West Africa, Journal of Urban Psychology and Environmental Reasoning, 27 (4), 247 -255
- Umunnakwe, H. C & Azubuine, C. E. (2019b). Examining Urban Spatial Land Use Changes in Umuahia South, Abia State, Nigeria. Journal of Environmental management and Safety Volume 10: 11-20.
- UN-HABITAT, (2009). Executive summary plans for Awka, Onitsha and Nnewi https://unhabitat.org/books/executive-summary-of-structure-plans-for-awka-onitsha-and-nnewi-and-environs-2009-2027/executive-summary-of-structure-plans-for-awka-onitsha-and-nnewi-and-environs-2009-2027/ [accessed ] 7/8/2023