
The Impact of Financial Performance on Capital Structure Decisions of Selected Consumer Goods Companies Listed on the Nigerian Stock Exchange (2001-2019)
- Zakariyah, Mariam Adetoun
- Isiaka, Olawale Kabiru
- 436-453
- Mar 19, 2024
- Finance
The Impact of Financial Performance on Capital Structure Decisions of Selected Consumer Goods Companies Listed on the Nigerian Stock Exchange (2001-2019)
Zakariyah, Mariam Adetoun1, Isiaka, Olawale Kabiru2
1,2Department of Accounting, Faculty of Economics and Management Sciences, University of Ibadan, Ibadan
DOI: https://doi.org/10.51244/IJRSI.2024.1102034
Received: 13 February 2024; Accepted: 15 February 2024; Published: 19 March 2024
ABSTRACT
The study examines the impact of financial performance on capital structure decisions of selected consumer goods companies listed on the Nigerian Stock Exchange (2000-2019), using panel data for both dependent and independent variables which were analyzed through fixed effect model and random effect model, pooled regression model, Hausman test and descriptive analysis. Pecking order theory was adopted as the bedrock of this study and the population of the study included ten consumer companies listed on the Nigeria stock exchange for nineteen years. Findings showed that financial performance has significant positive and negative effect on retaining earnings financing, but the possibility of greater ploughed back profit is higher when company’s financial performance increases. Similarly, financial performance has both significant positive and negative effect on equity finance decision of companies. The study recommended that decision on capital structure should be taken optimally by considering the cost of each capital structure since financial performance has significant effect on all the capital structure.
Keywords: Capital Structure, Financial Performance, Stakeholders Expectations, Firms
INTRODUCTION
For any organization to perform creditably well and fulfill the business objectives as desired by stakeholders, there must be a strong focus on how the business should be funded to ensure capital adequacy that strengthens the going concern of such entity. It is often said that cash to business is like blood to human body systems. Therefore, decision making process by operations managers or business leaders on how best to fund the business must be shaped by the dynamics and realities that surround its establishment.
Obviously, starting a business, no matter the type and extent of its size would require satisfying conditions like the type of investments to be taken by the firm, assets to be acquired like buildings, machinery, and equipment, required cash flow for everyday activities, and source of financing for the business.
According to Baker & Powell (2005), financial managers usually faced with two major decisions, which are financing decisions and investment decisions. Whether newly incorporated business, or an exciting one, funds are required to carry out business activities. This fund is referred to as capital. Capital therefore refers to the means of funding a business. There are two methods of capital sourcing i.e., the internal and the external sources.
Capital structure decision is an important one since the enterprise profitability is precisely affected by such decision. The key element of financial strategy lies the use and successful selection of capital (Kajananthan, 2012). As capital adequacy is important, financial managers must consider capital budgeting which entails firm’s long-term investments, capital structure and planning of business operations. Accordingly, Myers & Majluf, 1984 posited that the optimal firm capital structure can be achieved when the cost of debt financing is below it benefits.
According to Ogebe, Ogebe and Alawi, 2013, when making capital structure decision, a healthy financing mix or capital structure should be adopted. This is because, a wrong mix of finance could seriously affect business performance and survival.
Statement of the Problem
One of the primary objectives of most of quoted companies is to ensure stakeholders satisfactions even when expectations vary. Shareholders expect a reasonable return on their investment in the company, the company’s employees expect a fair wage or salary, managers of a company want higher remuneration, lenders want returns of borrowed funds with cost of capital, government expect tax returns, and customers also expect product satisfaction and many other stakeholders’ expectations depending on the nature of the company.
However, capital structure of organizations is mostly connected with lenders and shareholders expectations and interest protections. The shareholders may want managers to source for debt financing with the view of preserving their interest of share depletion and they may want retained earnings distributed to maximize their share capital than reinvestment whose outcome is associated with uncertainty while the lenders will want to protect their interest upon repayment promise fulfillment and borrowing organization’s continuous debt financing structure in the long run. This is because such profitable firms can finance their investment opportunities with retained earnings. The cost of asymmetric information will be minimized if firms can use internal financing sources or issue low-risk debt (Soku and Jong, 2003).
Also, managers of business may be interested in equity financing to reduce pressure on them with respect to debt financing repayment scheme compared to equity financing where shareholders bear the burden of organization performance. This will result to conflict of interest among concerned shareholders as related to capital structure. Many researchers have done justice to this conflict of interest and its effect on capital structure and how choice of capital structure affects organization performance (see Eniola, Adewunmi, and Akinselure (2017), Ogebe, Ogebe and Alawi (2013), Ishaya and Abduljeleel (2014), Ayad and Mustafa (2015), Terzungwe and Abdulateef (2016), Goyal (2013), Salawu (2009), Igwe, Ogar and Ogbuu (2017), Akinyomi (2013), Younus, Ishfaq, Usman And Azeem (2014), Babatunde (2016), Ayange, Emmanuel, Rosemary, Ndudi and Samuel (2021) and many others).
There are scanty studies except for Otieno and Ngwaney (2015) and Fatoki, Wafula, and Waweru (2021) that investigated the reverse causal relationship between capital structure and financial performance even though there were both done outside Nigeria. Although, Yinusa, Russell, Somoye, Alimi, and Ilo (2016), Fatoki (2017) and Fatoki (2018) seeks to establish a bidirectional relationship between capital structure and firm performance in Nigeria, invariably their study failed to consider other capital structure decisions (in terms of debt financing option, equity financing option and retained earnings) that properly assess the reverse causality situation in Nigeria. Therefore, rest upon this backdrop this study was conducted to ascertain the impact of financial performance on capital structure decisions of selected firms in Nigeria against the usual impact of capital structure decision on firm financial performance.
Objectives of the Study
The objectives of this study are to examine:
- The impact of financial performance on retained earnings of selected listed consumer goods companies in Nigeria.
- The effect of financial performance on equity financing option of selected listed consumer goods companies in Nigeria.
- The effect of financial performance on debt financing option of selected listed consumer goods companies in Nigeria.
LITERATURE REVIEW
Capital and Capital Structure
Capital structure is the appropriate mix of debt and equity in firm’s mode of financing. The ratio of debt to equity in financial structure is known as financial leverage. For any investment decision to be considered, the firm must consider the financing option, that is when considering investing in an asset, the firm must consider the best financing option that will bring about an increase in the stakeholder’s fund and in turn have multiplier effects on firm’s value (Mahvish, 2012).
Aliu (2010) defined firm’s capital structure to be the combination of equities and financial liabilities. Alfred (2007) refers capital structure to the proportion of debt and equity in the total capital structure of the firm while Pandey (1999) in trying to differentiate between financial structure and capital structure affirmed that the means of raising funds constitute firm’s financial structure, while the capital structure deals with the proportionate relationship between long-term debt and equity. Capital structure according to Ajayi and Obisesan (2020) referred to how organizations finance it assets through some combination of equity, debt, or hybrid securities.
Financial Performance
Suleiman (2013) regards firm’s performance as how well a company acc its goals and objectives. He believed financial performance provides a deductive measure on how well a company uses or can use it assets for operations. Financial performance is a subjective measure of how well firms can use assets from its primary mode of business to generate revenues Van Horn (2005). Firms’ financial performances are significant to stakeholders and the economy at large. Investors are interested in investment returns, lenders are interested in debt and interest payment, communities are interested in corporate social responsibility, government is interested in taxation, staffs are interested in improvement in working conditions and many more.
Asset Tangibility and Capital Structure
Asset tangibility is measured as the total fixed asset over the total asset of a firm. If a firm’s tangible assets are high, then the firm assets can be used as collateral upon issuance of debt, which in return will protect lenders from moral hazard problem. This indicate that firms with high level of tangible assets would likely make more use of debt financing. In line with static trade of theory, it was suggested that companies use tangible assets as collateral to provide lenders with security in the event of financial distress Chen and Wong (2004) and Rajan and Zingales (1995).
Profitability and Capital Structure
Profitability can be defined as earnings before interest and tax (EBIT) scaled by total assets. It was suggested that firms with high profits tends to use more of debt, as it has greater need to shield income from corporate taxes Huang and Song (2006). However, the contrary, pecking order theory suggested that firms tend to use more of retained earnings as first resort of investment before debt and new equity.
Liquidity and Capital Structure
Liquidity is defined as a ratio of current asset and current liabilities. According to pecking order theory, firms with high liquidity will borrow less. Deesomsak, Paudyal & Pescetto, 2004 affirmed that managers can manipulate liquid assets in favor of shareholders against the interest of debt holders while increasing the agency cost of debt. Another researcher, Oztekin & Flannery (2012) discovered that firms with more liquid assets often use them as another internal source of funds instead of debt, which invariably led to debt capital reduction. Thus, a negative relationship between liquidity and leverage is anticipated.
Firm size and Capital Structure
Firm size can be measured using as firm total assets. Pecking order theory submitted that firm size and leverage are negatively related. This pattern could be true because large firms suffer are equipped with information and have better access to capital markets; hence would employ more equity than debt while smaller firms are prone to information asymmetric problem; therefore, tend to use more debt than equity (Rajan and Zingales, 1995).
Theoretical Framework
Pecking order theory was adopted as a theoretical framework for the study based on the fact that, the theory assumes there is no target capital structure, rather organization finances and financing are subject to organizational performance under normal circumstances. Also, unlike other theories, pecking order theory captures all financing options covered in the objective of the study and for the purpose of organizational decision making. This position was strengthened by Myers and Majluf, (1984) as they asserted that pecking order theory allows firms to have a particular preference order for capital used to finance their businesses to meet stakeholders’ expectations.
Conceptual Framework
For any organization to lay claim on retained earnings as a form of capital, it must have performed financially well and therefore, such organization’s capital structure should be tailored towards a healthy financial performance. It is important to note that many researchers have undertaken studies in relation to the impact of Capital Structure on Financial performance. However, this study intends to examine the impact of Financial Performance on the Capital Structure of selected consumer goods companies listed on the Nigerian Stock Exchange. The following conceptual framework was adopted which represents the relationship between the variables involved in the study.
Shows the relationship between independent variables and dependent variables
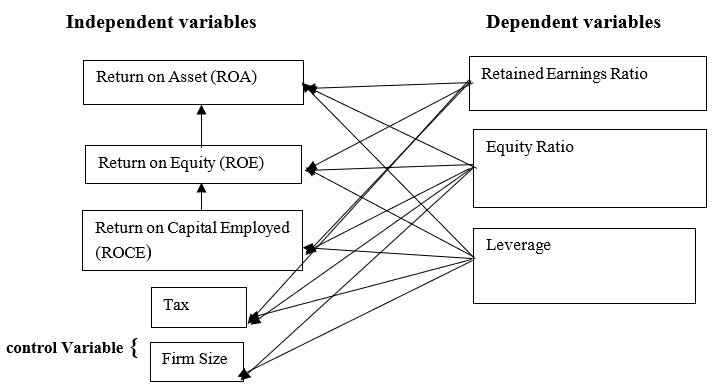
Source: Author’s Computation, 2022
Empirical Review
Fatoki, Wafula, and Waweru (2021) examined the portability of the reverse causality hypothesis between financial performance and capital structure of listed manufacturing firms in Kenya using data from 7 companies between 2010 to 2016 and Panel Vector Auto regression analysis. The result revealed that past performance did not have a significant effect on the capital structure as measured by total debt ratio while it was established that capital structure composition of the firms affected their financial performance as measured by return on assets and return on equity. Fatoki (2018) examined the effect of financial performance on capital structure of listed non-financial firms in Nigeria. This was guided by assessing the earnings per share on capital structure choice using Generalized Methods of Moments for analysis, it was discoevered that earning per share is statistically significant at all levels of Capital Structure. The study concluded that both the efficiency risk and franchise value hypotheses of the reverse causality hypothesis are observable in the capital structure choice of the firms in Nigeria.
Yet another study done by Fatoki and Nasieku (2017) where they carried out further studies on 86 non-financial firms listed on the Nigerian Stock Exchange on the effect of financial performance on capital structure choice. The findings revealed a positive and statistically significant relationship between market to book value of equity and capital structure as measured by total leverages while a negative result was recorded against debt equity ratio and long-term leverage.
Berger and Bonaccorsi di Patti (2006) and Margaritis and Psillaki (2010) both studied the effect of leverage on firm efficiency while considering the reverse causality between efficiency and the firm capital structure. It was discovered from both studies that there exists a positive relationship between leverage and efficiency. In Nigeria similar study was conducted by Yinusa, et.al (2016), which made a departure from proxying efficiency as the performance measure, instead return on equity. They found support for the franchise value hypothesis. However, the study failed to consider other financial performance variables to properly assess the reverse causality situation in Nigeria.
Salawu (2009) carried out his study on the effect of capital structure on the profitability of listed firms in Nigeria. Quantitative secondary data was adopted from 1990 to 2004 using ordinary least square method, fixed effect, and random effect to test significance of relationship the variables. It was discovered that profitability had positive correlation with short term debt and equity, while an inverse correlation was observed for long term liabilities. This implies that profitability is enhanced with increased use of short-term debt and equity and decrease profitability with the use of long-term liabilities. However, some research works revealed negative relationship between capital structure and financial performance. Osuji and Odita (2012), studied the impact of capital structure on the financial performance of Nigerian firms between 2001 to 2007 using ordinary least square method to analyze data obtained. It was revealed that the firms’ capital structure proxy by debt ratio had significantly negative impact on the firm’s financial measures. Ishaya and Abduljaleel (2014) researched on capital structure and profitability of Nigerian quoted firms. The study was anchored to the agency cost theory. Findings revealed that debt ratio was negatively related with profitability, while equity was directly related to profitability. Suleiman and Ahmad (2016) studied the impact of capital structure on firm performance in Nigeria with a sample of seven companies from the Building Material Industry that are listed on the Nigerian Stock Exchange from 2000 to 2010. The findings indicated that short term debt had significant impact on firms’ performance and long-term debt had significant negative impact on the firm’s performance. It was also discovered that equity had impact on firm performance but weak negative relationship between equity and return on asset.
Other foreign researchers also shared same views with the above Nigerian researchers along the traditional theory of capital structure. Muhammad, Ahsan and Kiran (2017) used Pakistan data from 2006 to 2015. The data was analyzed using descriptive statistic, correlation, and panel least square methods. Findings shows that the debt ratio had significant negative relationship with return on asset and return on equity, while short term debt had significant positive link with return on assets and return on equity. Achichi (2013), Tharmaila and Aruvel (2013) and Puwanen thiren Pratheepkanth (2012) also followed Muhammad et al (2017) using Sri Lanka data for varying periods and adopted regression analysis on the data obtained. They discovered that capital structure had negative impact on profitability of the listed food and beverage sectors companies. Mahfuzah and Raj (2012) utilized Malaysian data from 1995 to 2011 and conducted regression analysis. It was discovered that firm performance had negative relationship with capital structure.
METHODOLOGY
This study adopted secondary data of ten unresearched listed consumer goods companies in Nigeria for the period of nineteen (19) years from 2001 to 2019. The data were obtained from audited financial reports and accounts of selected companies on the Nigeria Stock Exchange (NSE).
Table 1: List of Selected Consumer Goods Companies
| S/N | NAME |
| 1. | NESTLE NIGERIA PLC |
| 2. | VITAFOAM PLC |
| 3. | CADBURY NIGERIA PLC |
| 4. | GUINESS NIGERIA PLC |
| 5. | PZ CUSSONS NIGERIA PLC |
| 6. | NIGERIA BREWRIES PLC |
| 7. | UNILEVER NIGERIA PLC |
| 8. | FLOUR MILLS NIGERIA PLC |
| 9. | INTERNATIONAL BREWERIES PLC |
| 10. | DANGOTE SUGAR REFINERY PLC |
Source: Author’s Computation, 2022
Static panel regression model was adopted for the study because of the heterogeneity among the consumer goods companies. The dependent variable was capital structure while the independent variable was financial performance and control variables which include corporate tax and firm size.
Capital structure= f(financial performance ,corporate tax and firm size)….(i)
Re-specification:
Capitalstructure=f (RER, ER, DER, LEV)………………………………………(ii)
Financial performance=f( ROA, ROE, ROCE)…………………..…….………(iii)
Substituting equation (i) and equation (ii) into equation (iii) to derive capital structure models.
RER, ER, DER, LEV=f (ROA, ROE, ROCE, TX, FS)…………………….………(iii)
Equation (iii) is further decomposed into static panel regression model:
Model I
RERit= β+β1 ROAit+β2 ROEit+ β3 ROCEit+β4 TXit + β5 FSit+Ui+γt+πit………(iv)
Model II
ERit= β+ β6 ROAit+β7 ROEit+ β8 ROCEit+β9 TXit + β10 FSit+Ui+γt+πit………..(v)
Model III
DRit= β+ β11 ROAit+β12 ROEit+ β13 ROCEit+β14 TXit + β15 FSit+Ui+γt+πit..…..(vi)
Model IV
LRit= β+ β16 ROAit+β17 ROEit+ β18 ROCEit+β19 TXit + β20 FSit+Ui+γt+πit……(vii)
Where RER = Retained Earnings Ratio, ER = Equity Ratio, LEV = Leverage, ROCE = Return on Capital Employed, TX = Corporate Taxation, ROE = Return on Equity, DR = Debt Ratio, ROA = Return on Assets and FS = Firm size
DATA ANALYSES AND DISCUSSIONS
Table 2: Descriptive Statistics
| Variables | Observation | Mean | Std. Dev. | Minimum | Maximum |
| ROA | 190 | 0.8871005 | 2.112503 | -2.138884 | 16.22836 |
| ROE | 190 | 0.183044 | 0.2623187 | -0.1572657 | 1 |
| RER | 190 | 0.3185972 | 0.4351507 | -0.9453161 | 4.881331 |
| ROCE | 190 | 0.564646 | 1.448733 | -2.150579 | 13.06623 |
| LEV | 190 | 0.3258654 | 0.5472846 | -0.0346372 | 5.175387 |
| TA | 190 | 9.18e+07 | 1.14e+08 | 419230 | 6.39e+08 |
| TAX | 190 | -1363859 | 5393706 | -1.92e+07 | 2.54e+07 |
| ER | 190 | 0.4616144 | 0.3576019 | -0.7903593 | 3.221509 |
Source: Author’s Computation, 2022
The analysis indicated the characteristics and the distribution of the variables. According to the table the maximum ROA is 16.23 while the minimum ROA is -2.13 with the mean of 0.887 and standard deviation of 2.11. ROE minimum value of is 1 simultaneously maximum value of 1, however, the mean value for ROE is approximately 0.813 while the standard deviation is 0.262. The RER has a minimum of -0.945 and a maximum of 4.881 with a mean value of 0.319 and a standard deviation of 0.435. The minimum value of ROCE is -2.15 while the maximum is 13.066 with a mean value of 0.565 and standard deviation of 1.449. As for LEV the minimum value was -0.035, while its maximum value was 5.175. It has a mean value of 0.326 and a standard deviation of 0.547. TA had a minimum value of 419230, with a maximum value of 639918. The mean value for TA is 918008 and a standard deviation of 114008, the maximum value of TAX was 2.54e+07 while the minimum was -1.92e+07 with a mean of -1363859 and a standard deviation of 5393706. Finally, the minimum value of ER was -0.790 while the maximum value of 3.222 with a mean value of 0.462 and a standard deviation of 0.358.
Table 3: Correlation analysis and Multi-collinearity Test
| ROA | ROCE | ROE | RER | TA | TAX | DR | ER | |
| ROA | 1.000000 | |||||||
| ROCE | 0.153832 | 1.000000 | ||||||
| ROE | 0.791399 | 0.137750 | 1.000000 | |||||
| RER | 0.089345 | 0.066327 | -0.064671 | 1.000000 | ||||
| TA | 0.056217 | -0.168668 | 0.140209 | -0.195206 | 1.000000 | |||
| TAX | -0.444356 | -0.007623 | -0.370836 | 0.014919 | -0.119804 | 1.000000 | ||
| DR | -0.104409 | 0.363413 | 0.108404 | -0.115740 | 0.020089 | 0.228522 | 1.000000 | |
| ER | -0.136813 | 0.090864 | -0.182999 | 0.186576 | -0.040390 | 0.287319 | 0.318717 | 1.000000 |
Source: Author’s Computation, 2022
Multi-collinearity checked was conducted among the explanatory variables with the view of dropping variables that are highly correlated in other to ascertain variables significance. Gujarati and Porter (2009) asserted that the threshold for multi-collinearity decision should be 0.8 for the purpose of regression analysis and model reliability. Observation from table 4.3 shows that there were no strong correlations between the financial performance indicators, and this invariably suggest a weak positive association between the variables. Also, the two control variables (tax and firm size) showed weak positive correlation. Therefore, the result of correlation matrices supported evidence of no perfect correlations among the variables to be estimated.
Table 4: Testing for effect of Financial Performance on Retained Earnings Ratio
Dependent Variable: RER /ROA
| Pooled OLS | Fixed effect | Random effect | |
| VARIABLES | RER | RER | RER |
| ROA | 0.20 | 0.32 | 0.21** |
| (0.13) | (0.26) | (0.14) | |
| (0.13) | [0.23] | [0.04] | |
| TAX | 2.91 | 1.07 | 2.08 |
| (6.49) | (9.31) | (7.39) | |
| [0.65] | [0.25] | [0.78] | |
| Log (TA) | -0.07** | -0.12** | -0.07** |
| (0.02) | (0.04) | (0.02) | |
| [0.005) | [0.006] | [0.03] | |
| Constant | 1.45** | 2.46** | 1.46** |
| (0.41) | (0.80) | (0.52) | |
| [0.0005] | [0.002] | [0.005] | |
| Observations | 190 | 190 | 190 |
| R-squared | 0.05 | 0.22 | 0.15 |
| Adjusted R-squared | 0.04 | 0.07 | 0.05 |
| F-statistics | 3.47** | 1.47* | 1.45 |
| Prob(F-statistics) | 0.01 | 0.07 | 0.10 |
| Jarque-Bera stat | 22,792.09** | ||
| Hausman test | 5.91[0.12] |
Source: Author’s Computation, 2022
Result from table 4 indicated that the effect of return on assets (ROA) on the capital structure of the selected firms captured by retained earnings ratio is positive and significant, on average, if ROA increases by ₦1, the amount retaining earnings in terms of RER for the selected firms will increase by about 21 kobo holding all other factors that affect financial performance constant which implies that high level of return on assets tends to increase retain earnings ratio.
Total assets were found to have a negative and significant relationship with RER at a 5% level of significance, on average, if total assets increase by ₦1, level of capital structure captured by RER will decrease by about 7 kobo, holding all other factors that influence performance constantly. This implies that the total assets of the selected firms do not necessarily add value to their amount of retained earnings.
Table 5: Dependent Variable: RER / ROE
| Pooled OLS | Fixed effect | Random effect | |
| VARIABLES | RER | RER | RER |
| ROE | -0.01 | -0.03 | -0.01 |
| (0.02) | (0.02) | (0.16) | |
| [0.53] | [0.27] | [0.52] | |
| TAX | -2.86 | 6.54 | -2.42 |
| (6.27) | (9.08) | (6.38) | |
| [0.65] | [0.47] | [0.71] | |
| Log(TA) | -0.06** | -0.14** | -0.07** |
| (0.02) | (0.04) | (0.02) | |
| [0.007) | [0.002] | [0.006] | |
| Constant | 1.45** | 2.76** | 1.49** |
| (0.41) | (0.77) | (0.42) | |
| [0.0005] | [0.001] | [0.001] | |
| Observations | 190 | 190 | 190 |
| R-squared | 0.04 | 0.22 | 0.04 |
| Adjusted R-squared | 0.03 | 0.07 | 0.03 |
| F-statistics | 2.78** | 1.46* | 2.85 |
| Prob(F-statistics) | 0.04 | 0.07 | 0.04 |
| Jarque-Bera stat | 32,210.94** | ||
| Hausman test | 10.08**[0.02] |
Source: Author’s Computation, 2022
Table 6: Dependent Variable: RER / ROCE
| Pooled OLS | Fixed effect | Random effect | |
| VARIABLES | RER | RER | RER |
| ROCE | 0.01 | 0.03 | 0.007 |
| (0.02) | (0.03) | (0.02) | |
| [0.81] | [0.33] | [0.75] | |
| TAX | -1.4 | 7.71 | -1.16 |
| (5.87) | (9.01) | (6.02) | |
| [0.81] | [0.39] | [0.85] | |
| Log(TA) | -0.06** | -0.13** | -0.07** |
| (0.02) | (0.04) | (0.02) | |
| [0.008) | [0.003] | [0.01] | |
| Constant | 1.44** | 2.66** | 1.46** |
| (0.43) | (0.77) | (0.44) | |
| [0.001] | [0.001] | [0.001] | |
| Observations | 190 | 190 | 190 |
| R-squared | 0.04 | 0.21 | 0.04 |
| Adjusted R-squared | 0.03 | 0.07 | 0.02 |
| F-statistics | 2.67** | 1.45* | 2.61* |
| Prob(F-statistics) | 0.049 | 0.08 | 0.05 |
| Jarque-Bera stat | 32,210.94** | ||
| Hausman test | 8.39**[0.04] |
Source: Author’s Computation, 2022
Also, it can be observed from the random effect estimated model in table 5 and table 6 that ROE and ROCE were not significant to explain the effect of financial performance on Retained earning capital option. As both were not significant at all level of significant 10%, 5% and 1% respectively.
The model summary revealed that about 15% of the total variation in capital structure measured by Retained Earnings Ratio (RER) is being explained for by Return on Asset (ROA), corporate tax (TAX) and Total Assets (TA) included in the model. The F-stat also revealed that the overall random OLS regression model using Retained Earnings Ratio as a measure of retained earnings is statistically significant at 1% and normally distributed from the result of Jarque-Bera test.
Table 7: Testing for effect of Financial Performance on Equity Ratio (ER)
Dependent Variable: ER /ROA
| Pooled OLS | Fixed effect | Random effect | |
| VARIABLES | ER | ER | ER |
| ROA | -0.01 | 0.24** | 0.09** |
| (0.04) | (0.06) | (0.04) | |
| [0.88] | [0.00] | [0.02] | |
| TAX | 6.30** | 4.45** | 4.98** |
| (1.73) | (2.12) | (1.83) | |
| [0.00] | [0.04] | [0.01] | |
| Log (TA) | 0.00** | -0.01 | -0.02** |
| (0.00) | (0.01) | (0.01) | |
| [0.60) | [0.33] | [0.03] | |
| Constant | 0.05** | 0.24 | 0.50** |
| (0.11) | (0.18) | (0.13) | |
| [0.62] | [0.19] | [0.00] | |
| Observations | 190 | 190 | 190 |
| R-squared | 0.08 | 0.44 | 0.35 |
| Adjusted R-squared | 0.07 | 0.34 | 0.27 |
| F-statistics | 5.69** | 4.28* | 4.31 |
| Prob(F-statistics) | 0.00 | 0.00 | 0.00 |
| Jarque-Bera stat | 7,153.23** | ||
| Hausman test | 10.877213** [0.21] |
Source: Author’s Computation, 2022
The result from the random effect regression contained in table 7 showed that the effect of return on assets (ROA) on the capital structure of the selected firms captured by equity ratio is positive and significant, on average, if ROA increases by ₦1, the amount equity capital in terms of ER for the selected firms will increase by about 9 kobo holding all other factors that affect financial performance constant which implies that high level of return on assets tends to increase the choice of equity capital option positively.
However, the result revealed that there exists a positive and significant relationship between equity capital option and corporate tax (TX) of the selected firms such that if TX increases by ₦1, the amount of equity capital option ER for the selected firms will increase by about ₦4.98 holding all other factors that affect financial performance constant which implies that high level of corporate tax tends to affect equity capital option positively and it was statistically significant at 5%. Total assets were found to have a negative and significant relationship with ER at a 5% level of significance, on average, if total assets increase by ₦1, level of capital structure captured by ER will decrease by about 2 kobo, holding all other factors that influence performance constantly. This implies that the total assets of the selected firms do not necessarily add value to their amount of equity ratio.
Table 8: Dependent Variable: ER / ROE
| Pooled OLS | Fixed effect | Random effect | |
| VARIABLES | ER | ER | ER |
| ROE | -0.01 | 0.01 | -0.00 |
| (0.00) | (0.01) | (0.00) | |
| [0.22] | [0.31] | [0.29] | |
| TAX | 5.69** | 2.59 | 5.69** |
| (1.66) | (2.16) | (1.69) | |
| [0.00] | [0.23] | [0.00] | |
| Log(TA) | 0.00 | -0.02** | 0.01 ** |
| (0.01) | (0.01) | (0.01) | |
| [0.53) | [0.09] | [0.27] | |
| Constant | 0.04** | 0.41** | -0.01** |
| (0.11) | (0.18) | (0.11) | |
| [0.68] | [0.03] | [0.93] | |
| Observations | 190 | 190 | 190 |
| R-squared | 0.09 | 0.40 | 0.08 |
| Adjusted R-squared | 0.08 | 0.28 | 0.07 |
| F-statistics | 6.23** | 3.49* | 5.43 |
| Prob(F-statistics) | 0.00 | 0.00 | 0.00 |
| Jarque-Bera stat | 16,394.90** | ||
| Hausman test | 9.555**[0.22] |
Source: Author’s Computation, 2022
Table 9: Dependent Variable: ER / ROCE
| Pooled OLS | Fixed effect | Random effect | |
| VARIABLES | ER | ER | ER |
| ROCE | 0.01 | 0.00 | 0.01 |
| (0.01) | (0.01) | (0.01) | |
| [0.13] | [0.48] | [0.25] | |
| TAX | 6.53** | 2.29 | 5.56** |
| (1.55) | (2.14) | (1.67) | |
| [0.00] | [0.29] | [0.00] | |
| Log(TA) | 0.01 | -0.02* | 0.00 |
| (0.01) | (0.01) | (0.01) | |
| [0.38) | [0.09] | [0.74] | |
| Constant | 0.01 | 0.42** | 0.06 |
| (0.11) | (0.18) | (0.12) | |
| [0.95] | [0.03] | [0.61] | |
| Observations | 190 | 190 | 190 |
| R-squared | 0.09 | 0.40 | 0.06 |
| Adjusted R-squared | 0.08 | 0.28 | 0.05 |
| F-statistics | 6.51** | 3.47* | 4.10* |
| Prob(F-statistics) | 0.00 | 0.00 | 0.01 |
| Jarque-Bera stat | 12,937.81** | ||
| Hausman test | 9.56**[0.02] |
Source: Author’s Computation, 2022
Also, it can be observed from the random effect estimated model in table 8 and table 9 that ROE and ROCE were not significant to explain the effect of financial performance on equity capital option. As both were not significant at all level of significant 10%, 5% and 1% respectively.
The model summary revealed that about 35% of the total variation in capital structure measured by Equity Ratio (ER) is being explained for by Return on Asset (ROA), corporate tax (TAX) and Total Assets (TA) included in the model. The F-stat also revealed that the overall random OLS regression model using Equity Ratio as a measure of retained earnings is statistically significant at 5% and normally distributed from the result of Jarque-Bera test.
Table 10: Testing for effect of Financial Performance on debt capital (LEV)
Dependent Variable: LEV /ROA
| Pooled OLS | Fixed effect | Random effect | |
| VARIABLES | LEV | LEV | LEV |
| ROA | -0.01 | 0.34 | -0.01 |
| (0.17) | (0.33) | (0.17) | |
| [0.95] | [0.29] | [0.95] | |
| TAX | 2.43** | 1.19 | 2.43** |
| (8.14) | (1.16) | (8.14) | |
| [0.00] | [0.31] | [0.00] | |
| Log (TA) | 0.03 | 0.07 | 0.03** |
| (0.03) | (0.06) | (0.03) | |
| [0.28) | [0.20] | [0.03] | |
| Constant | -0.19 | -0.97 | -0.19 |
| (0.51) | (0.10) | (0.51) | |
| [0.70] | [0.33] | [0.70] | |
| Observations | 190 | 190 | 190 |
| R-squared | 0.06 | 0.23 | 0.06 |
| Adjusted R-squared | 0.04 | 0.08 | 0.04 |
| F-statistics | 3.83** | 1.56* | 3.83 |
| Prob(F-statistics) | 0.01 | 0.04 | 0.01 |
| Jarque-Bera stat | 16278.10** | ||
| Hausman test | 17.80 [0.3165] |
It can be observed from the random effect estimated model in table 10 shows that ROA was not significant to explain the effect of financial performance on debt capital option because it was not significant at all level of significant 10%, 5% and 1% respectively.
The model summary revealed that about 10 percent and 21 percent respectively of the total variation in capital structure measured by Debt capital (LEV) is being explained for by Return on Asset (ROA), Corporate Tax (TAX) and Total Assets (TA) included in the model. The F-stat also revealed that the overall random OLS regression model using leverage ratio (LEV) as a measure of debt capital option is statistically significant at 5% and normally distributed from the result of Jarque-Bera test.
Table 11: Dependent Variable: LEV / ROE
| Pooled OLS | Fixed effect | Random effect | |
| VARIABLES | LEV | LEV | LEV |
| ROE | 0.06** | 0.11** | 0.06** |
| (0.02) | (0.02) | (0.02) | |
| [0.00] | [0.00] | [0.00] | |
| Log(TAX) | 3.24** | 1.45 | 3.24** |
| (7.66) | (1.08) | (7.66) | |
| [0.00] | [0.18] | [0.00] | |
| Log(TA) | 0.02 | 0.70 | 0.02 |
| (0.03) | (0.05) | (0.03) | |
| [0.41) | [0.19] | [0.41] | |
| Constant | -0.10 | -0.97 | -0.10 |
| (0.50) | (0.92) | (0.50) | |
| [0.85] | [0.29] | [0.85] | |
| Observations | 190 | 190 | 190 |
| R-squared | 0.10 | 0.30 | 0.10 |
| Adjusted R-squared | 0.08 | 0.16 | 0.08 |
| F-statistics | 6.80** | 2.23* | 6.80 |
| Prob(F-statistics) | 0.00 | 0.00 | 0.00 |
| Jarque-Bera stat | 29.380** | ||
| Hausman test | 29.38**[0.31] |
Table 12: Dependent Variable: LEV / ROCE
| Pooled OLS | Fixed effect | Random effect | |
| VARIABLES | LEV | LEV | LEV |
| ROCE | 0.15** | 0.17** | 0.15** |
| (0.03) | (0.03) | (0.03) | |
| [0.00] | [0.00] | [0.00] | |
| TAX | 2.65** | 7.91 | 2.60** |
| (6.69) | (1.03) | (6.71) | |
| [0.00] | [0.44] | [0.00] | |
| Log (TA) | 0.07** | 0.07 | 0.07** |
| (0.03) | (0.05) | (0.03) | |
| [0.01) | [0.16] | [0.00] | |
| Constant | -1.00** | -1.01 | -1.09** |
| (0.49) | (0.88) | (0.49) | |
| [0.04] | [0.25] | [0.03] | |
| Observations | 190 | 190 | 190 |
| R-squared | 0.22 | 0.36 | 0.21 |
| Adjusted R-squared | 0.20 | 0.24 | 0.20 |
| F-statistics | 16.99** | 2.95* | 16.92* |
| Prob(F-statistics) | 0.00 | 0.00 | 0.00 |
| Jarque-Bera stat | 3,641.02** | ||
| Hausman test | 10.26**[0.22] |
Source: Author’s Computation, 2022
It is evidenced from the table above that there is significant and positive relationship between debt capital and financial performance. For instance, on average, if ROE increases by ₦1, the amount debt capital in terms of leverage for the selected firms will increase by about 6 kobo holding all other factors that affect financial performance constant which implies that high level of return on equity tends to increase firms leverage especially for bigger firms like consumer goods companies.
The effect of return on capital employed is similitude and it can be observed that there is positive and significant relationship debt capital and financial performance. For instance, on average, if ROCE increases by ₦1, the amount debt capital in terms of leverage for the selected firms will increase by about 15 kobo holding all other factors that affect financial performance constant which implies that high level of return on capital employed tends to increase leverage of firms positively.
However, the result from table 11 and 12 respectively suggest that there exists a positive and significant relationship between equity capital option and corporate tax (TX) of the selected firms such that if TX increases by 1 percent, the amount of debt capital option LEV for the selected firms will increase by about 34.2 percent and 26 percent respectively holding all other factors that affect financial performance constant which implies that high level of corporate tax tends to increase firms choice of debt capital financing and it was statistically significant at 5%.
Unlike the result in table 4.3, here table 4.11 total assets were found to positive and significant relationship with debt capital option (LEV) at a 5% level of significance, on average, if total assets increase by 1 percent, level of capital structure captured by LEV will improve by about 7 percent, holding all other factors that influence performance constantly. This implies that the total assets of the selected firms are significant enough to determine the choice of debt capital option by companies.
SUMMARY OF FINDINGS
- Finding showed that financial performance has significant positive effect on retaining earning financing, but the possibility of greater ploughed back profit is higher when company’s financial performance increases. This suggest that when the company returns increase, the incentive to plough back the returns would increase. The result was consistent with pecking order theory.
- Similarly, financial performance has both significant positive on equity finance decision of companies.
- It was discovered that increase in financial performance of companies may translate to increase debt finance options. The result may be due to tax benefit which would increase the incentive to choose higher external fund especially for bigger companies like consumer goods companies. However, this finding opposed Modigliani and Miller theory (1958) of capital structure because they fail to highlight the influence of cost of capital as a determinant of capital structure. Likewise, it negates the assertions that debt in a firm’s capital structure does not affect the firm performance. But the result affirmed trade off theory.
- Also, the finding suggested that company may leverage more if financial performance increase by greater magnitude and balancing the costs and benefits of borrowings. This finding agreed with trade off theory firm’s optimal capital structure which involves the trade-off between the tax advantage of debt and various leverage-related costs.
- Higher tax rate regime benefit would motivate the choice of debt financing as the study found a positive relationship between the former and the latter because of tax shield and tax cut companies would enjoy.
- Lastly, findings showed that firm size positively influence debt and equity finance option. The findings suggest that bigger company may prefer external capital structure than the smaller companies.
CONCLUSION
The study examined a reverse effect between financial performance and capital structure of selected listed companies in Nigeria. Findings showed a mixed effect of financial performance on choice of capital structure and that is, financial performance has positive and significant effect on retain earning, debt finance choice and equity financing decision. The results were also consistent with theories of capital structure (i.e., trade off theory and pecking order theory).
Therefore, based on the findings it was concluded that increase in financial performance may translate into higher debt financing decision due to tax benefit and tax shield, however, if a firm must use external funds, then preference is expected to be followed to a certain order of financing sources. Also, higher financial performance could mean more incentive to use retained earnings, because of internal funds is free from flotation costs and require less financial information disclosure that may lead to a possible loss of competitive advantage unlike equity choice of capital.
RECOMMENDATIONS
- Capital structure decision must be optimally taken after proper considerations of cost of all other capital structures available since financial performance has significant effect on all the capital structure.
- Companies should strive to increase their retained earnings capacity; for competitive advantage, companies must improve their financial performance as this could transform into share capital growth, improve market size, and improve retain earning capacity.
- For competitive advantage, companies are expected to strive hard to increase their retained earnings capacity because an improved their financial performance could not only retain earning capacity but simultaneously lead to share capital growth and improve market size.
REFERENCES
- Achichi, M. I. (2015). Effect of Capital Structure on Profitability of Food and Beverage Sectors in Sri Lanka. EPRA International Journal of Economic and Business Review, 3(11), 57-
- Akinyomi, O. J. (2013). Effect of Capital Structure on Firm Performance: Evidence from Nigerian Manufacturing Industry. International Journal of Innovative Research and Studies 2013, 469-480.
- Ajayi, L. and Obisesan, O. (2020). Impact of Capital Structure on Firm Performance in Nigeria. International Journal of Economics, Commerce and Management, 7(I3), 414-428.
- Alfred, D. D. (2007). Corporate Finance: Issues, Investigations, Innovations and Applications (2nd ed.). Lagos: High Rise Publication.
- Aliu, N.O. (2010). Effect of Capital Structure on the Performance of Quoted Manufacturing Firms in Nigeria. Unpublished M.sc Thesis, Ahmadu Bello University Zaria
- Ayad, S. S. and Mustafa, H. M. A. (2015). The Effect of Capital Structure on Profitability: An Empirical Analysis of Listed Firms in Iraq. European Journal of Accounting, Auditing and Finance Research, 3, (2), 61-78.
- Ayange, A., Emmanuel, C., Rosemary, H., Ndudi, U. and Samuel, U. (2021). Effect of Capital Structure on Firms Performance in Nigeria. Universal Journal of Accounting and Finance, 9(1)15-23.
- Babatunde, A. A. (2016). Empirical Evidence on Capital Structure Determinants in Nigeria Journal of Economics and International Finance, 8(6), 79-84.
- Baker H. and Powel G. (2005). Determinants of Corporate Dividend policy A Survey of NYSC Firms. Financial Practice and Education, 10, 29-40.
- Berger, A. N. and Bonaccorsi di Patti, E. (2006). Capital Structure and Firm Performance: A New Approach to Testing Agency Theory and an Application to the Banking Industry. Journal of Banking & Finance, 30(4), 1065-1102.
- Booth, L., Aivazian, V., Demirguc-Kunt, A. and Maksimovic, V. (2001). Capital Structures in Developing Countries. Journal of Finance, 56, 87-130.
- Chen, R. and Wong, K. A. (2004). The Determinants of Financial health of Asian Insurance Companies. The Journal of Risk and Insurance, 71(3), 469- 99.
- Deesomsak, R., Paudyal, K. and Pescetto, G. (2004). The Determinants of Capital Structure: Evidence from the Asia Pacific Region. Journal of Multinational Financial Management, 14, 387-405.
- Eniola, O. J. Adewunmi, A. A and Akinselure, O. P (2017) Impact of Capital Structure on Profitability of Selected Quoted Banks in Nigeria. International Journal of Economics, Commerce and Management, 1, 543-552.
- Fatoki, O. I. and Nasieku, T. (2017). The Influence of Market to Book Value of Equity on Capital Structure Choice in Nigeria. Scientific Research Journal (SCIRJ), 5(11), 18 – 23.
- Fatoki, O. I. (2018). Effect of Financial Performance on Capital Structure Choice of Listed Non- Financial Firms in Nigeria. Unpublished PhD Thesis, Jomo Kenyatta University of Agriculture and Technology. Department of Economics, Accounting and Finance.
- Fatoki, I., Wafula, F., and Waweru, G. (2021). Effect of Financial Performance on Capital Structure of Listed Manufacturing Companies in Kenya. International Journal of Research and Innovation in Social Science (IJRISS), 5(2) 354-360.
- Goyal, A. M. (2013). Impact of Capital Structure on Performance of Listed Public Sector Banks in India. International Journal of Business and Management Invention, 2(10), 35-41.
- Gujarati, D.N. and Porter, D.C. (2009). Basic Econometrics. 5th Edition, McGraw Hill Inc., New York.
- Huang, G. and Song, F. M. (2006). The Determinants of Capital structure: Evidence from China China Economic Review, 17 (1), 14-36.
- Igwe, M., Ogar, C. A. and Ogbuu, C. U. (2017). Capital Structure and the Profitability of Agro-Companies in Nigeria. Funai Journal of Accounting Business and Finance, 1(1), 174-180.
- Kajananthan, R. (2012). Effect of Corporate Governance on Capital Structure: Case of the Sri Lankan Listed Manufacturing Companies. Journal of Arts, Science & Commerce, 3 (4), 63-71.
- Mahfuzah, S. and Raj, Y. (2012). Capital Structure and Firm Performance: Evidence from Malaysian listed companies, International Congress on Interdisciplinary Business and Social Science: Procedia Social and Behavioral Sciences, 65, 156 – 166.
- Mahvish et.al. (2012). Determinants of Capital Structure: A Study of Oil and Gas Sector of Pakistan. Interdisciplinary Journal of Contemporary Research in Business, 3(10), 395- 400.
- Margaritis, D. and Psillaki, M. (2010). Capital Structure and Firm Efficiency. Journal of Business Finance and Accounting, 34(9-10), 1447-1469.
- Muhammad, A., Ahsan, A. and Kiran, S. (2017). The Impact of Capital Structure on Firm’s Profitability: A Case of Cement Industry of Pakistan. International Journal of Business and Social Science, 8(4), 140-147.
- Myers, S.C. (1984). The Capital Structure Puzzle”, Journal of Finance, 34, 575-592.
- Ogebe, O., Ogebe, J. and Alewi, K. (2013). The Impact of Capital Structure on Firm’s Performance In Nigeria. MPRA, 46173.
- Osuji, C. C. and Odita, A. (2012). Impact of Capital Structure on the Financial Performance of Nigerian Firms. Arabian Journal of Business and Management Review, (OMAN Chapter) 1(12), 43-61.
- Oztekin, O. and Flannery, M.J. (2012) Institutional Determinants of Capital Structure Adjustment Speeds. Journal of Financial Economics, 103, 88-112.
- Pandey, I. M. (1999). Financial Management (8th ed.). New Delhi: Vikas Publishing House PVT Ltd.
- Pandey, F. (2001). Financial Policy and Corporate Performance: An Empirical Analysis of Nigeria Listed Companies. Journal of Economics and Finance, 4(4), 175-181.
- Puwanenthiren, P. (2012). Capital Structure and Financial Performance: Evidence from Selected Business Companies in Colombo Stock Exchange Sri Lanka. Journal of Arts, Science & Commerce, 2(2), 171-183.
- Salawu, R. O. and Agboola, A. A. (2019). Determinants of Large Non-Financial Listed Firms in Nigeria. The International Journal of Business and Finance Research, 2(2),1-11.
- Soku, B. and Jong, C. R. (2003). Test of the Pecking Order Theory and Tradeoff Theory of Optimal Capital Structure. Proceedings of the Midwest Business Economics Association, pp.31-48
- Suleiman, A. (2013). Capital Structure Effect on Firms Performance: Evidence from Saudi Listed Companies.
- Suleiman, M. I. and Ahmad, H. (2016). The Impact of Capital Structure on Firm Performance in Nigeria: A Study of Nigerian Building Material Industry. Proceedings of, 2nd International Conference on Management, Economics and Social Sciences, 46-51.
- Terzungweand, N.and Abdulateef, Y. (2016). Capital Structure and Operating Performance of Listed Conglomerate Firms in Nigeria. International Journal of Finance and Accounting 5(2),126-133.
- Tharmila, K. and Arulvel, K. K. (2013). The impact of the capital structure and financial performance: A study of the listed companies traded in Colombo stock exchange. Merit Research Journal of Accounting, Auditing, Economics and Finance 1(5), 106-117.
- Van Horne, J. C. (2005). Fundamentals of Financial Management, 6th Edition Prentice hall International.
- Yinusa, O. O., Olorunfemi, Y. A. and Bamidele, M. I. (2016). Macroeconomic Determinants of Capital Structure of Firms: Evidence from Nigeria. Journal of Knowledge Globalization, 9(2), 1-21.
- Younus, S., Ishfaq, K., Usman, M. and Azeem, M. (2014). Capital Structure and Financial Performance: Evidence from Sugar Industry in Karachi Stock Exchange Pakistan. International Journal of Academic Research in Accounting, Finance and Management Sciences, 4(4), 272–279.