
The Relationship among Socioeconomic Factors in the Western Region and Eastern Region of Indonesia
- Muhammad Saleh Mire (Unmul)
- Muhammad Hasan (UNM Makassar)
- Emmilya Umma A. Gaffar (Unmul)
- 505-520
- Feb 24, 2024
- Education
The Relationship among Socioeconomic Factors in the Western Region and Eastern Region of Indonesia
Muhammad Saleh Mire (Unmul), Muhammad Hasan (UNM Makassar), Emmilya Umma A. Gaffar (Unmul)
Vocational Haigh School, Indonesia
DOI: https://doi.org/10.51244/IJRSI.2024.1101037
Received: 22 January 2024; Accepted: 27 January 2024; Published: 24 February 2024
ABSTRACT
The research aim was to study the influence of industrial development, wages, education, training institutions and MSMEs on unemployment in the western and Eastern regions of Indonesia. Indonesia is can be divided into two regions, western Indonesia and eastern Indonesia to make comparisons regarding economic growth and unemployment.
The results of the analysis show that the industrial developments have no influence on economic growth in either the western region or the eastern region. Industrial development has a significant positive influence on unemployment both in Western and Eastern Indonesia. Economic growth has a significant negative influence on unemployment both in Western Indonesia and Eastern Indonesia. Apart from that, wages have an insignificant positive influence on economic growth and unemployment in both Western and Eastern Indonesia.
The influence of education on economic growth is positive and significant in Western Indonesia but has no effect in Eastern Indonesia. Furthermore, the effect of education on unemployment is positive and very significant in both regions of Indonesia. On the other hand, training has no effect on economic growth and unemployment in the two regions of Indonesia. Lastly, Micro Small Medium Enterprises (MSMEs) had a positive effect on economic growth and unemployment in western Indonesia but had no influence in western Indonesia
Keywords: Industrial development, Unemployment, Economic Growth, Wages, Education, MSMEs and Regions
INTRODUCTION
Background
Competitive advantage is realized in various regions of Indonesia, especially in Eastern Region of Indonesia (ERI) and Western Region of Indonesia (WRI), Figure 1, which have relatively high gaps in both human and natural resources including physical and non-physical capital such as infrastructure and education. The regional development approach and strategy is the main thing considering that Indonesia consists of several islands separated by sea at various distances from each other. This approach can be carried out through two main strategies, namely a growth strategy and an equalization strategy as reflected in the island area-based growth corridor and equalization corridor approaches. A growth strategy is needed to develop islands and archipelagos by considering their potential. Meanwhile, the equalization strategy does not leave any community group behind, where areas near the center of growth can be given input to pursue growth in the nearest growth corridor [1]
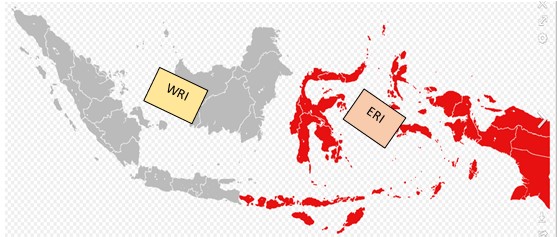
Figure 1. West Region and East Region of Indonesia
Source: Wikipedia [2].
Regional development is an integrated part of national development aimed at increasing the abilities and welfare of society evenly. Indonesia is an archipelagic country with an area of 1,904,569 km2 with a population of 278.8 million people in 2023, which can be divided into two regional development areas, namely the development of western Indonesia and eastern Indonesia. The Indonesian region, which consists of land and sea, islands and archipelagos, has development problems, especially the lack of equality and development results, resulting in a gap between the regions of Western Indonesia and Eastern Indonesia. Development is dominated by the provinces included in the WRI, namely all provinces on the islands of Java and Sumatra, making the ERI area relatively far behind both in terms of physical, social infrastructure, resources (capital and human), and institutions. The Central Statistics Agency, BPS, shows that the island of Java makes the largest contribution to Gross Domestic Product (GDP), namely 59.00 percent, followed by the island of Sumatra at 21.32 percent, and the island of Kalimantan 8.05 percent and for 30 years (1986-2019) the WI contribution of Gross Regional Domestic Product is very dominant and is never less than 80 percent of GDP[3]
The problem of unemployment is a classic problem that is always inherent and characterizes most countries, including Indonesia. Meanwhile[4] stated that the high economic growth and a sufficient percentage of IT mastery do not guarantee a decrease in most provinces’ unemployment rates in Indonesia. This study also concluded that the factor that could reduce the unemployment rate is the average school duration. [5], It is shown that the main reason for high unemployment in France is a slow down in the demand for labor due to high labor and energy costs in the early 1980s and to tight aggregate demand over the whole period. Changes in the labor supply have had an increasing impact in recent years.
Unemployment in Indonesia continues to experience developments which show a downward trend, although it is still not in line with expectations. In 2017, unemployment in Indonesia reached 5.5%, where the lowest was the province of Bali, 1.48 and the highest was West Java, 8.22%. This unemployment rate has increased so that in 2019 unemployment fell to 4.94%, but in 2020, when the Covid-19 pandemic started in Indonesia, unemployment rose beyond 2017 to above 7%, but in the following two years, unemployment gradually decrease, so that in 2022 open unemployment in Indonesia will be 5.83%, so it will still be high compared to 2017. Furthermore, the development of economic growth in unemployment in western and eastern Indonesia can be seen in Figure 2.
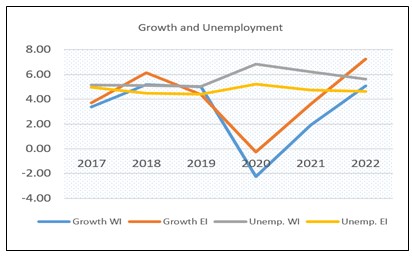
Figure 2. Development of the Average Unemployment Rate and Economic Growth Rate
Source: Data from BPS processed
Figure 1 shows the average economic growth of each of the 17 Western provinces and 17 Eastern provinces, from 2017 to 2022. From this figure it is known that the average economic growth in Western Indonesia is lower than in economic growth in the East. Meanwhile, unemployment occurs in reverse, namely that the average unemployment rate in western Indonesia is higher than in eastern Indonesia. Furthermore, in the same picture, it is known that the average economic growth of the two regions experienced negative figures in 2020. This fact cannot be separated from the influence of Covid-19 which hit Indonesia which started and was most severe in 2020. On the other hand, in the same year, developments unemployment has increased sharply.
The 2020-2024 National Medium-Term Development Plan with the main focus on developing human resources with quality growth (high employment) stated that in 2017 Indonesia was able to achieve economic growth of 3.79%, and in the following year it rose to 3.93%, and in 2019 it reached 4.27[6]. Meanwhile unemployment in Indonesia continues to experience a downward trend, although it is still not in line with expectations. In 2017, unemployment in Indonesia reached 5.5%, where the lowest was the province of Bali, 1.48 and the highest was West Java, 8.22%. This unemployment rate has increased so that in 2019 unemployment fell to 4.94%, but in 2020, when the Covid-19 pandemic started in Indonesia, unemployment rose beyond 2017 to above 7%, but in the following two years, unemployment gradually decrease, so that in 2022 unemployment in Indonesia will be 5.83%, so it will still be high compared to 2017. This unemployment covers all sectors, especially in the industrial sector due to layoffs.
Industrial sector plays a key role as a development engine because the industrial sector has several values of excellence compared to other sectors[7]. Furthermore, [8] stated that Industry is the primary measure of development and progress of countries, and industry is the mainstay of economic and social development. It also plays a distinct role in achieving economic, social and development goals. Referring to data from the Central Statistics Agency (BPS), the non-oil and gas processing industry is the sector that consistently provides the largest contribution to national GDP. In the third quarter of 2022, the contribution of the manufacturing sector reached 16.10 percent, an increase compared to the second quarter of 2022 at 16.01 percent. The manufacturing industry made the largest contribution to the increase in Indonesia’s economic growth, which reached 7.07% in the second quarter of 2021.
Education is a conscious and planned effort to create a learning atmosphere and learning process so that students actively develop their potential (Law Concerning the National Education System 2013 chapter 1 article 1: 1). The challenge facing many developing countries is to incorporate these aspects of sustainable development into the curriculum in an effective way, from primary to tertiary level. Furthermore[9] stated that the causes and consequences of unemployment in Pakistan can be found in the country’s educational system that provides less skills and technical exposure. Pakistan has less industrial growth among the developing countries because of the less collection of taxes, shortage of energy, trained labor and the policy gap by the government.
The level of education in Indonesia can be measured by years of schooling. According to Central Bureau of Statistics’ data, the average length of school for the Indonesian population in 2017 was 8.1 years and in 2020 it rose to 8.9 years and in 2022 it will reach more than 9 years or to be precise, 9.03 years. This fact shows that education as measured by years of schooling is not affected by the pandemic which started in 2020. This increase in education, which consistently increases every year, is expected to have an impact on reducing unemployment and encouraging economic growth, including the manufacturing industrial sector.
The wages received are only to fulfill daily life. The theory that explains this situation is called the iron wage theory. Furthermore, John Stuart Mill, as has been stated, states that the level of wages is determined by the availability of the amount of capital used in paying wages. The same thing also happens, if the company experiences a decrease in profits. This is explained by the wage fund theory. Apart from that, the ethical wage theory is also known, where the Utopians state that the wages received by workers must be able to bring workers to experience a decent life. The decrease in production targets resulted in a reduction in the required workforce. The decrease in the number of workers due to a decrease in the scale of production is called the scale effect. The decrease in the use of the amount of labor needed due to the replacement or addition of the use of machines is called the substitution effect (capital intensive). Wages are very important in a business, including MSMEs, because wage earners are one of the production factors in business development.
The role of Micro, Small and Medium Enterprises (MSMEs) from a world perspective, it is recognized that Micro, Small and Medium Enterprises (MSMEs) have a very vital role in economic development and growth, not only in Developing Countries (NSB) such as Indonesia, but also in Developed Countries (NM), Japan, the United States (US) and countries in Europe[10] MSMEs have a vital and strategic role, especially as a source of economic growth and employment opportunities, in line with government programs in efforts to eradicate poverty and reduction of unemployment.
According to Keynes, voluntary unemployment, 1). Intentional unemployment is unemployment that occurs because a job is offered but the unemployed person does not want to accept the job at the prevailing wage 2). Involuntary Unemployment, namely unemployment that occurs when someone is willing to accept work at the prevailing wages but the job is not available. According to [11] there are 8 paradoxes in the unemployment phenomenon in Indonesia. These eight paradoxes show the characteristics of unemployment in Indonesia: 1. Unemployment in urban areas is three times greater than unemployment in rural areas. The open unemployment rate in Jakarta is the largest in all of Indonesia. So why do people keep migrating to Jakarta? The logic used by job seekers should be that because there are more unemployed people in urban areas, there are fewer job opportunities in cities than in villages. This point is reinforced by research from[12] which suggests that in urban areas work is considered more meaningful than in rural areas. 2. Open unemployment among young people is greater than among adults, even though companies and government organizations always recruit new graduates rather than those over 30 years old, 3. Open unemployment among women is greater than men, even though companies and all sectors Modern industries including labor-intensive manufacturing, supermarkets, department stores, restaurants, banks and hotels recruit more female workers, 4. Open unemployment among educated workers is greater than uneducated workers. 5. At the high school graduate level, the open unemployment rate is higher than at junior high school. However, in employment there is no significant difference in wages between high school and middle school graduate workers, 6. Indonesia’s economic growth since the mid-1970s has reached 7-8 percent per year, however the open unemployment rate has always reached 2-6 percent per year, 7. The open unemployment rate is almost the same at all levels of income, job seekers from poor families cannot afford to be openly unemployed, meaning they have to work at any wage level and 8. The open unemployment rate in several provinces such as South Sumatra, Aceh, East Kalimantan, NTT, Maluku and Papua are three times larger than neighboring provinces such as Lampung, NTB and Central Kalimantan without any definite explanation. From the facts, Indonesia experiences disparities between regions both in economic and non-economic terms.
Research purposes
Based on the background and problems described previously, this research aims to study and find out
- The influence of industrial and MSMEs development on economic growth
- The influence of education and training and wages on economic growth
- The influence of industrial and MSMEs development on unemployment
- The influence of education and training and economic growth on unemployment
- The effect of economic growth on unemployment.
Framework of Thought
In the framework of thought below, a description of the line of thought that explains the influence of investment and inflation on unemployment is presented. Apart from that, several factors that determine the level of unemployment will be determined both empirically and theoretically.
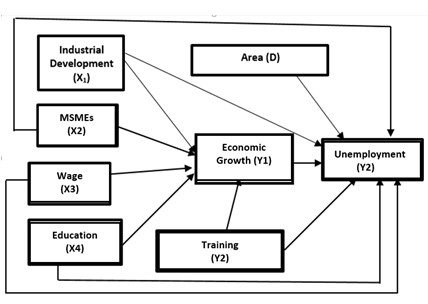
Figure 1. Framework
LITERATURE REVIEW
Unemployment
Okun’s Law[13], state that there is a close relationship between the unemployment rate and real GDP (Gross Domestic Product), where there is a negative relationship between the unemployment rate and real GDP. According to [14] increasing FDI will increase employment opportunities so that the unemployment rate will decrease and increase GDP. To determine the impact of direct investment on labor demand, the labor coefficient and output multiplier are used to determine the labor demand multiplier. A.W. Phillips managed to find a close relationship between the unemployment rate and the rate of change in nominal wages. This discovery was obtained from the results of processing empirical data on the British economy for the period 1861-1957. The curve that describes the relationship between the inflation rate and the unemployment rate is called the Phillips curve.
Wages and the unemployment rate have a positive relationship. The size of the wages offered will influence people’s interest and desire to enter the job market. If wages rise, then someone will tend to enter the job market[15]. The size of wages will affect the unemployment rate. Wage rigidity is one of the causes of unemployment. Wage rigidity is the failure of wages to adjust until the supply of labor equals [16]. Meanwhile, according to Okun’s Law, there is a close relationship between the unemployment rate and real GDP (Gross Domestic Product), where there is a negative relationship between the unemployment rate and real GDP. But long before that, A.W. Phillips managed to find a close relationship between the unemployment rate and the rate of change in nominal wages. This discovery was obtained from the results of processing empirical data on the British economy for the period 1861-1957. The curve that describes the relationship between the inflation rate and the unemployment rate is called the Phillips curve, which connects the percentage change in the nominal wage rate with the unemployment rate as described above, usually called the Phillips curve in its original form. Apart from that, there is also a new version of the Phillips curve, usually called the revised Phillips curve, which is used to measure the level of inflation. From the Phillips curve it can be concluded that the higher the unemployment rate, the faster the increase in wages and prices; and the higher inflation expectations, the faster wage levels will rise. So, in macroeconomic theory, there is a classic debate on the issue of inflation and unemployment which is widely known as the Phillips Curve (which has not actually been proven to be wrong or true in general in all economies/countries). The curve illustrates the negative relationship between the inflation rate and unemployment: High inflation rate, low unemployment (and high output). However, the opposite can also happen, namely an increase in prices in general, which, seen from the inflation rate, will reduce output (national production) and automatically increase unemployment.
Regional Disparity
Regional disparities describe differences in resources, of land, water, minerals, or other natural resources, distribution of income and the occurrence of inequalities in the level of development between regions. Development inequality basically focuses on differences in economic aspects and progress, especially in terms of the amount of investment and natural and human resources. Inequality in investment can make a significant contribution to economic inequality. Furthermore, inequality in natural resources will occur because their management attracts greater investment than other regions, both within a region and from outside. Meanwhile, human resource inequality is the existence of different investments in human resources due to facilities and infrastructure, including educational institutions, which are very different from one region to another. Investment causes income to increase, including per capita income. However, this does not mean that reducing inequality or convergence of regional per capita income simultaneously means that intra-regional income distribution tends towards equality for all regions [17].
The economic progress of a region shows the success of development, although it is not the only indicator of development success[18]. Myrdal (1957) explained the same thing, excessive differences in the level of economic progress between regions will cause detrimental influences (backwash effects) to dominate the beneficial influences (spread effects) on regional growth, in this case resulting in an imbalance process. Actors who have power in the market will normally tend to increase rather than decrease, so that they reach a peak, and then begin to decline as development continues. Furthermore, according to [19] there are several factors that play a role in creating economic inequality. They identify several factors that specifically contribute to inequality between developing and developed countries. The following are several factors explained by Adelman and Morris: first Natural resource inequality: Countries developing countries often face significant natural resource disparities. Furthermore, disparities that occur within a country can be minimized by considering the following factors: 1). Distance from the nearest economic center, 2). Existing level of infrastructure; 3). Development level according to social indicators; 4). Vulnerability to natural disasters including the impacts of climate change and 5). Own capacity to increase income [20].
Economic Growth Theory
Adam Smith explained that economic growth is a process of combining population growth with technological progress. In line with David Ricardo, he stated that economic growth is a process of attraction between two forces, namely “the law of diminishing returns” and technological progress. Apart from that, proponents of classical economic growth theory really prioritize liberal or laissez faire principles, where all economic activities are expected to be free without any government interference, in this case supporting economic openness, both trade openness and financial openness. The linear growth theory stages of growth theory developed by Rostow, also formulates development patterns through 5 stages including 1) Modern economic stage; 2) Take-off precondition stage; 3) Takeoff stage; 4) stage towards maturity and 5) stage towards high consumption. Furthermore, the economic growth theory according to Harrod – Domar also explains the same thing, to achieve a steady level of economic growth in a country’s economy lies in the active role of investment[21]. Harrod-Domar stated that the level of investment in a country can make a major contribution in encouraging economic growth, especially. On the basis that investment has two major objectives in the economy, namely as a source of income and capital to increase production capacity.
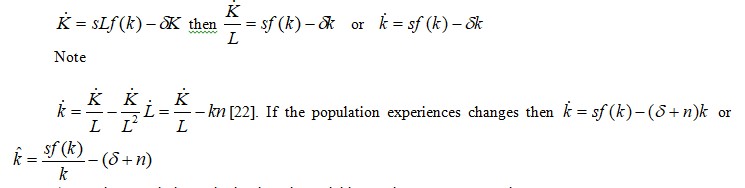
The mathematical model used by Solow is the Cobb-Douglas function with ![]()
Where: Y = Total production, A = Technology level, K = Capital or total capital stock and L = Number of workers. This equation can be linearized to obtain:
![]() . Next, by differentiating this equation regarding K and L, growth is obtained
. Next, by differentiating this equation regarding K and L, growth is obtained ![]() . So it can be seen that growth is the elasticity of capital times its growth plus the elasticity of labor plus the growth of labor. There is a level of economic growth that comes from 3 sources, namely capital accumulation, increasing the number of workers and improving technology.
. So it can be seen that growth is the elasticity of capital times its growth plus the elasticity of labor plus the growth of labor. There is a level of economic growth that comes from 3 sources, namely capital accumulation, increasing the number of workers and improving technology.
Next, by fulfilling the Inada Condition, so
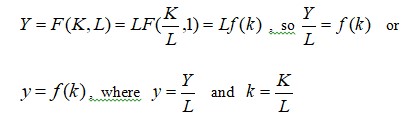
So the Cobb-Douglas function can be introduced as
![]() . These three equations indicate that the Slaw-Swam exogenous growth model which uses the Cobb-Douglas function applies to it the law of diminishing returns. Let the capital depreciation rate is δ:
. These three equations indicate that the Slaw-Swam exogenous growth model which uses the Cobb-Douglas function applies to it the law of diminishing returns. Let the capital depreciation rate is δ:
A steady growth is reached when the variables attain constant growth rate.
Neoclassical economic growth theory is known as the Solow growth model. This model was built to determine how the influence of capital stock growth, labor force growth, and technological progress interact in the economy, as well as how they affect the output of goods and services in a country as a whole [23]. According to Solow’s theory, there are several things that can be done to stimulate economic growth. Increasing the savings portion will increase capital accumulation and accelerate economic growth. Apart from that, increase appropriate investment in the economy, both in physical and non-physical forms. Encouraging technological progress can increase income per worker so that providing opportunities for innovation in the private sector will have a big influence on economic growth. Technological advances, many economists view this component as the most important. Technological progress in its simplest form, technological progress occurs due to improvements in old ways of completing work that was previously carried out traditionally. In the development process, economic growth, science and technological development have a broader role besides capital as recommended by endogenous growth theory (new growth theory). Science and technology can be the main input to encourage desired economic growth with the assumption that technology is not only exogenous but endogenous[24].
Mathematically, the simple endogenous economic growth model is expressed as
Y=AK, where Y= Output, A= Technology and K= Capital.
This equation show that the marginal product of capital is exactly constant, aggregate output Y is proportional to the aggregate stock of capital K. According this growth theory, an economy’s long-run growth rate depends on its saving rate. For example, if a fixed fraction s of output is saved and there is a fixed rate of depreciation d, the rate of aggregate net investment is:
![]() , s = saving rate and δ = depreciation
, s = saving rate and δ = depreciation
![]()
Hence an increase in the savings rate will lead to a permanently higher growth rate. This is because MPK is constant, which is one of the main differences with exogenous growth theory where MPK changes along with every change in capital or capital per worker.
Endogenous growth theory which attempts to explain that the sources of growth are increased capital accumulation in a broad sense. Capital in this case is not only physical but also non-physical in the form of science and technology. This technological development will develop innovation thereby increasing productivity and leading to increased economic growth. New discoveries originate from the learning by doing process, which can give rise to new discoveries that increase production efficiency. This efficiency can increase productivity. So in this case the quality of human resources is a factor that influences economic growth. The endogenous growth model emphasizes human capital and research and development (R&D) as the main drivers of economic growth. One of the empirical studies that supports the ability of the endogenous growth model to explain economic growth in developing countries is research conducted by [25].
THE METHOD
This type of the research is quantitative, take the type of study of comparative causality that processes numerical data that can be calculated using statistical formulas. The data analysis technique used in this study is path analysis which estimates of the direct and indirect influence of exogenous variables on endogenous variables. This study uses secondary data, namely data that is already available and collected by other parties and it was panel data. The data was taken from the Indonesia Central Statistics Agency (BPS Jakarta) which covers 34 provinces in Indonesia from 2017 to 2022 which is divided into two groups, one is Western Region of Indonesia and the other is Eastern Region of Indonesia. The statistical analysis technique used is path analysis and data processing using the Amos 18 statistical application program.
Based on the conceptual relationship in the framework of thinking, mathematically functional relationships can be written as
Y1 = f(X1,X2, X3, X4, X5)
Y2= f(X1,X2, X3, X4, X5, Y1, D, DX1, DX2, DX3, DX4, DX5)
Whereas:
X1 = Industrial development (added value of the manufacturing industry sector)
X2 = Medium Micro Small Enterprises (MMSEs), the quantity of the Enterprises
X3 = Wage (minimum wage of provinces)
X4 = Education (the average length of schooling of the population aged 15 years and over)
X5 = Training (number of training institutions, including the government and the private sector)
Y1 = Economic growth
Y2 = Unemployment (unemployment rate)
D = Dummy variable, D = 0 is western region of Indonesia, and D=1 Eastern region of Indonesia.
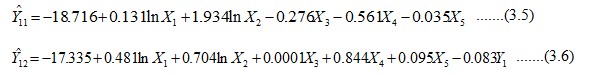
The structural equation can be rewritten:
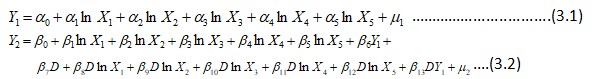
Substituting the value of dummy variable
D=0 in the equation (3.2), unemployment in the WRI
![]()
and D=1 in the same equation, the equation of unemployment in ERI
![]()
RESULTS AND DICUSSIONS
Research Finding
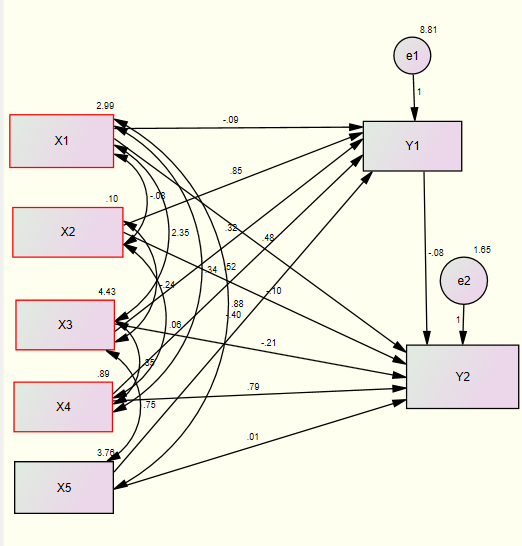
Western region of Indonesia: Group I
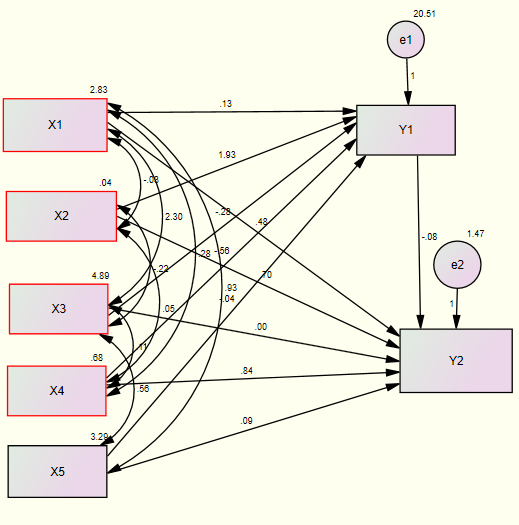
Eastern region of Indonesia, Group 2
Model fit test
Chi-square statistic, as stated earlier, is the most fundamental test to measure overall fit, it is very sensitive to the size of the sample used. The model is considered good if the Chi-square value is small. The smaller the value, the more feasible the research, meaning that the more it describes the match between the variance of the sample taken and the research population. The results of data processing that have been carried out using the AMOS 18 program are as shown in Table 1.
Tabel 1. Goodness of Fit Index
| No. | Goodness of fit Measure | Cut-off Criteria | Estimation
(cut off Value) |
Fit Situation |
| 1 | Chi-Square (χ2)
Significance Probability (p) |
smaller the better
≥ 0.05 |
7.828
0.166 |
Fit |
| 2 | RMSEA (the Root Mean Square Error of Approximation) | ≤ 0.05 | 0.053 | Marginal |
| 3 | NFI (Normed of Fit Index) | ≥ 0.95 | 0.983 | Fit |
| 4 | IFI (Incremental Fit Indices) | ≥ 0.95 | 0.994 | Fit |
| 5 | CMIN/DF (the minimum Sample Discrepancy Function) | ≤ 2.00 | 1.569 | Fit |
| 6 | TLI (Tuckler Lewis Index) | ≥ 0,95 | 0.956 | Fit |
| 7 | CFI (Comparative Fit Index) | ≥ 0,95 | 0.993 | Fit |
| 8 | Hoelter’s Index | ≥ 200 | 307 | Fit |
Sumber: [26]; [27] and Amos Result
Furthermore, the analysis results show:
Table 2. Regression Weights: (Group number 1 – Default model)
| Estimate | S.E. | C.R. | P | Label | |||
| Economic Growth | <— | Industrial Development | -.086 | .229 | -.374 | .708 | a5 |
| Economic Growth | <— | Wage | .851 | 1.056 | .805 | .421 | a10 |
| Economic Growth | <— | MSMEs | .324 | .199 | 1.626 | .104 | a6 |
| Economic Growth | <— | education | .525 | .337 | 1.558 | .119 | a7 |
| Economic Growth | <— | Training | -.401 | .159 | -2.528 | .011 | a8 |
| Unemployment | <— | Economic Growth | -.077 | .043 | -1.778 | .075 | a9 |
| Unemployment | <— | Industrial Development | .482 | .099 | 4.851 | *** | a1 |
| Unemployment | <— | Wage | -.102 | .459 | -.222 | .824 | a2 |
| Unemployment | <— | MSMEs | -.214 | .087 | -2.446 | .014 | a3 |
| Unemployment | <— | Education | .792 | .148 | 5.361 | *** | a4 |
| Unemployment | <— | Training | .009 | .071 | .121 | .903 | a11 |
Sources: Data Processing of AMOS
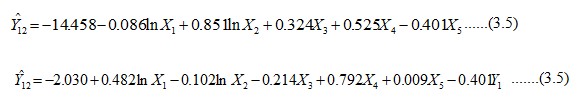
Table 3. Regression Weights: (Group number 2 – Default model)
| Estimate | S.E. | C.R. | P | Label | |||
| Economic Growth | <— | Industrial Development | .131 | .373 | .352 | .725 | b14 |
| Economic Growth | <— | Wage | 1.934 | 2.805 | .690 | .491 | b5 |
| Economic Growth | <— | MSMEs | -.276 | .311 | -.886 | .376 | b6 |
| Economic Growth | <— | Education | -.561 | .602 | -.932 | .351 | b7 |
| Economic Growth | <— | Training | -.035 | .266 | -.132 | .895 | b8 |
| Unemployment | <— | Economic Growth | -.083 | .027 | -3.114 | .002 | b9 |
| Unemployment | <— | Industrial Development | .481 | .100 | 4.825 | *** | b1 |
| Unemployment | <— | Wage | .704 | .751 | .937 | .349 | b2 |
| Unemployment | <— | MSMEs | .000 | .084 | -.004 | .997 | b3 |
| Unemployment | <— | Education | .844 | .161 | 5.228 | *** | b4 |
| Unemployment | <— | Training | .095 | .071 | 1.336 | .181 | b12 |
Sources: Data Processing of AMOS
Explanation
Industrial developments have no influence on economic growth in either the western or eastern regions. Furthermore, Industrial development has a significant positive influence on unemployment both in Western and Eastern Indonesia. A 1 percent increase in industrial development will cause a 0.48% increase in unemployment. This fact is related to the condition of Indonesian manufacturing which is capital intensive so that the workforce is not in line with development expectations and desires, as it is known that capital intensive industry is industry built with large capital which tends to emphasize the use of machines rather than human power, this is in accordance with research conducted[28] which states that automation has a significant positive relationship with unemployment rate.
Furthermore, economic growth has a significant negative influence on unemployment at a confidence level of α= 10% in Western Indonesia, while in Eastern Indonesia economic growth has an effect on unemployment at α= 5. This fact supports Okun’law’s employment opportunity theory which states that economic growth will result in an increase in employment opportunities or a decrease in unemployment. This fact is in accordance with the results of the study[29] stated that the effect of economic growth has a significant negative on unemployment in Indonesia. However, this is different from the research results from[30], which states that economic growth does not have a significant effect on open unemployment. Where if there is an increase in economic growth it is not certain that it will reduce the level of open unemployment in Indonesia
Education has a positive influence on economic growth but is not real at the confidence level α = 5% but has a significant real influence on unemployment in both Western and Eastern Indonesia. This fact states that the higher the level of education, the higher the unemployment rate. This fact is in accordance with research conducted by [31] which stated that there was a positive relationship among the education, female population, and urban population and unemployment in Jordan. This fact shows that many college graduates do not have the work skills needed to participate in the world of work. Apart from that, many jobs in Indonesia are still controlled by foreigners, which can also reduce or reduce the opportunities for highly educated Indonesians. Apart from layoffs, it cannot be ignored as one of the causes of unemployment in Indonesia, including highly educated employees.
The relationship between wages and economic growth is explained by [32] which states that wage levels influence economic growth. Meanwhile[33] states that wage levels have a significant effect on economic growth. Meanwhile, this research provides a more detailed explanation of the relationship between wages and economic growth. Wages have a positive influence on economic growth in Western Indonesia, but are not significant at the α= 5% confidence level as well as in Eastern Indonesia. Furthermore, the results of the analysis show that wages do not show an influence on unemployment in Western Indonesia, but in Eastern Indonesia, they have a positive influence but are not significant at the confidence level of α= 5%. This fact is in accordance with the results of research by [34] which states that wages also do not have a real influence on unemployment in Indonesia.
The results of the analysis show that MSMEs have a significant positive influence at the confidence level α = 10% on economic growth in western Indonesia. Every 1% increase in MSMEs will cause an increase in economic growth of 0.32%. Furthermore, in eastern Indonesia, MSMEs have a positive influence on economic growth which is not significant at the α= 5% confidence level. This contradicts[34] research which states that MSMEs have a negative effect on economic growth in Indonesia. MSMEs continue to grow in number and innovate, causing them to become large businesses so that they are no longer labor-intensive businesses so that they have less of an impact on unemployment.
Training is very important in efforts to improve workforce skills. The research results show that training has a significant negative influence on economic growth at the economic level α = 5% in western Indonesia. Meanwhile in eastern Indonesia it has no influence at all. The regression coefficient -0.401 shows that increasing training by 1% will reduce economic growth by 0.40%. As is known, training provides greater job opportunities for job seekers or employees, because it increases skills that can be used to get work opportunities and greater income after having higher skills. In this research, it was found that training had no influence at the confidence level α=0.05, in Western Indonesia. Meanwhile in Eastern Indonesia it has a positive influence, but it is not significant.
CONCLUSION AND RECOMMENDATION
Conclusion
Based on the analysis and the results of the previous discussion, the following conclusions are drawn:
- Industrial developments have no influence on economic growth in either the western or eastern regions.
- Industrial development has a significant positive influence on unemployment in both Western and Eastern Indonesia.
- Economic growth has a significant negative influence on unemployment both in Western Indonesia and Eastern Indonesia
- Wages have an insignificant positive influence on economic growth and unemployment in both Western and Eastern Indonesia.
- The influence of education on economic growth is positive and significant in Western Indonesia but has no effect in Eastern Indonesia
- The effect of education on unemployment is positive and very significant in both regions of Indonesia
- Training has no influence on economic growth and unemployment in the two regions of Indonesia
- MSMEs have a positive effect on economic growth and unemployment in western Indonesia but have no influence in western Indonesia
Recommendation
The suggestions to be put forward based on the discussion and conclusions that have been stated, among others:
- The inequality that occurs in Indonesia between the western and eastern regions should not be allowed to continue so that greater physical and non-physical investment is needed in the eastern part of Indonesia.
- Increasing economic growth should continue to be pursued by maximizing the potential of domestic and foreign investment because it turns out to have a negative influence on unemployment
- The unemployment rate in Indonesia varies, so it is hoped that all provinces, will pay more attention to unemployment by intensifying programs that are productive, not consumptive.
- Even though training does not show a significant impact on economic growth and unemployment, efforts to increase the quantity and quality of training need to continue to be made.
- MSMEs should continue to be fostered and developed by providing facilities and wider business or investment opportunities to increase efficiency and product quality.
REFERENCE
- Bappenas. 2019. Indonesia 2045: Sovereign, Progressive, Just and Prosperous. Ministry PPN/Bappenas, Jakarta.
- Wikipedia. 2024. A Free on Line Encyclopedia.
- BPS. 2020. Indonesian Economic Growth Quarter IV-2019. Official Statistics News No. 02/17/Th. XXIV, 5 February 2020, Jakarta
- Muin, M. Fathul. 2020. Analysis of Determinants of Unemployment Rate in Indonesia. Jurnal Perspektif Ekonomi Darussalam 6(2):145-162 DOI:10.24815/jped.v6i2.16804
- Gross, Dominique M. 2006. The causes of unemployment in France: a flow approach Applied Economics, Volume 25, 1993 – Issue 4. Article Published Online: 28 Jul 2006
- Bappenas, 2020. The National Medium Term Development Plan For 2020-2024. Jakarta.
- Pratomo, Ade Mulya and Setyadharma, Andryan. 2020. The Effect of Wages, Economic Growth, and Number of Industries on Unemployment. Conference Paper. KnE Sosial Science, Knowledge, ICE-BEES, International Conference on Economics, Business and Economic Education. DOI 10.18502/kss.v4i6.6677
- Trabulsi, Hussein, 2019. Industrial Development and Combating Unemployment in Arab counties. International Business Research; Vol. 12, No. 9; 2019 ISSN 1913-9004 E-ISSN 1913-9012 Published by Canadian Center of Science and Education
- Zaidi, 2021. Causes and Consequences of Unemployment in Pakistan. LinkedIn. https://www.linkedin.com/pulse/research-article-causes-consequences-unemployment-pakistan-zaidi
- Tambunan, Tulus T. 2017. Usaha Mikro Kecil Menengah. Ghalia Indonesia. Bogor.
- Dhanani, Shafiq, 2004. Unemployment and Underemployment in Indonesia, 1976-2000: Paradoxes and Issues, Research Paper, Geneva: International Labour Office.
- Byrne, David dan Eric Strobl, 2004. Defining Unemployment in Developing Countries: Evidence from Trinidad and Tobago, Journal of Development Economics Vol 73 pp 465–476
- Mankiw, N. G. 2003. Macroeconomics. Worth Publisher.
- Shaari at al, 2012. The Impact of Foreign Direct Investment on the Unemployment Rate and Economic Growth in Malaysia
- Branson, William H. 1992. Macroeconomics Theory and Policy. Hopper & Row Publishers, Singapore.
- Mankiw N. Gregory. 2020. Macroeconomics. Worth Publisher. A Macmillan Education Imprint, New York.
- Fisch, 1984. Regional income inequality and economic development: A comment, Elsevier. Regional Science and Urban Economics Volume 19, Issue 4, December 1989, Pages 637-644
- Todaro, Michael P. and Smith, Stephen C. 2014. Economic Development. Pearson.
- Adelman, I. and M. C. (1973). Economic growth and social equity in developing countries. Stanford University Press.
- Steytler, Nico. Equality and Advantage in Emerging Federations and the Dilemma of Non-Renewable Natural Resources. https://doi.org/10.1163/ 9789004394612_009, 197–223
- Jhingan, M. L. 1997. The Economics of Development and Planning. Vrinda Publications (P) Ltd. Delhi, India.
- Basu, Kaushik. 2000. Analytical Development Economics, The Less Development Economy Revisited. The MIT Press Cambridge, Massachusetts, London, England.
- Branson, William H. 1988. Macroeconomic Theory and Policy. Third Edition Reprint. Universal Book Stall. New Delhi.
- Eriksson, C. (1996). Economic Growth with Endogenous Labor Supply. European Journal of Political Economy, 12(3).
- Madsen at al. 2010. Four centuries of British economic growth: the roles of technology and population. Journal of Economic Growth. 15(4): 263-290.
- Malkanthie, Asoka. 2015. Structural Equation Modeling with AMOS Book. March 2015DOI: 10.13140/RG.2.1.1960.4647
- Wan, T. T. H. (2002). Evidence-based health care management: Multivariate modeling approaches (1st ed.). Norwell, MA: Kluwer Academic Publishers.
- Anakpo, Godfred and Kollamparambil, Umakrishnan 2021. Effect of Automation on Unemployment: The case of Southern Africa. Development Southern Africa, Volume 39, 2022 – Issue 4 Article | Published Online: 28 Oct 2021
- Sumarlina, at al. 2023. The Effects of Economic Growth and Investment and Inflation on Unemployment and Poverty in Indonesia. International Journal of Management Research and Economics. Vol. 1 No. 3 August 2023 e-ISSN: 2986-7398, p-ISSN: 2987-6311, DOI: https://doi.org/10.54066/ijmre-itb.v1i3.728
- Ardian, Rizki at al. 2022. Influence of Economic Growth on Open Unemployment in Indonesia. EBISMENVol.1, No.3 September 2022 e-ISSN: 2962-7621; p-ISSN: 2962-763X, 190-198
- Hjazeen, Hala Cs. 2021. The Nexus between the Economic Growth and Unemployment in Jordan Future Business Journal volume 7, Article number: 42 (2021), Published: 26 December 2021
- Crafts, Nicholas. 2022. Slow Real Wages Growth During The Industrial Revolution: Productivity Paradox or pro-rich Growth? Oxford Economic Papers. 74(1), 2022, 1-13
- Seneviratne, Prathi. 2020. Gender wage inequality during Sri Lanka’s post-reform growth: A distributional analysis. World Development, Volume 129, May 2020. Elsevier, Ltd.
- Leasiwal, Cs. 2022. Examining the effect Economic Growth on Unemployment in Indonesia. Jurnal of Sosial Science. Printed ISSN: 2720-9938.
- Sari, L.T Amanat and Fisabilillah, L.W. Perdini 2021. Influence of MSMEs Growth and Unemployment Economic Growth in Indonesia. Independent: Journal Of Economics Volume 1 No. 3. DOI: https://doi.org/10.26740/independent.v1i3.43584