Use of Routine Health Information among Health Management Teams in Makueni County, Kenya
Use of Routine Health Information among Health Management Teams in Makueni County, Kenya
Jeremiah Mwendwa Mumo (Bsc. HRIM)
Q141/CTY/PT/24227/2013
DOI: https://doi.org/10.51244/IJRSI.2023.10807
Received: 21 June 2023; Revised: 01 August 2023; Accepted: 04 July 2023; Published: 05 September 2023
ABSTRACT
Despite vast amounts of resources and time invested in the development and implementation of health information systems (HIS), health data is barely used by health workers effectively to inform policy and to programmatic decision making. The general objective of the study was to assess use routine Health Information among sub-county health management teams in Makueni County. The study used a cross-sectional study design employing mixed methods of data collection. Census approach was used to enlist all the 120 sub-county health management team members in Makueni sub-counties in the study while 20 key informants were selected using purposive sampling method. Descriptive and regression analysis were used to analyse quantitative data using SPSS version 20. Thematic analysis of qualitative data was undertaken to identify emerging themes using QSR/Nvivo version 10 and validate the study findings. Findings revealed that the level of data use was 67%. Regression analysis indicated that there was a statistically significant relationship between education (p=0.011), availability of reporting tools (p=0.049), staff trainings on data use (p=0.005), access to the internet (p=0.000) availability of computers (p=0.002), possession of data analysis skills (p=0.000), accuracy of data (p=0.001), completeness of data (p=0.014), performance of data duality audit (0.011), legibility and accuracy of records (0.006) and adherence to reporting timeliness (p=0.000), positive attitudes toward data (p=0.027), availability of data sharing mechanisms (p=0.001), provision of data feedback (p=0.000), access to data and information (p=0.033), empowerment of staff to make decisions (p=0.042), use of data to set and evaluate targets (p=0,037), ensuring staff accountability for performance (p=0.007) and data use for decision making. In conclusion, the established need for management to enhance technical competency of staff, enhance perceived quality of data, encourage positive attitude towards data and promote an organizational culture which motivates and encourages evidence-based decision-making at all levels of service delivery.
ABBREVIATIONS AND ACRONYMS
AHILA Association of Health Information Libraries in Africa
BMJ British Medical Journal
CHMT County Health Management Committee
DFID Department for International Development
DHMT District Health Management Team
DHIS District Health Information Software
HIFA Health Information For All
HINARI Health Inter Network Access to Research Initiative
HIS Health Information System
HMIS Health Management Information System
HRIO Health Records and Information Officer
ICT Information and Computer Technology
IT Information Technology
INASP International Network for the Availability of Scientific Publications
MEDLINE Medical Literature Analysis and Retrieval System Online
MOH Ministry of Health
SCHMT Sub County Health Management Team
WHO World Health Organization
KII Key Informant Interview
INTRODUCTION
Background
Health Information System (HIS) is a set of tools and procedures that a health programme uses to collect, process, transmit and use data for monitoring, evaluation and controlling health system (Wilson et al., 2001). The ultimate goal of a HIS is to produce relevant information that health system stakeholders can use for making transparent and evidence-based decisions for health system interventions based on good-quality data (Health Metrics Network, 2007). Efforts to improve monitoring and evaluation systems and other data sources have increased over the past few decades so as to improve tracking of Millennium Development Goals (MDGs) and respond to performance-based indicators in the health sector. In Kenya, the government and other stakeholders have embarked on initiatives to develop and improve a web based national health information system (DHIS2) that captures data from all health systems thus reducing the need for multiple parallel systems that are capturing data at community, district and national levels (Lafond & Field, 2003). This is primarily meant to assist health managers in making informed decisions and contributing to evidence-informed planning and management.
Therefore, assessment of HIS performance should be based on both qualities of data produced and on evidence of the continued use of data to improve health system performance, to respond to emergent threats, and to improve health (Health Metrics Network, 2007). The final outcome of the information circle is the use of the information. To plan for the real challenges in the health care sector, managers need good data that represents a true picture of the reality (Heywood & Rohde, 2001). However, there are data demand and use challenges facing the health system which include lack of capacity of managers to use data for decision making at the sub national level; lack of trained M&E personnel; lack of technical capacity and lack of accountability (MEASURE Evaluation, 2013). This study aims to inform interventions aimed at overcoming the highlighted challenges and provide a strong thrust for increasing data demand and use in health care delivery.
Problem statement
Despite of use of routine Health information to inform health programs and decisions being a key priority in the NHSSP (2005-2010) for assist health managers in making informed decisions and contributing to evidence-informed planning and management, data is often not used effectively to inform policy and to inform programmatic decision making (MOH, 2006). In Kenya, 43% of data producers lack data analysis and interpretation skills and 42% of health facility managers use data to influence budget preparation process and planning of clinical services (MEASURE Evaluation, 2008). There are limited efforts focused on frequent use of routine data in operational planning, plan implementation and decision-making at the country level (Galimoto, 2007). This has been linked to poor quality of available data, lack of technical capacity, lack of access, lack of managerial good will and other factors which affects use of data for decision-making. The study provided key information and insight on appropriate actions and strategies for improving use of routine data for evidence-based decision-making at all levels of health service delivery.
Justification
Makueni County will be selected purposively for the study. The rationale for this study is based on several existing conditions: First, decision-making in health service delivery was hampered by various problems which included inefficiencies, chaotic data collection processes and inadequate use of information in health facilities and at the sub-county levels, especially the routine service reporting component of the health information systems (Sauerborn & Lippeveld, 2000). Secondly, with the introduction of a decentralized system, there was significant change, emphasized by the MOH through the implementation of HMIS on use of information at points of collection (MOH, 2006). In addition, quality data and relevant information that health system stakeholders can use for making transparent and evidence-based decisions for health system interventions was strikingly lacking and less emphasized in health service delivery especially (Health Metrics Network, 2007).
Research Questions
- What is the extent of use of routine health information for decision-making among sub-county health management teams in Makueni County?
- What are the social demographic characteristics influencing use of routine health information among sub-county health management teams in Makueni County?
- What are the technical factors influencing use of routine health information among sub-county health management teams in Makueni County?
- What are the perceived data qualities factors influencing use of routine health information among sub-county health management teams in Makueni County?
- What are accesses factors influencing use of routine health information among sub-county health management teams in Makueni County?
Hypothesis
Social demographic characteristics, technical factors, perceived data quality factors and access factors are not associated with use of routine health information for decision-making.
Research Objectives
General objective
The main objective of the study was to assess use of routine health information among sub-county health management teams in Makueni County.
- Specific objectives:
The specific objectives of the study were:
- To determine the extent to which routine health information is used for decision-making among sub-county health management teams in Makueni County;
- To establish social demographic characteristics influencing use of routine health information among sub-county health management teams in Makueni County;
- To establish technical factors influencing use of routine health information among sub-county health management teams in Makueni County;
- To established perceived data quality factors influencing use of routine health information among sub-county health management teams in Makueni County;
- To establish access factors influencing use of routine health information among sub-county health management teams in Makueni County.
Significance and Anticipated Output
The findings of this study are useful to the Government of Makueni County, partners and other key stakeholders in the department of health services in informing policy and interventions aimed improving data use in routine reporting at different levels of service provision for evidence-based decision making. The study contributes to health services research for documentation, further research and reference.
Conceptual framework
The conceptual framework shows the relationship between the independent variables and dependent variable of the study. The independent variables were social demographic characteristics, technical factors, perceived data quality factors and access factors. The dependent variable was use of routine health information.
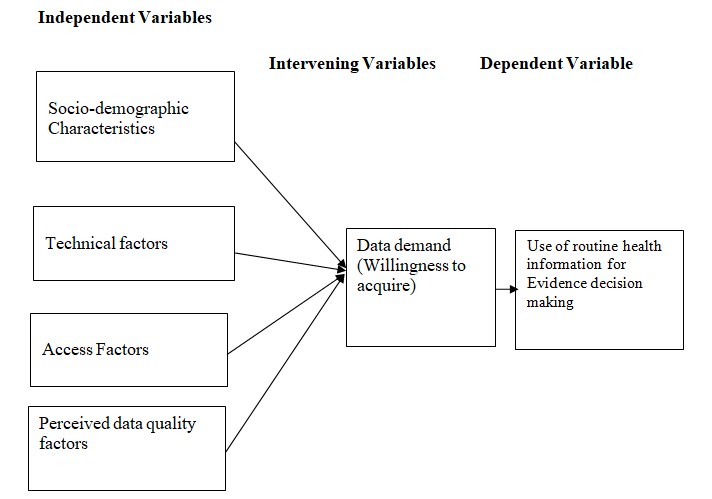
Source: Adapted from Measure, 2008
Figure 1.1 Conceptual Model
Scope of the study and delimitation.
The study covered use of routine health information among sub-county health management teams in Makueni County. The study findings and generalisation apply to sub-county health management teams in Makueni County.
LITERATURE REVIEW
Health Management Information System (HMIS)
In 1971, World Health Organization (WHO) published a public health paper with the following definition of a management information system: “A system designed to produce information to be presented to the management to assist in decision-making and to enable it to ascertain the progress made by the organization in the achievement of its major objectives” (Land & Kennedy, 2002). The traditional practice of collecting data and reporting it upward to management was still heavily ingrained in most health systems. Twenty years later, in 1992, an action-led information system was defined as one where only the data that are required for actionable management decisions are collected (Heeks et al,. 1999). Since 2003, Kenya has followed the global trend in strengthening its health information system. The HIS strategic plan (2009-2014) of Kenya emphasizes on health sector reforms and the restructuring of health information systems (MOH, 2010). Kenya began the process of strengthening the health management information system with an analysis of strengths and weaknesses of existing information systems (WHO, 2003). The analysis revealed among other things that the systems that were gathering data for management of health services were too many and uncoordinated. Most of them were not able to produce the information required for management decision-making. In addition data were of poor quality and rarely used in planning and management of health services. Based on the Health Policy Framework Paper (1994-2010), implementation plans (1996), HMIS Needs assessment report (2003) and the current National Health Sector Strategic Plan II (NHSSPII) 2005 – 2010 (Reversing the current trends) have also outlined those areas that require immediate attention i.e. provision of integrated data collection and reporting tools, improvement of data flow mechanisms, support districts in supportive supervision, provide clear policy guidelines on HIS and improve feedback mechanisms at all levels. According to Measure Evaluation 2008, investing in the development of effective health information systems would have multiple benefits and would enable decision- makers at all levels.
Technical factors
Health managers struggle with making sense of data (Measure Evaluation, 2003). The knowledge and skills required for data processing, analysis, interpretation and problem-solving are usually not given due attention, which affects the ability to use information (Campbell, 2003). Several factors affect the lack of data utilisation, including poor skills transfer within clinics due to high staff turnover, and poor communication of new knowledge within facilities; lack of understanding of indicators, lack of feedback to clinics; lack of access to the denominator data needed for calculating indicators; and poor numeracy skills among health care workers and managers (MOH, 2003).
Despite training on the HIS, health care workers and managers do not always put the data collected to best use (Heeks R.et.al, 1999). This has been described as a culture of reporting rather than a culture of using the information.
There is little tradition of information use for decision making at the facility level in most developing countries, even among health managers. Health care workers need to have sufficient knowledge and skills in order to have confidence to use information for decision-making.
Access Factors
Lack of full commitment by management at many levels has been a major obstacle to implementation of health information systems (Garrib et al, 2008). Feedback is one mechanism to promote and ensure that actions are taken based on the information and so provision of feedback is considered evidence of use of information (Campbell, 2003). This feedback can be in written form or even verbal during meetings or supervision.
Campbell explains that a “culture of information use” begins to evolve when the elements of an integrated HIS become normative practise, where the elements include data collection, self-assessment and peer review, HIS informed decision making, feedback and reporting (Campbell, 2003). The perceptions and attitudes of senior management towards HIS design and implementation will have a determining influence on the use of HIS. If senior managers fail to promote evidence-based decision-making and the use of information for transparency and accountability then a culture of information is unlikely to be fostered.
It is crucial to examine the perceptions, attitudes and values of senior managers and other organization members in relation to information-related functions (Heeks et al., 1999). In Ghana, Nepal and South Africa, it was reported that there are enormous differences in culture of data use between and within districts, suggesting different management styles within the same organizational culture (WHO, 2003).
There is a legitimizing kind of identity at play, where the formal structures of hierarchy favour a top down decision making, and bottom-up data flows. This structure helps to define the flows of health information and the related communication practices. The existing information culture thus represents a focus on data, where the formal reports hold little functional significance to the health staff with respect to their own work, other than the symbolic meaning of the reports being seen to be sent on time (Galimoto, 2007).
Feedback and attitude of supervisors plays a significant role in fostering a culture of data use in decision making among health workers. Negative attitudes among clinicians and health workers – such as “data collection is a useless activity or a waste of care-provider time” – are detrimental to data quality (Word Health Organization, 2008). The efficiency with which a job is carried out may depend in part upon the technical apparatus available to do the job, and the extent to which the job provides satisfaction (Rodrigues, 2000). Motivating data collectors remains a challenge despite training on data-collection registers and questionnaires (Campbell, 2003). Staff attitude towards health information management determines their use of the data for service delivery at the point of collection.
Perceived data quality factors
Evidence based decision making process requires that quality of data becomes a critical factor in the health delivery system (Loshin, 2011). However, one of the primary obstacles in the implementing quality health care delivery especially in developing countries is the lack of appropriate information for effective decision-making. Poor data quality on decision-making can have far reaching social and economic consequences. Poor data quality can impact on customer/user satisfaction, operational costs, effectiveness of decision-making and the ability to make and execute strategy (Redman, 2001,). Poor data quality can result in lowered morale and organizational mistrust.
It has been estimated that up to 5% of data found in organisations are of poor quality (Redman, 2001) and that the average perceived cost of poor data quality is as high as 10% of an organisation’s revenues (Malcom, 1998). In the healthcare sector, lack of data quality has far-reaching effects. Planning and delivery of services rely heavily on data from clinical, administrative and management sources. For example, evidence-based practice requires access to extensive research data, collated and presented in a way that a clinician can use at the time of diagnosis or in other decision-making situations (Strauss et al, 2005).
The higher the quality of the data, the better will be the patient outcomes. Similarly, quality data, particularly with regard to timeliness and accuracy, are needed for administrative purposes such as hospital bed-rostering and for planning services to ensure that they are cost-effective. These different but interlocking data requirements and decisions ensure that health care organisations and their relationships are inherently complex and demanding (Gendron & D’Onofrio, 2001) Data quality is therefore inextricably linked to the use of Information Systems and the health sector is increasingly an information-driven service.
Evidence-based Decision Making
Several models have been used to describe decision-making such as the knowledge-driven model of decision-making by Van Lohuizen and the classical model of decision-making by Lasswell which represents decision making as a process consisting of linear distinct steps. However, it has been argued that in the real world decisions are not made in a linear logical fashion but rather in an iterative way because the phases overlap. In addition, there are social and political dimensions that influence decision makers (Galimoto, 2007).
Where relevant and reliable information is available for decision-makers, it can influence decisions but this is not always the case in many public health institution (Campbell, 2003). A Health Information System (HIS) allows health managers and service providers to document, analyse, and use information to improve coverage, continuity, and quality of health care services at all levels by better planning, monitoring, and evaluation of health services. The ultimate success of HIS is measured by informed decisions that lead to action and positive change in the health system or health status, rather than by the quantity or quality of data produced. The most frequent problem that hinders use of information for decision making is the lack of feedback to local districts and health care workers (World Health Organization, 2008).
It is only when those providing the data begin to receive meaningful and useful feedback that they will begin to appreciate the value of data and will therefore take appropriate steps to improve the use of the data they provide (Gething et al, 2007). Studies done in Ghana, Nepal, and South Africa indicated that although most districts had reasonably accurate data and a good proportion are actively analyzing data and making routine reports for feedback to management and facilities, this was not yet achieving the culture of information use (Rodrigues, 2000).
At the level of individuals and communities, information is needed for effective clinical management and for assessing the extent to which services are meeting the needs and demands of communities. At the level of the district, health information enables health planners and managers to take decisions regarding the effective functioning of health facilities and of the health system as a whole. At higher levels, health information is needed for strategic policy-making and resource allocation (Odhiambo-Otieno, 2005). Perceived lack of use of information therefore is a cause of concern on quality of decisions; hence the importance of understanding factors that under-play the importance of information use.
Summary of Literature Review
The chapter has reviewed related literature on data use for decision-making. The review has been done based on the study objectives. The researcher observed that there are many studies done on data use for decision-making. However, there are limited studies and documentations on data use carried out in Kenya, especially under devolved health service delivery which has also decentralized the accountabilities and responsibilities related to decision-making on various aspects of health care provision. Most of the studies are out dated and done within contexts which are not similar to those within the context of this study. The existing literature has not conclusively established extent of data use and key factors influencing data use for decision-making.
MATERIALS AND METHODS
Study Design
A cross-sectional study design was used adopting mixed methods of data collection i.e. quantitative (structured questionnaires) and qualitative (KII) methods.
Study Variables
- Dependent Variable
The dependent variable of the study was use of routine health information for decision making among sub-county Health Management teams. Use of routine health information was measured using a data use composite index constructed from a set of eight (8) questions (appendix 4). The questions were measured using a likert scale of 1-5.
- Independent Variable
The independent variables of the study were socio-demographic characteristics, technical factors, perceived data quality factors and access factors.
Location of the study
The study was done in Makueni County (Appendix …. Makueni County is one of the 47 counties, located in the lower eastern part of the country between latitude 1°35′S and longitude 37°10′ and 38°30′E. Majority of the population (67 %) live in rural areas while the rest live in urban areas. Makueni County has a population growth rate of 2% and crude death rate of 13.9/1000. Table 3.1 presents key health indicators of Makueni County in comparison with those for Kenya.
Table 3.1: Key Health Indicators for Makueni County
| INDICATOR | Makueni County | National (Kenya) | |
| Crude birth rate | 44.7/1000 | 38.0/1000 | |
| Population growth rate | 2% | 1.74% | |
| Crude death rate | 13.9 /1000 | 11.3/1000 | |
| Infant mortality rate | 45/1000 | 52/1000 | |
| Neo-Natal Mortality Rate | 29/1000 | 24/1,000 | |
| Under Five Mortality Rate | 84/1000 | 77/1000 | |
| Expectation to life span | Males | 53.9 | 53.9 |
| Females | 60.4 | 60.4 | |
| Maternal Mortality Rate | 350/100,000 live births | 488/100,000 Live births | |
Source: District Statistics Office, District Development Plan (2008-2012)
Study Population
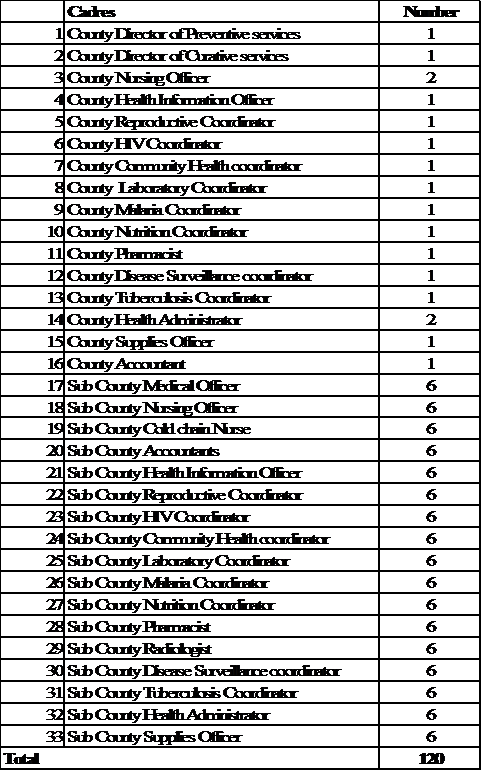
The study population comprised the 132 sub-county health management team members in all the six sub-counties of Makueni County.
- Inclusion Criteria
The study respondents comprised Sub-county management team members in all the six sub-counties of Makueni county who gave informed consent to participate in the study.
- Exclusion Criteria
The study excluded members of sub-county management teams who were sick at the time of data collection. Two (2) participants were excluded using this criterion.
Sampling design and sampling technique
Both census approach and purposive sampling were used to select study participants. Census approach was used to select respondents for administration of self-administered questionnaire because of few numbers of the study population. A list of all the sub-county management teams in Makueni County was obtained from Makueni County office headquarters; all the members in the list were enlisted in the study. Purposive sampling approach was used to select key informants who comprised county health managers/officers i.e. head of Health Records Department, Director of Health, Chief Health Officer and Minister of Health.
Sample Size Determination
A total of 132 sub-county management team members (Appendix 7) were enlisted in the study using a census approach. However, a total of 120 respondents participated in the study which represented a respond rate of 91%. A total of 20 key informants participated in the study.
Pre-testing of data collection tools
Pre-testing of the questionnaire was done in Kitui Central, a sub-county of Kitui County, which is a distant from the selected study area which had similar characteristics for the study context and respondents as that of the study area. The purpose of pre-testing will be to establish a common understanding of the tool by the research team and to determine the approximate time required to complete one questionnaire for purposes of ascertaining clarity and objectivity of questions. Following the pre-test, questions found to be unclear will be reframed.
- Validity
Validity refers to how accurately the data obtained in the study represents the variables of the study (Mugenda and Mugenda, 2003).
To ensure internal validity of tools, census approach was used to enhance representativeness of selected population due to their small numbers and comparison of results with studies done elsewhere was done to enhance external validity of the study. The study used other similar study questionnaires to inform and guide development of the study tools and measurement of items included in the tools as measure of enhancing validity of the tools. Expert opinion from the supervisors was also sought and their inputs taken into account in development of the study tools to enhance validity.
- Reliability
Reliability is a measure of the degree to which research instruments yields consistence results or data when used repeatedly in a manner that decreases random error (Mugenda and Mugenda, 2003).
To achieve reliability, Cronbach’s alpha was calculated using Using SPSS Version 20 to determine reliability of the instruments used in this study. Coefficients which are greater than 0.6 but less than 0.8 are considered good (Sekaran, 2002). The average Cronbach’s alpha reliability coefficient for the instrument was 0.781 which was within the acceptable reliability range hence reliable for measurement of CHWs’ retention.
Data Collection Tools
The study used self-administered questionnaire (appendix 4) and key informed guide (appendix 5) to collect data. The study tools comprised questions on socio-demographics characteristics, data use, technical factors, perceived quality factors and access factors. Questions on study tools were based on gaps and patterns identified in literature review.
Data Collection Procedures
During quantitative data collection, the lead researcher introduced himself and his research assistants to the respondent (s) who were selected to participate in the study. The consent form was read to each respondent after which the respondent accepted or declined to participate in the study. Any respondent did not consent to participate was thanked for his/her time. Participants were allowed time to fill the self-administered questionnaire after which the filled questionnaire was collected for data entry and cleaning.
Research assistants were recruited and trained to assist in carrying out data collection. A diploma in a health or health related discipline, prior experience and being residents of the study were key requirements for selection. Research assistants were trained on the study methods, ethical requirement and respondents handling techniques.
Key informants who gave informed consent to participate in the study were interviewed using a standardized key informant guide. The principal investigator conducted the study while the research assistants facilitated scheduling of interviews at convenient times and neutral venues for the participants. Consent for recording interviews were obtained prior to recording for the purposes of aiding compilation and analysis of emerging themes.
Data Analysis
Pre analysis was done to check for inconsistencies, incorrect and missing data. Quantitative data will be first compiled and coded into SPSS Version 20. Descriptive statistics comprising frequencies and percentages were used to describe variables used in the study. Regression analysis was used to establish the influence of the study variables on data use for decision-making. Statistical significance of the relationship between variables in the regression model was inferred at 5 percent. Thematic analysis using QSR/Nvivo was used to analyse qualitative data. Thematic analysis of qualitative data was undertaken to identify emerging themes, pattern within and between variables and triangulate the quantitative findings.
Ethical considerations
Proposal approval to conduct the study was granted by Kenyatta University Graduate School. Research authorization to conduct the study was obtained from Makueni County Government. Informed consent to participate in the study was sought from study respondents and confidentiality maintained throughout the study. Consent form (Appendix 3) was used to obtain informed consent as well as provide clarification to the respondents on any issues of concern that related to the study especially ethical concerns. The identities of the respondents involved in the study were duly protected by ensuring that the names of the participants were not indicated in the data collection tools. Data collected from the field was kept in a lockable box to ensure security and confidentially and only the principal researcher had access to the contents thereof.
RESULTS
Introduction
This chapter presents the findings of the study on assessment of Use of routine health information in Makueni County, Kenya. Detailed analysis of the data, interpretation and explanation of the results with regard to objectives and the research question are given. The findings are based on information from questionnaire survey from a representative sample of 120 county Health staff and consultative discussions using focus group discussions and key informant interviews. The chapter is organized as follows: Background Characteristics of respondents, routine data use, socio- demographic characteristics, technical factors, perceived data quality factors and access factors.
Background Characteristics of the Respondents
This presents information regarding background characteristics of the study respondents: age, gender, education, profession and experience in their profession. Table 4.1 summarizes the background characteristics of the study respondents.
Table 4.1: Background Characteristics of Study Participants
| Variable | f | % | |
| Age | 18-25 years | 27 | 22% |
| 26-35 years | 47 | 39% | |
| 36-45 years | 32 | 27% | |
| 45-55 years | 14 | 12% | |
| Gender | Male | 77 | 64% |
| Female | 43 | 36% | |
| Highest Education Level | Certificate | 9 | 8% |
| Diploma | 60 | 50% | |
| Higher Diploma | 22 | 18% | |
| Degree | 26 | 22% | |
| Masters | 3 | 2% | |
| Number of Years in Service | Less than 5 years | 30 | 25% |
| 5-10 years | 35 | 29% | |
| 11-15 years | 9 | 8% | |
| 16-20 years | 22 | 18% | |
| Over 20 years | 24 | 20% | |
In regard to age, 22% of the respondents were aged18-25 years and 39% were aged 26-35 years. Those who were aged 45-55 years were 12%. With regard to gender, 64% were males and 365 were females. In regards to highest education level, 8% were certificate holders, 50% were Diploma holders, 18% were higher diploma holders, 22% were had a degree and 2% had a master’s degree. In terms of number of years in the service, 25% had less than 5 years of work years, 29% of the respondents had 5-10 years of service and 20% had over 20 years in service
Use of routine data
Routine data use was assessed using a data use composite index. Data use index was constructed from a set of eight (8) questions which measured extent of data use on various aspects of decision making using a scale of 1 to 5 as shown in Table 4.2.
Table 4.2 Routine Data Use for Decision-Making
| Variable | Score |
| Day to day program management | 68% |
| Medical supply and drug management | 63 % |
| Formulating plans | 75% |
| Budget preparation | 67% |
| Budget allocation | 63% |
| Human resource management | 71% |
| Monitoring key objectives | 68% |
| Identification of emerging issues such as epidemics and outbreaks | 62% |
| Data Use Index (DUI) | 67% |
Results revealed that decision-making on budget allocation and medical supply/drug management had had the least data use score of 63% each. Formulation of plans for health service delivery had the highest data use score of 75% followed by human resource management (71%). Overall, data use index was 67%.
Socio-demographics Factors and their Influence on Routine Data Use
Table 4.3 presents results social demographic characteristics and their influence on data use in decision making. The socio-demographic characteristics studied included: age, gender, education, profession and years in service.
Table 4.3 Influence of Socio-demographic Characteristics on Routine Data Use
| Variable | f | % | Coefficients (B) | t | Sig. (p-value) | 95% CI for B | |
| Lower | Upper | ||||||
| Age | |||||||
| 18-25 years | 27 | 22% | 0.106 | 1.604 | 0.112 | 0.035 | 0.328 |
| 26-35 years | 47 | 39% | |||||
| 36-45 years | 32 | 27% | |||||
| 45-55 years | 14 | 12% | |||||
| Gender | |||||||
| Male | 77 | 64% | 0.126 | 2.229 | 0.128 | 0.033 | 0.562 |
| Female | 43 | 36% | |||||
| Highest level of education | |||||||
| Certificate | 9 | 8% | 0.137 | 2.598 | 0.011 | 0.039 | 0.291 |
| Diploma | 60 | 50% | |||||
| Higher Diploma | 22 | 18% | |||||
| Degree | 26 | 22% | |||||
| Masters | 3 | 2% | |||||
| Number of years in service | |||||||
| Less than 5 years | 30 | 25% | 0.039 | 0.707 | 0.481 | 0.006 | 0.176 |
| 5-10 years | 35 | 29% | |||||
| 11-15 years | 9 | 8% | |||||
| 16-20 years | 22 | 18% | |||||
| Over 20 years | 24 | 20% | |||||
In terms of age, 22% of the respondents were aged18-25 years and 39% were aged 26-35 years. Those who were aged 45-55 years were 12%. Age of respondents had no statistically significant relationship with data use in decision making (t=1.604, P=0.112) as emphasized in the following statement drawn from a key informant interview:
“…Age is not important in data use. We have staff who help us to interpret and summarize data for use…”
In terms of gender, 64% of the respondents were males while 36% were females. There was no statistically significant relationship between gender and data use in decision making. (t=2.229, P=0.128) as amplified in the following statement:
“…Gender doesn’t affect ability of an individual to use data for decision-making. However, you find that staff involved in areas requiring data frequently are mostly males but this doesn’t make them better when it comes to decision-making…”
In terms of number of years in the service, 25% had less than 5 years of work years, 29% of the respondents had 5-10 years of service and 20% had over 20 years in their profession. There was no statistically significant relationship between number of years in service and data use in decision making. (t= 0.707, P=0.481). Length of time spent in service was reported not to influence on data use in decision making; rather decision making is based on role played rather than experience as indicated in the following quote from a key informatics.:
“…Decision-making is mainly based on roles. Experience may have effect on data use but not to a very little extent because of the decisions are routine and can be learnt over time…”
Regarding the highest level of education attained, 50% were Diploma holders, 22% were had a degree and 2% had a master’s degree. There was a statistically significant relationship between level of education and data use in decision making (t=2.598, P=0.011).
Individuals with higher education attainment were able to make sense of complex data and use it for decision-making than those with lower education attainment as stated:
“…Some decisions are complex and require a lot of data and information to inform the decisions made. This requires the person making the decision to have advanced skills and ability to interpret the data and use it for decision- making which can be difficult for those with lower education attainment and experience in such issues…”
Technical Factors and their influence on decision-making
This section presents results on technical factors and their influence on data use. The technical factors presented include: availability of data collection tools, user skills and knowledge, information technology and complexity of data.
- Availability of data tools
Table 4.4 presents results on technical factors and their influence on data use for decision-making.
Table 4.4 Availability of data tools
| Variable | Yes | No | Coefficients (B) | t | Sig. (p-value) | 95.0% CI for B | |
| Lower | Upper | ||||||
| Adequacy of registers | |||||||
| Yes | 58 | 48% | 0.126 | 1.816 | 0.072 | 0.025 | 0.563 |
| No | 62 | 52% | |||||
| Adequacy of summary form for reporting | |||||||
| Yes | 77 | 64% | 0.138 | 1.991 | 0.049 | 0.021 | 0.643 |
| No | 42 | 35% | |||||
On adequacy of data registers, 48% of the respondents indicated that there were adequate registers in the health facilities. There was no statistically significant relationship between adequacy of data collection tools such as registers and data use for decision-making (t = 1.816, p=0.072). Data may be collected but it may not be used for decision-making as highlighted in the following quote from key informants’ interview:
“…In many instances, data is collected but the tools are not used to compile data into the systems and make it available for use by the staff. At times, the data is available but not used and in other cases, there are no adequate forms for data collection which makes the data to be lost from the system…”
On availability of summary forms, 64% of the respondents said they had adequate summary forms for reporting. There was a statistically significant relationship between adequacy of summary forms for reporting and data use for decision-making (t= 1.991, P=0.049). Reporting forms facilitate collection and compilation of data for easier management and use as put in the statement:
“…You know, the summary forms summarize data in a way that the data can be entered into the system. When data summary forms are unavailable, such data is not compiled and hence not put into the system for use. Where compilation is done, it is prone to errors and mistakes which makes it unreliable for use…”
- User Skills and Knowledge
The results on user skills and knowledge and their influence on data use are presented in table 4.5.
Table 4.5 User Skills and Knowledge on data management and Use
| Variable | Yes | No | Beta (B) | t | Sig. | 95.0% CI for B | |
| Lower | Upper | ||||||
| Training of staff on data use for decision-making | |||||||
| Yes | 63 | 53% | 0.163 | 2.848 | 0.005 | 0.108 | 0.601 |
| No | 57 | 48% | |||||
| Possession of data analysis skills | |||||||
| Yes | 61 | 51% | 0.140 | 1.364 | 0.000 | 0.101 | 1.120 |
| No | 59 | 49% | |||||
| Training of records staff on Computer skills | |||||||
| Yes | 63 | 53% | 0.139 | -0.431 | 0.667 | 0.097 | 1.090 |
| No | 57 | 48% | |||||
In regards to trainings on data use, 53% had attended refresher trainings on use of data to inform decision-making. Trainings on data use had a statistically significant relationship with data use for decision-making (t =2.848, P = 0.005). Staff training on evidence-based decision-making equips staff with important skills and knowledge on use of data to inform reliable decision-making. Trainings were effective in enabling staff to use data as illustrated in the following quote:
“…Some of the staff attended training on decision-making and management and it has helped us to use data for decision-making. Assessment of staff who attended such training has shown that they gained valuable skills for data management for use. We hope the government can support the remaining staff to attend such training….”
On data analysis skills, 51% of the respondents had been trained on data analysis skills. There was a statistically significant relationship between data management skills and data use for decision-making (t=1.364, P=0.000). Possession of data analysis had been useful in effective manipulation, interpretation and use of data for decision-making. A statement from one of the key informants interviewed expounds:
“…Data analysis skills are important for staffs who frequently use data for decision-making. With these skills, you can collect data from various sources, analyse it and use it for decision-making. Those who don’t have the skills rely on those who have the expertise which is not possible where decision is required within a short time….”
On computer skills, 53% of data management staff had been trained on use of computers. Training data management staff on computer use skills had no statistically significant relationship with data use (t=-0.431, P=0.667). Basic computer training doesn’t necessarily equip trainees with data management skills. Data management trainings are more preferred than basic computer literacy training as explained in the statement:
“…Most staff have basic computer skills required for operating a computer. The training gap is mainly on data management skills such as use of excel and data management software which are required for data manipulation…”
- Availability of Information Technology
Table 4.6 presents results on information technology and its influence on data use for decision-making.
Table 4.6 Influence of information technology on data use
| Variable | Yes | No | Beta (B) | t | Sig | 95.0% CI for B | |
| Lower | Upper | ||||||
| Availability of computers in HMIS office | |||||||
| Yes | 96 | 80% | 0.173 | 3.123 | 0.002 | 0.013 | 0.775 |
| No | 24 | 20% | |||||
| Access to the internet | |||||||
| Yes | 112 | 93% | 0.879 | 4.006 | 0.000 | 0.136 | 1.289 |
| No | 8 | 7% | |||||
In regard to availability of computers, 96% of the respondents indicated that their HMIS office had functional computers. Availability of computers has statistically significant relationship with data use for decision-making (t=3.123, P=0.002). Availability of functional computers facilitated efficient data management and sharing for decision-making as illustrated in the statement:
“…Computerization of the information management has made it easier to manage data and share with end-users for use. We have reduced workload and improved the efficiency of the department. However, some of the computers are dysfunctional and require proper maintenance…”
On access to internet, 93% of the respondents had access to internet. Access to the internet had a statistically significant relationship with data use (t=4.006, P=0.000). Internet connectivity was shown to help in accessing data from online data bases and sharing information among users as illustrated in the quote from key informants interview:
“…Internet has made it easier to retrieve data from different sources such as internet and other data bases. We use wifi, modem and personal phones to gain access to internet because we don’t have internet here. Those who don’t have internet find it difficult to access such data and share with colleagues. Internet is the simple solution to all our data challenges because it has a wide variety of materials for reference and research…”
Perceived Data Quality Factors
This section presents perceived data quality factors influencing data use for decision-making. The quality factors discussed are: data auditing, authorized access to information and timeliness in reporting.
- Perceived Data Quality
Results on perceived quality of data and their influence on data use are presents on Table 4.7.
Table 4.7: Perceived Data Quality
| Variable | Yes | No | Beta (B) | t | Sig. | 95% CI for B | |
| Lower | Upper | ||||||
| Availability of Data | |||||||
| Yes | 82.000 | 68% | 0.563 | 1.921 | 0.004 | 0.232 | 0.987 |
| No | 38.000 | 32% | |||||
| Completeness of Data | |||||||
| Yes | 50.000 | 42% | 0.611 | 2.621 | 0.014 | 0.232 | 0.987 |
| No | 70.000 | 58% | |||||
| Accuracy of data | |||||||
| Yes | 70.000 | 58% | 0.716 | 2.921 | 0.001 | 0.232 | 0.987 |
| No | 50.000 | 42% | |||||
| Adherence to reporting timelines | |||||||
| Yes | 118 | 98% | 0.490 | 7.771 | 0.00 | 0.95 | 2.303 |
| No | 2 | 2% | |||||
On availability of data, 84% of the respondents indicated that data was available for day to data management. There was a statistically significant relationship between availability of data for day to day management and data use for decision-making (t=1.921, p=0.004). Data is available for decision-making but it there are cases of incompleteness, inaccuracy and untimeliness which hinders effective decision-making as expounded by one of the statements drawn from key informants’ interview:
“…The problem with data we are given is quality. You can have the data you want but you have to deal with the obvious issues of incompleteness, untimeliness and even wrong data which is at times a difficult hurdle to overcome…”
On completeness of data, 42% of the respondents said that the data used for decision-making was complete. There was a statistically significant relationship between completeness of data and data use (t=2.621, p=0.014). Staff were compelled to use estimates and projections to take into account incompleteness of data as expounded in the following statement drawn from a key informants’ interview:
“…Personally, I use data but I find it a challenge to rely on available data because data on some key indicators is missing or unavailable which means the data set you need is not complete to create the true picture on the ground…”
On accuracy of data, 58% of the respondents said that the data used for decision-making was accurate. There was a statistically significant relationship between data accuracy and data use (t=2.921, p=0.001). Data available was shown to have inconsistences with the actual data collected. Accuracy remained a key challenge for data reported as indicated in the statement:
“…At times those who collect data make errors and mistakes caused by human errors and lack of sufficient competency which leads to inaccurate information in our system. Some indicators require skilled staff to collect the data to avoid reporting wrong information…”
In regards to timelines of data, 98% of the respondents said that there were reporting timelines. There was a statistically significant relationship between reporting timeliness and data use (t=3.771, P=.000).
Reporting timelines enhances availability of timely data for use. Reporting timelines are not maintained which leads to unavailability of data for decision-making.
“…Data is supposed to be submitted by 5th of every month. There are cases of late reporting which affects availability of data but it is not very common now these days…”
- Data Quality Audit
Results on data quality audit and their influence on data use are presented on Table 4.8.
Table 4.8 Data Quality Audit
| Variable | Yes | No | Beta (B) | t | Sig. | 95% CI for B | |
| Lower | Upper | ||||||
| Data auditing for quality and accuracy | |||||||
| Yes | 100 | 83% | 0.163 | 2.632 | 0.011 | 0.118 | 0.845 |
| No | 20 | 17% | |||||
| Availability of checklist to check data quality | |||||||
| Yes | 91 | 76% | 0.077 | 1.187 | 0.238 | 0.0136 | 0.541 |
| No | 29 | 24% | |||||
| Conducting supervisory visits targeting data quality | |||||||
| Yes | 101 | 84% | 0.192 | 0.998 | 0.321 | 0.1019 | 0.371 |
| No | 19 | 16% | |||||
| Clarity and legibility of records in a manner that identifies the author | |||||||
| Yes | 109 | 91% | 0.218 | 2.792 | 0.006 | 0.194 | 1.149 |
| No | 11 | 9% | |||||
On data auditing, 83% of respondents said that data quality auditing for quality and accuracy was done. Data quality auditing had a statistically significant relationship with data use for decision-making (t=2.632, P=0.011).
Quality checks are done for formality. There is no sufficient focus on improvement of quality of data as explained in the statement:
“…Oh! The checks are done but they are not frequent as required. They are not properly done in a manner that could help identify and correct quality problems; they are done as a formality…”
On use of a checklist, 76% of the respondents said that they used a checklist for checking data quality. The study findings revealed that there was no statistically significant relationship between availability of checklists for checking data quality and data use (t= 1.187, P=0.238). There are checklists for data audit but they are not used due lack of focused data quality audit as emphasized in the statement:
“…Yeah, checklists are available but they are not very useful due to lack of data auditing. When the auditing is done, it is done for formality…”
In regard to supervisory visits, 84% of the respondents had received supervisory visits aimed at checking data quality. There was no statistically significant relationship between supervisory visits and data use for decision-making (t= 0.998, P=0.321). Supervisory visits were done for formality; they lacked focus for data quality improvement as emphasized in the following quote drawn from a key informants’ interview:
“A Surprise supervisory visit in the name of data quality is something of the past. Most of us feel discouraged because there are actions emanating from the visits. It’s like waste of time due to lack of goodwill…”
In relation to clarity and legibility of records, 91% of the respondents agreed that records were clearly written and legibly in the manner that identifies the author. There was a statistically significant relationship between clear and legible writing of and data use for decision-making (t= 2.792, P= 0.006). Clear and legible records identifying author enables retrieval of data, data traceability and follow up with ease as indicated in the following statement from Key Informants Interview:
“…It is easy to use data when the records and documents are legible. At times, records are illegible which makes it difficult to use especially for people with eyesight problems…”
“…Data records are supposed to identify the author and source for credibility and follow up where necessary. This builds trust and helps users to seek clarifications and requests for further information where necessary…”
Access Factors
Table 4.6 presents access factors and their influence on data use for decision-making. Access factors discussed include attitude towards data and data use, data sharing, organizational culture and data storage.
- Attitude towards data and data use
Result on staff attitude towards data and influence of attitude on data use are presented in Table 4.9.
Table 4.9 Attitude towards Data and its Influence on Data Use
| Variable | Yes | No | Beta (B) | t | Sig. | 95% CI for B | |
| Lower | Upper | ||||||
| I feel bored because data is not used for decision-making | |||||||
| Yes | 102.000 | 85% | -0.258 | 3.807 | 0.004 | -0.579 | -0.145 |
| No | 18.000 | 15% | |||||
| Dealing with data is interesting to me | |||||||
| Yes | 24.000 | 20% | 0.140 | 1.447 | 0.027 | 0.0252 | 0.398 |
| No | 96.000 | 80% | |||||
| Data doesn’t make meaning to me | |||||||
| Yes | 101.000 | 84% | -0.137 | 2.504 | 0.013 | -0.514 | -0.030 |
| No | 19.000 | 16% | |||||
Results showed that 85% of the respondents felt that they collected information which was not used for decision making which discouraged them. There was a statistically significant relationship between the perception that data is not used for decision-making and data use (t=3.807, p=0.004). In relation to staff interest with data, 20% of the respondents felt it was fun when dealing with data while 80% didn’t find dealing with data to be fun. There was a statistically significant relationship between the perception that data is fun to deal with and data use (t=1.447, p=0.027.
On the value of data, 84% of respondents had the attitude that data doesn’t make meaning to them There was a statistically significant relationship between the perceived value of data and its use for decision-making (t=2.504, p= 0.013). Staff attitude affects their ability and motivation to seek data to inform decisions they make. Negative attitudes have negatively affected use of data to inform data as explained in the following statement:
“…Not everybody who enjoys looking for patterns and links within a data set. Negative perceptions towards quality of data affect their interest in using the data for making decisions….”
“…Some feel data collected for formality and not used for guiding decisions. This creates a culture which discourages others from taking data seriously…”
- Data Access and Sharing
Results on data sharing and its influence on data use are presented in Table 4.10.
Table 4.10 Data Access and sharing and its influence on data use
| Variable | Yes | No | Beta (B) | t | Sig. | 95% CI for B | |
| Lower | Upper | ||||||
| Access to data and information | |||||||
| Yes | 97 | 81% | 0.125 | 2.254 | 0.033 | 0.087 | 0.411 |
| No | 23 | 19% | |||||
| Availability of data sharing mechanisms | |||||||
| Yes | 105 | 88% | 0.425 | 1.544 | 0.001 | 0.127 | 0.814 |
| No | 15 | 13% | |||||
| Giving of feedback to the facilities on data issues | |||||||
| Yes | 113 | 94% | 1.004 | 3.942 | 0.000 | 1.672 | 5.083 |
| No | 7 | 6% | |||||
In regard to channels for sharing data, 88% of the respondents said that there were data sharing mechanism in the Sub-County. There was a statistically significant relationship between existence of data sharing mechanism and data use. (t=1.544, P=0.001) as explained in the following quote from key informants’ interview:
“…Data is shared though many channels such as emails, forms, reports and soft copies. Available mechanisms of sharing data are not adequately efficient; we hope we can have computerized systems to facilitate these things….the most important thing is whether the data is in a form that can be used and this depends on the end user…”
In regard to access to data, 81% of the respondents had access to data they required for decision-making. There was a statistically significant relationship between access to data and data use. (t=2.254, P=0.033). Staff were able to access data from the information systems in the facility. Data on some indicators of importance is not captured in the information system and hence easily accessible as explained in the following quote from key informants’ interview:
“…Although we can access the data bases around, the biggest problem comes when one wants data whose indicators aren’t available in the system and or are not reported yet they are to be take into account in the issue at hand…”
On giving of feedback, 94% of the respondents said that feedback is given to the facilities on data issues. Giving feedback had a statistically significant relationship with data use (t=3.942, p=0.000). Providing feedback facilitates staff to make corrections and improve on the issues of concern which improves quality of data although it is not frequently done to lower levels used as explained in the statement:
“…Right from the initial stage of data collection, entry, analysis and reporting is tedious. We therefor emphasize provision of feedback but this is not done consistently…”
- Organizational Culture
Results on organizational culture and its influence on data use are presented in Table 4.11
Table 4.11 Organizational Culture and its Influence on Data Use
| Variable | Yes | No | Beta (B) | t | Sig. | 95% CI for B | |
| Lower | Upper | ||||||
| Data is used for monitoring set targets | |||||||
| Yes | 103.000 | 86% | 0.193 | 1.063 | 0.291 | 0.028 | 0.236 |
| No | 17.000 | 14% | |||||
| Data is used for evaluating plans and targets | |||||||
| Yes | 114.000 | 95% | 0.236 | 1.933 | 0.037 | 0.144 | 0.321 |
| No | 6.000 | 5% | |||||
| Staff are empowered to make decisions | |||||||
| Yes | 108.000 | 90% | 0.377 | 1.976 | 0.042 | 0.229 | 0.408 |
| No | 12.000 | 10% | |||||
| Staff accountability for their performance | |||||||
| Yes | 105.000 | 88% | 0.888 | 2.791 | 0.007 | 0.844 | 5.046 |
| No | 15.000 | 12% | |||||
On collecting and use of data for monitoring, 86% of the respondents said that the Sub-County displays data for monitoring their set targets. There was no statistically significant relationship between display of data for monitoring set targets and data use for decision-making (t=-1.063, p=0.291) as indicated by the statement:
“…This performance charts all over in the boardroom don’t really affect us in any way because they just display this to comply with the requirements by government but not to show whether it is used or not… ”
On evaluation of targets, 95% of the respondents said that data is used to evaluate whether the targets or outcomes have been achieved. There was a statistically significant relationship between evaluation of targets and data use (t=-1.933, P=0.037). Monitoring and evaluating targets was shown to encourage collection of data and its use for decision-making as emphasized in the statement:
“…We use data to monitor and evaluate set targets for performance. This requires use of data which must be collected…”
“…Evaluation forms collected from the facility are crucial in determining whether individual and departmental targets have been met. It is through these procedures that management gets a clear image of what is happening on the ground that communicates a lot in terms of employee commitment and focus hence basing their actions on the findings…”
In regards to staff empowerment to make decisions, 90% of respondents agreed said that they were empowered to make decisions. There was a statistically significant relationship between staff empowerment for making decisions and data use (t=1.976, p=0.042). Empowerment of staff to make decisions motivates them to use data for correct decision-making as emphasized in the quote:
“ … Last year the management gave junior management staff authority to make departmental decisions on our own based on some guidelines therefore we don’t have to rely on management all the time. They are required to use accurate date to make correct decisions…”
On accountability, 89% of the respondents felt accountable for their performance results. There was a statistically significant relationship between accountability for performance results and data use for decision-making (t=2.791, p=0.007). Providing accountability for performance encourages staff to make decisions which are correct and accurate which makes them seek data for guiding their decisions as explained in the statement:
“There is no blame game when it comes to performance. Each staff members know their duties and they are expected to deliver better services to clients and therefore any drawbacks will be accounted on the individual responsible. This makes them look for correct data for use even if it means paying the costs individually…”
Chapter Summary
The study indicated that data use was 67%. In regard to socio-economic factors, level of education and profession influenced data use (p<0.05). Age, gender and years in services had no statically significant relationship with data use (p>0.05). In regards to technical factors, adequacy of summary reporting forms, training on use of data for decision-making, training on data analysis, adequacy of computers and access to internet influenced data use (p<0.05). Adequacy of data collection tools and training on computer skills had no statistically significant relationship with data use (p>0.05).
In relation to data quality factors, availability, accuracy, completeness, timeliness, completeness, data auditing and clarity and legibility of records had a statistically significant relationship with data use.
In regards to access factors, staff attitude, access to data, data sharing, giving of feedback, use of data for evaluating targets, empowering staff to make decisions and making staff accountable for performance had a statistically significant relationship with data use (p<0.05). Monitoring of targets using data had no statistically significant relationship with data use (p>0.05).
DISCUSSION, CONCLUSIONS AND RECOMMENDATIONS
Introduction
This chapter presents the discussion, conclusions and recommendations of the study based on the study objectives and findings. The chapter relates the qualitative and quantitative findings of a study and interprets them according to the literature reviewed and according to the researcher’s observations. The findings are analysed according to the research questions and objectives. The outcomes are further compared with other similar studies to help highlights similarities and differences in findings. The chapter is organized as follows: background characteristics, socio-demographic characteristics, technical factors, perceived data quality factors and access factors.
Discussion
- Data Use
Data is needed for effective decision-making such as clinical management, budget management and assessment of the extent to which services are meeting the needs and demands of communities. This enables planners and managers to take tactical and strategic decisions regarding the effective functioning of health facilities and of the health system as a whole. The study established data use index for decision-making was 67%. Decision-making on budget allocation and medical supply/drug management were not adequately informed by data.
Estimates and projections from previous record have been used to inform decisions which is prone to errors and discrepancies and doesn’t account for changes experienced overtime. This affects the effectives and health outcomes. A study by Rodrigues (2000) found that most health systems have reasonably accurate data, proper analyses of data but its use for decision-making is not witnessed. This is mainly due to lack of good will from management and lack of necessary data skills.
Socio-Demographic Characteristics
The study revealed that level of education influenced data use for decision-making. Individuals who had higher education attainment such as those holding degree and above were reported to possess advanced skills for making sense of complex data and use it for decision-making than those with lower education attainment. Even et al. (2006) found education to empower staff to solve complex problems using data better than those who were not educated.
The study observed that age and gender do not affect an individual ability to use data for decision making. Age and gender doesn’t predict ability of a staff to make sense of data. Individual skills play a key role in data use rather than their age and gender. Strauss et al. (2005) found that irrespective of gender and age, staffs in managerial positions were required to use data more than those in junior and service delivery roles for the purposes of informing decisions which influence resource allocation and other interventions which requires to be backed up with accurate data.
Technical factors
The study established that technical factors play an important role in utilization of data for decision-making. Skills and knowledge of staff helps staff to use complex data for decision-making. One of the main factors influencing data demand and use is level of skills and knowledge of the user (MOH, 2003). Lack of sufficient skills in data use for decision-making has been caused by lack of sufficient trained staff within the facilities due to due to high staff turnover, poor staff and capacity development programs among health care staff and managers (Health Metrics Network, 2007). Many facilities used manual methods of data collection, storage and management due to shortage of skills and knowledge which limited development of competence and skills for using digital platforms for data use among the staff.
Continuous staff development through trainings such as refresher training on data use for decision-making impacts on the ability of individual staff to use data for decision-making. A study by Nutley (2012) found training of health care workers and managers to improve data use. Improved data use require development and promotion of a culture that values and supports data use to inform decisions. Public health facilities have a culture of data reporting as opposed to use of the available information for decision-making. The stuy established an improvement in the culture of data use for decision-making at the facility especially among health managers. Sustaining this culture requires equipping of staff with the right competence in order to have confidence and develop motivation to sustain their interest in evidence-based decision-making processes.
Negative staff attitude remains a challenge for improvement in data use. Staff revealed negative perceptions towards data which affects their ability to seek and use data for their use (MEASURE Evaluation Report, 2013). There is need for proper training of staff and supportive work environment to enables staff develop appropriate attitude and perceptions towards data and data use.
Possession of data analysis skills by the staff handling data was found to be significantly related to data use in decision making. Equipping of staff with appropriate data analysis skills facilitates them to source for data from various sources and effectively use the information generated to inform their decisions. Health managers struggled to make sense of data which impeded their ability to use the data in executing their duties and responsibilities (MEASURE, 2008). Lack of data management skills affects data demand within facilities. Further, availability of Computers and computer skills influence data use for decision making. Computer skills help staff to use computers to manipulate, interpret, share and apply the information obtained in their day to day activities (Health Metrics Network, 2007).
Perceived data quality factors related to data use
Data quality perceptions are key in formation of perceptions and attitude which influence individual decisions on use of available data to inform their decisions. Available data suffers from quality problems which reduces its reliability for key decision-making Loshin, 2001). Performance of regular data quality audit has been found to helps eliminate of errors and mistakes which can result in poor decision and intervention outcomes (Strauss et al., 2005).
Periodic auditing of data ensures that the information generated from the data reflects realities for which decisions are made such as budget allocations for departments, stocks required and cadre required (Tayi and Ballou, 1998). There is poor implementation of guidelines for performance of data audit. Most audits are done for formality purposes. There is little or no follow up for recommendations i.e. feedback is not regularly given and supervisory visits are not consistent. This has led to de-motivation of staff in regard to upholding a culture of maintaining data quality (Odhiambo-Otieno, 2005). A study by Loshin (2011) found that evidence based decision making process requires that quality of data becomes a critical factor in the health delivery system.
A study by Redman (2001) found that poor data quality on decision-making can have far reaching social and economic consequences. Poor data quality can negatively impact on customer/user satisfaction, operational costs, effectiveness of decisions and the ability to make and execute productive strategies. This has an overall effect of demotivating staff and resulting in negative health outcomes. One aspect of quality which influences data use is use of accurate and legible patient’s records and information identifies the author for purposes of auditing and tracing.
Use of high quality data such as its completeness, reliability and its timeliness is essential for service delivery roles such as management planning and delivery of services (Saba and McCormick, 2001) which rely on various types of data which include clinical, administrative and management data.
This requires staff to conduct extensive research and review of data sources, collated and presented the data/information in a manner that a non-statistician such as a doctor can comfortably understand and use for the various decision-making situations.
Observing reporting timelines and completeness of data ensure that the services are responsive and reliable at all times. It ensures efficiency and effectiveness of the service delivery through proper planning and timely allocation of resource to solve identified problems or gaps (Gendron and D’Onofrio, 2001). Late reporting has been linked to poor decisions which were not based on data and use of forecasted data which may not accurately reflect the changes and dynamics on the ground. This affects decision outcomes (Nutley, 2012). The different but interlocking data quality requirements ensure that informed decision-making is based on practical information gathered. Perceived data quality has been associated with choice of the data sources used for decision-making.
Access factors associated with data use
Access to required data is a proximate factor which influence date use for decision-making. Accessibility to data requires that data is readily retrievable and available for use by the end-users (Fisher et al., 2003). Data was found to be available for use by staff from the many sources including the digital platforms especially where computerization of information has been attained. Authorization to access the information has been important for staff to make use of the data.
Confidentiality issues can poise challenges to access of data especially the health service statistics especially for junior staff. Giving feedback on data collection, analysis and reports has also been shown to encourage and motivate staff to use data for decision-making. Providing feedback is one mechanism to promote and ensure that actions are taken based on the information and so provision of feedback is considered evidence of use of information (Land and Kennedy-McGregor, 2002). The study established that feedback was given in many forms such as written form as in emails, reports, bulletins or even verbal during meetings or supervision. Feedback helps point to gaps and areas requiring actions which facilitate monitoring of performance and tracking of set targets (Campbell, 2003). Inconsistency in provision of feedback affects information flow. This has been caused by lack of effective and efficient mechanism for ensuring two way communications (Health Metrics Network, 2007).
Existence of unsupportive organization culture has resulted in negative behaviours and attitudes towards data management and data use. Word Health Organization (2008) found negative attitudes among health professions such as the feeling that data collection is a useless activity or a waste of service care-provider time to be detrimental to data quality and its use for decision-making. As a result, perceptions and attitudes towards design and implementation of data management and use plans influenced use data in informing decision-making. Staff complained of lack interest in aspects of decision-making involving data and non-use of the data collected which demotivated them. Process of collecting data, analysing, interpreting and using of data was reported to be tedious, complex and boring (MEASURE Evaluation Report, 2008) which negatively affected the value of data in decision-making.
The study indicated that lack of good will for data use among the management especially the senior managers and their failure to promote evidence-based decision-making and the use of information for transparency and accountability created a culture of making un-informed decision which was based on projections and estimates (Land et al., 2002).
Empowerment of staff to make decisions was found to be significantly related to data use. Empowering staff to make decisions encouraged staff to seek information and data for use in making decisions. A study by Galimoto (2007) revealed that where there was formal structures of hierarchy delegation and empowerment of junior staff, data sharing and use was improved as noted by use of data to support decisions for accountability. Such structure were also good in defining flows of health information and the related communication practices which enhances data sharing and provision of feed-back (Nutley, 2012).
Use of data to set and evaluate performance targets encouraged data use. Where data was available to track progress continuously, staffs were encouraged to use the data to ensure they were able to meet their set targets (Even et al., 2006). At times, the data was collected for formality with staff not paying much interest on its use for the various activities they perform. This culture was common in the public health facilities where staff performance was not given very high attention. Adopting values and behaviours which encourage data use for decision-making provides an important thrust for improving evidence-based decision-making processes which are associated with positive outcomes.
Conclusions
The study conclusions are based on the study findings.
- Use of routine health information
Results indicated that use of routine data for decision making stood at 67%. A substantial proportion of the sub-county health management team decision making processes were not informed by the routine data which negatively affects decision outcome.
- Socio-demographic factors
The results showed that education (p=0.011) influence use of routine data for decision-making.
- Technical factors
Results indicated that availability of reporting tools (p=0.049), staff trainings on data use (p=0.005), access to the internet (p=0.000) availability of computers (p=0.002) and possession of data analysis skills (p=0.000) influence use of data for decision-making.
- Perceived data quality factors
Results showed that accuracy of data (p=0.001), completeness of data (p=0.014), performance of data duality audit (0.011), legibility and accuracy of records (0.006) and adherence to reporting timeliness (p=0.000) influence use of data for decision-making.
- Access Factors
Results indicated that attitudes toward data (p=0.027), availability of data sharing mechanisms (p=0.001), provision of data feedback (p=0.000), access to data and information (p=0.033), empowerment of staff to make decisions (p=0.042), use of data to set and evaluate targets (p=0,037), ensuring staff accountability for performance (p=0.007) influence use of data for decision-making.
Recommendations
This study recommends that Makueni County Health management team in consultation with other key stakeholders (National Government, partners, sponsors and community) to do the following:
- Computerization of information management to enhance efficient data management and sharing, provision of efficient feedback and retrieval of data;
- Provide internet connectivity and sufficient supportive facilities such as computers to facilitate data and information sharing, retrieval and access to additional information resources required for decision-making;
- Provide adequate data collection and reporting tools to facilitate collection and entry of data into the information system to support decision-making;
- Develop staff technical capacity and competence for use of data to make decisions. This needs on-going and refresher trainings which enhances evidence-based decision-making such as data management, records management and application of data to support decisions;
- Institutionalize use periodic data quality checks such as prompt supervisions, data quality audit to and clear guidelines for performing the checks to enhance reliability and validity of the data. This will boost confidence and trust in the quality of data available for decision-making;
- Promote a culture of data use for decision-making by making available quality data and encouraging data use for decision-making such as empowering staff to make evidence-based decisions, promoting positive attitude towards data use and supporting use of data to monitor and evaluate set targets;
Recommendation for Further Research
The study makes recommendations for further study on
- An in-depth qualitative study on challenges and opportunities for evidence-based decision-making in the health sector
- Incentives and disincentives for data use for decision-making
DEDICATION
I dedicate this work to members of my family for their unwavering material, moral and spiritual support all through this course.
ACKNOWLEDGEMENT
The finalization of this study is a culmination of invaluable contributions by various persons. I wish to extend special thanks to my supervisors Dr. George Ochieng Otieno and Dr. Andrew Yitambe who gave me unlimited audience, guidance and support throughout this study.
Last but not least, I wish to express my gratitude to almighty God, members of my family and friends, for their invaluable material, moral and spiritual support without which this research thesis would not have been possible.
I am also thankful to all those who participated both directly and indirectly in the completion of this thesis.
God bless you all.
REFERENCES
- Campbell B. (2003). Data to decision making: delusion or destiny? Keynote address at the Second International RHINO Workshop on Enhancing the Quality and Use of Routine health Information at District Level, Cape Town. RHINO.
- Chengalur-Smith, I., Ballou, D. P., & Pazer, H. (1999). The impact of data quality information on decision making: an exploratory analysis. IEE Transactions on Knowledge and Data Engineering; 11: 853-864.
- Crosby, P. (1980). Quality is Free. New York: Penguin Group.
- Davidson, C. & Voss, P. (2002). Knowledge Management: An Introduction to Creating Competitive Advantage from Intellectual Capital. Auckland: Tandem Press.
- Deming, W. (1982). Out of the Crisis. Cambridge: Massachusetts Institute of Technology.
- English, L. (1999a). Improving Data Warehouse and Business Information Quality. New York: John Wiley & Sons.
- Even, A., Shankaranarayanan G. & Watts S. (2006). Enhancing Decision Making with Process Metadata: Theoretical Framework, Research Tool, and Exploratory Examination. Proceedings of the 39th Hawaii International Conference on System Sciences.
- Fisher C., Chengalur-Smith I., & Ballou, D. (2003). The impact of experience and time on the use of data quality information in decision making. Information Systems Research; 14: 170-188.
- Fuller B. and Redman T. (1994). Data Quality lessons learned at Telecom Australia, QUALCON, 94: 379-386.
- Galimoto M (2007). Integration of health information systems: a case study of Malawi. Masters
- Gendron M. and D’Onofrio J. (2001). Data Quality in the Healthcare Industry. Data Quality Journal, 7(1):13-26.
- Hardon A., Boonmongkon P., Streefland P., Tan L., Hongvivatana T., Geest D., Staa A, Varkevisser C., Chowdhury M., Bhuiya A., Sringeryuang L., Dongen, V. and Gerrits T., (2001). Applied health research manual: anthropology of health and health care. Netherlands: Het Spinhuis Publishers.
- Health Metrics Network (2007). Strengthening Country Health Information Systems: Assessment and Monitoring Tool (draft 1.0). Geneva, Health Metrics Network.
- Hovenga E., Kidd M. and Cesnik B. (1996). An overview of Health Informatics. Melbourne: Churchill Livingstone.
- Juran M. and Godfrey B. (1999). Juran’s Quality Handbook (5 ed.). New York: McGraw-Hill.
- LaFonde and Siddiqi M. (2003). Report on second international RHINO workshop on enhancing the quality and use of routine health information at district level. MEASURE Evaluation.
- Land F. and Kennedy-McGregor M. (2002). Effective use of internal information. London: London School of Economics and Political Science, Working Paper Series.
- Loshin, D. (2001). Enterprise Knowledge Management. The Data Quality Approach; California: Academic Press.
- Malcom A. (1998). Poor data quality costs 10% of revenues, survey reveals. Available at: http://computerworld.co.nz/news.nsf/UNID/CC256CED0016AD1E CC25684C000E0278?OpenDocument&Highlight=2,Poor,data,quality,costs
- MEASURE Evaluation (2005). Decision Maker Perceptions in Kenya and Nigeria. An assessment of Data Use Constraints.
- MEASURE Evaluation (2008). Routine Data Quality Assessment Tool: Guidelines for Implementation. Available at: cpc.unc.edu/measure/tools/ monitoring-evaluation-systems/data-quality-assurance-tools
- MEASURE Evaluation (2013). Tools for Demand and Use in the Health Sector. Available at: measureevaluation.org. Ministry of Health
- Ministry of Health (2006). National Health Sector Strategic Plan II: 2005-2010. Nairobi: Ministry of Health.
- Mugenda, O and Mugenda, G. (2003). Research Methods: Quantitative and Qualitative Approach. Nairobi: Acts Press
- Nutley T. (2012). Improving data use for decision making- An intervention to strengthen health systems. MEASURE Evaluation.
- Odhiambo-Otieno G. (2005). Evaluation of existing district health management information systems: a case study of the district health systems in International Journal of medical information, 12(4):67-73
- Redman, T. (2001). Data Quality. The Field Guide. Boston: Digital Press.
- Rodrigues R (2000). Information systems: the key to evidence based health practice. Geneva: World Health Organization.
- Saba V. and McCormick, K. (2001). Essentials of Computers for Nurses. Informatics for the New Millennium (Third ed.). New York: McGraw-Hill.
- Sauerborn & Lippeveld (2000). Design and implementation of health information system, Geneva: World Health Organisation.
- U (2002). Research methods for business: Skill buildings approach (4th ed). New York: Wiley.
- Strauss E., Scott Richardson W., Glasziou P., & Haynes B. (2005). Evidence based medicine (third ed.), London: Churchill Livingstone
- Tayi K. and Ballou P. (1998). Examining data quality, Communications of the ACM, 41: 54-57.
- Wang Y. (1998). A product perspective on total data quality management, Communications of the ACM. New York: Association for Computing Machinery.
- WHO (2008). Framework and standards for country health information systems. Geneva: World Health Organisation.
- Wilson R., Rohde J., Puchert R. and Hedberg C., (2001). South Africa’s district health Information systems: case study from Eastern Cape Province. In: The RHINO workshop on issues and innovation in routine health information in developing countries; The Bolger Center, Protomac, MD, USA
DECLARATION
This thesis is my original work and has not been presented for award of a degree in any other University:
Signature …………………………….. Date…………………
Name Jeremiah Mwendwa Mumo
Reg.No. Q140/CTY/PT/27224/2013
This thesis is submitted for examination with our approval as University supervisors:
Signature …………………………….. Date…………………
Dr. George Ochieng Otieno, PhD
Department of Health Management and Informatics
Kenyatta University
Signature …………………………….. Date…………………
Dr. Andrew Yitambe, PhD
Department of Health Management and Informatics
Kenyatta University
APPENDICES
Appendix 1: Budget
| ITEM | Description | Quantity | Cost @ item | Amount (Ksh) |
| Stationery | Pens | 36 | 20 | 720 |
| Note pads | 10 | 50 | 500 | |
| Printing papers (rims) | 5 | 500 | 2,500 | |
| Internet and printing | Printing charges | 300 | 5 | 1,500 |
| Photocopying | 1000 | 3 | 3,000 | |
| Spiral binding | 6 | 100 | 600 | |
| Hardcover binding | 4 | 2000 | 8,000 | |
| Training research assistants | Hall hire | 1 | 10,000 | 10,000 |
| Transport refund | 4 | 1,000 | 4,000 | |
| Lunch allowances | 4 | 300 | 1,200 | |
| Research assistants retention fee | wages | 4 | 10000 | 40,000 |
| Transport & Communication | Fare | 4 | 6000 | 24,000 |
| Research assistants Airtime | 4 | 2000 | 8,000 | |
| Principal Researcher Airtime | 1 | 8,000 | 8,000 | |
| Voice recorders | Hire of Voice recorders | 2 | 2,500 | 5,000 |
| Data analysis | Data analysis | 1 | 40,000 | 40,000 |
| Supervision | 0 | |||
| Sub-Total | 157,020 | |||
| 10% miscellaneous | 15,702 | |||
| Total | 172,722 | |||
Appendix 2: Work Plan
| Year | 2015 | 2016 | ||||||||||
| Activity | M | J | J | A | S | F | M | A | J | J | S | O |
| Concept paper | ||||||||||||
| Proposal writing | ||||||||||||
| Proposal defense | ||||||||||||
| Ethical approval | ||||||||||||
| Training of research assistants | ||||||||||||
| Pretesting of data tools | ||||||||||||
| Data Collection | ||||||||||||
| Data analysis and report writing | ||||||||||||
| Thesis defense | ||||||||||||
| Manuscript Publication | ||||||||||||
Appendix 3: Informed Consent Form
Researchers’ Statement
Goodmorning/afternoon, my name is Jeremiah Mumo. I am a masters student at Kenyatta University. Today I am here to carry out a study on data use for decision-making among Sub-County Health Management Teams in Makueni County. This form will give you information you need, so that you can make a decision on whether to participate or not to in the study. There are no wrong or right answers. You will be given time to consider if you would like to be in the study. Please read the form well and ask where you don’t understand. Please be honest and truthful in answering the questions. I assure you that the information you give will be totally confidential and you will not be required to identify yourself by name.
Procedure:
You will be interviewed using a self-administered questionnaire (You will be assisted in case you are unable to read or write). The interview will last for about half an hour and participants will be required to give answers to all the questions. Participants will have the opportunity to make suggestions and give information on data use for decision-making in Makueni County.
Risks and benefits
People in the county could learn of your involvement in the study. To protect you from this risk, all information you will give us will be kept confidential within our research team. All the data will be stored in a password protected computer. There is no financial compensation or other personal benefits from participating in the study. Your participation and/or answers to the questions may provide useful insights into improving community strategy in Kenya.
Confidentiality and voluntary participation
No names will be used on any of the reports from the study. All the respondents will be given different identification numbers and the information relating to each participant will be strictly confidential, available only to the study team. Notes and any other recordings done will be destroyed once summary is prepared. Your participation is voluntary, and you may therefore refuse to answer any question or stop the interview at any time without suffering any consequences.
Instructions:
When you sign, it shows that you have agreed to participate in the study. If you do not understand any part of the information that has been read to you/you have read, be sure to ask questions. Do no sign until you have understood all that is expected or required.
| I wish to take part in the study entitled: Data Use for decision-making among Sub-County Health Management Team in Makueni County, Kenya.
I understand that I may at any time during the study withdraw my consent without any consequences. I have understood the information given in this sheet and I give my consent to be interviewed. Respondent number ………………………..Signature………………………………….. Date…………………………Name of the researcher:…………………………………… Signature……………………………………Date………………………………………
|
If you require further information, please contact:
If you require more information, please contact:
- The Chairman
Ethical Review Committee, Kenyatta University
P.O BOX 43844-00100, Nairobi
Tel:+254-020-8710901-19
Email: chairman.kuerc@ku.ac.ke
- Dr. George O., Supervisor,
Department of Health Management and Informatics, Kenyatta University
P.O BOX 43844-00100, Nairobi
Tel: +254-020-8710901-19
Email: otienogo@gmail.com
- Dr. Yitambe A., Supervisor,
Department of Health Management and Informatics, Kenyatta University
P.O BOX 43844-00100, Nairobi
Tel: +254-020-8710901-19
Email: adrewyita2000@yahoo.com
Appendix 4: Self-Administered Questionnaire
DENTIFICATION PANEL
Position…………………………………………………Job title……………………………………………….
Sub-county……………………………………………. Work station……………………………………….
Fill in the following details
PART A. SOCIO – DEMOGRAPHIC DETAILS (PLEASE TICK)
- What is your Gender? [1] Male [2] Female
- What is your age? [1] 20-30 years [2] 30-40 years [3] 40-50 years
[4] 50-60 years
- What is your experience in your current position?
[1] Less than 1 yr [2] 3 yrs [3] 5 yrs [4] 10yrs +
- What is your highest level of education attained?
[1] Certificate [2] Diploma [3] High National Diploma [4] Undergraduate
[5] Masters [6] PhD
| 5.Data Use | |||||
| On a scale of 1-5 please indicate the extent to which you use routine data to inform decision on the following (where 1 means Not at all,2 means Rarely,3 means sometimes,4 means frequently and 5 means Always. Circle appropriately. | |||||
| Day to day program management | 1 | 2 | 3 | 4 | 5 |
| Medical supply and drug management | 1 | 2 | 3 | 4 | 5 |
| Formulating plans | 1 | 2 | 3 | 4 | 5 |
| Budget preparation | 1 | 2 | 3 | 4 | 5 |
| Budget allocation | 1 | 2 | 3 | 4 | 5 |
| Human resource management | 1 | 2 | 3 | 4 | 5 |
| Monitoring key objectives | 1 | 2 | 3 | 4 | 5 |
| Identification of emerging issues such as epidemics and outbreaks | 1 | 2 | 3 | 4 | 5 |
|
||
| Availability of data collection tools. | Yes | No |
| There are adequate registers (primary data collection tools) in the facilities in the sub county? | ||
| There is no time the registers have been out of stock for the last 6 months | ||
| There are adequate summary forms for reporting in the facilities in the sub county? | ||
| There is no time the registers/summary tools have been out of stock for the last 6 months | ||
| User skills and knowledge. | Yes | No |
| I am able to retrieve any data I need from the data basis/reports | ||
| I can be able to gather and analyze data that I need for decision-making | ||
| The data provided is simple to understand and interpret for use | ||
| I am trained on data analysis | ||
| I can easily analyze data to my own use | ||
| Information Technology(hardware and software) | Yes | No |
| I have adequate computers in my office are networked for data sharing and reporting | ||
| I have adequate equipments for managing data for use | ||
| I have unlimited access to internet in my office | ||
| Complexity of data | Yes | No |
| Available data is simple to understand, analyze and use | ||
| I have adequate skills for understanding, interpreting and using complex data | ||
| I can only be able to understand and use data well if it is interpreted in a simple way | ||
| 1. Data Quality | Yes | No |
| Over the last 6 months, have you encountered any of the following when trying to use health data or information | ||
| a) Incomplete data/information | ||
| b) Comprehensives of data | ||
| c) Lack of data/information required (Data not available at all) | ||
| d) Data/information being provided when late (Untimely data) | ||
| e) Inaccurate data/information (incorrect data) | ||
| f) Parallel and conflicting data sources | ||
| g) Data/information not well presented | ||
| h) Data/information lacking authecity/integrity | ||
| i) Data/information which is inconsistent | ||
|
Yes | No |
| Attitude | ||
| I like dealing with information | ||
| Dealing with a lot of information makes me feel bored | ||
| I can make most decisions without data/information because I have experience | ||
| Most of my work roles/responsibilities doesn’t require data/information to do them | ||
| Data Sharing | Yes | No |
| There is a good data sharing mechanism | ||
| We regularly share data among the staff | ||
| We give timely feedback on data issues? | ||
| We hold meetings to discuss and share data regularly | ||
| Data storage | Yes | No |
| I like dealing with in form of hard copy (manual data such as print outs) | ||
| I like dealing with data in form of soft copy (e.g. data stored in computers) | ||
| Organizational Culture | Yes | No |
| There is a policy in the sub-county to guide data use in decision-making | ||
| We use HMIS data for day to day management of the sub county | ||
| Our working environment inspires staff to seek and use data | ||
| Our staff rely on data for making decisions | ||
| Our staff are personally motivated to seek and use data in doing their work | ||
| Leadership | Yes | No |
| Our superiors support data sharing and use | ||
| There is good accountability for data use in this sub-county | ||
| We allocate adequate budget to support data demand and use in making decisions | ||
| Adequacy of staff | Yes | No |
| I have adequately trained staffs to handle data that I need for decision-making? | ||
| Data staff are aware of their responsibilities regarding data management | ||
| We don’t have staff who can meet our data/information needs adequately |
Thank you for your Time and Participation
Appendix 5: Key informant guide
Position…………………………………………………Job title……………………………………………….
Sub-county……………………………………………. Work station……………………………………….
Part A: Data use and demand
- What informs decision-making processes in this county? Probe for: Data use and demand, basis of decisions (facts/evidence, superiors directives, political interference and cost considerations)
Part B: Technical factors
- Is there the technical capacity to manage data for use in this county? Probe for: Data collection and reporting tools, equipment, skills and knowledge, Technology and data complexity)
Part C: Perceived data quality factors
- Is there data quality issues perceived to influence data demand and use for decision-making in this County/sub-county? Probe for: completeness, comprehensiveness, integrity, accuracy, simplicity, currency, parallel data sources, consistency)
Part D: Access factors
- Is data/information for decision-making easily accessible to staff within the county? What issues are perceived to affect accessibility of such data? (Probe for: availability, storage format, irretrievability, cost, attitude, staff adequacy, leadership, data sharing and feedback)
Appendix 6: Map of Makueni County
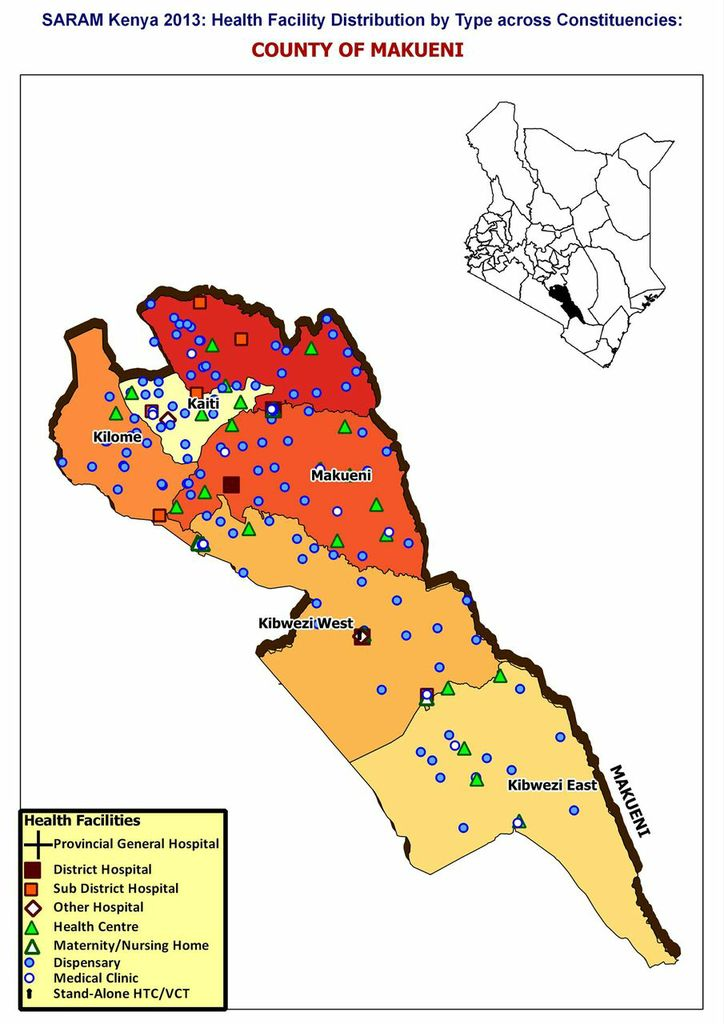
Figure 3.1: Map of Makueni County
Source: Saram, 2013
Appendix 7: Sub-County Health Management Team Members