Predictive Modeling of PowerSchool Usage: Comparative Analysis of Linear Regression and Data Mining Techniques Using Student Attributes
- Edelyn Rose R. Dawat
- 75-85
- Nov 27, 2023
- Education
Predictive Modeling of PowerSchool Usage: Comparative Analysis of Linear Regression and Data Mining Techniques using Student Attributes
Edelyn Rose R. Dawat
Graduate School Department, University of the Immaculate Conception, Davao City, Philippines
DOI: https://dx.doi.org/10.47772/IJRISS.2023.7011006
Received: 06 November 2023; Revised: 16 November 2023; Accepted: 20 November 2023; Published: 27 November 2023
ABSTRACT
This research investigates Linear Regression, Artificial Neural Network (ANN), and Decision Tree Analysis in predicting PowerSchool usage based on student attributes (GPA, attendance, behavior). Linear Regression highlights GPA as the strongest predictor, achieving 62% predictive adequacy. The ANN model displays high accuracy but with increased incorrect predictions during testing, emphasizing the importance of GPA. Decision Tree reveals a 0.298 uncertainty despite high recall. The ANN model outperforms, demonstrating superior accuracy and recall, while the Linear Model shows good accuracy and precision. Although the Decision Tree Model presents high recall, it slightly lags in accuracy and precision. The F1-Measure peaks at 0.9231 for the ANN Model, offering directions for future model enhancements.
Keywords: PowerSchool Usage, Predictive Modeling, Artificial Neural Network, Decision Tree, Linear Regression
INTRODUCTION
In the contemporary educational landscape, the integration of technology has significantly transformed the methods of student engagement and academic monitoring. PowerSchool, a widely used student information system, plays a pivotal role in facilitating educational processes by offering an interface for students, teachers, and parents to access grades, attendance records, and behavioral information. Understanding the determinants affecting its usage becomes essential in harnessing its potential to enhance educational outcomes.
Despite the widespread use of PowerSchool, there exists a notable gap in understanding the factors that influence its usage among students. While attributes such as GPA, attendance, and behavior are commonly believed to impact the frequency of PowerSchool utilization, comprehensive studies systematically analyzing and modeling these relationships are lacking. Traditional statistical methods like linear regression have been frequently utilized in exploring these associations, but there’s a scarcity of research investigating more advanced data mining techniques, such as Artificial Neural Networks (ANN) and Decision Trees, in predicting PowerSchool usage based on student attributes as noted by Mengash (2020).
According to Mohamad and Tasir (2013), while existing studies acknowledge the influence of academic performance and student attributes on educational technology usage, a distinct gap exists in leveraging advanced data mining methods like Decision Trees and Artificial Neural Networks to predict the utilization of platforms such as PowerSchool. Addressing this gap is critical for a deeper comprehension of the drivers behind student engagement with educational technology.
Given the increasing integration of technology in education, there is a compelling need to comprehensively understand student behavior and interactions with educational platforms. A nuanced understanding of the factors impacting PowerSchool usage holds the potential to inform educators, administrators, and policymakers in tailoring interventions to promote its effective utilization, thereby enhancing student engagement and academic success (Alharbi et al., 2016).
Furthermore, the application of advanced predictive modeling techniques like ANN and Decision Trees presents an opportunity to uncover intricate patterns within the dataset that might remain hidden through conventional statistical methods. This aligns with the evolving field of educational technology research, emphasizing the necessity for sophisticated data analytics in education (Zhang et al, 2020).
OBJECTIVES AND FOCUS OF THE STUDY
This research aims to compare and contrast the efficacy of linear regression, Artificial Neural Networks (ANN), and Decision Trees in predicting PowerSchool usage based on student attributes. The primary objectives are:
- To assess the relationship between student attributes (GPA, attendance, behavior) and PowerSchool usage using linear regression analysis.
- To employ Artificial Neural Networks in forecasting PowerSchool usage and identify significant predictors.
- To utilize Decision Trees to predict PowerSchool usage and understand its features in the regression.
- To critically evaluate the strengths of each predictive approach in capturing and explaining the dynamics of student engagement with PowerSchool.
The study focuses on a comprehensive analysis of student data in Suzhou Bei Mei School, China for academic year 2021-2023 to 1094 high school students and applies diverse statistical and data mining techniques to construct predictive models, shedding light on the significant predictors of PowerSchool usage and offering valuable insights for educators and administrators.
REVIEW OF RELATED LITERATURE
The study of predictive modeling techniques concerning educational technology usage and student attributes has garnered substantial attention in academic literature. Analysing the impact of student attributes on educational technology utilization has been a central focus. Hussain (2021) employed linear regression to study the correlation between student attributes and technology use, finding a significant positive association between higher GPA and increased usage of educational platforms. This demonstrates the effectiveness of linear regression in understanding the relationship between student attributes and technology utilization, aligning with the objective to assess the relationship between student attributes and PowerSchool usage.
In addition to linear regression, Artificial Neural Networks (ANN) have been extensively utilized in forecasting student engagement with educational platforms. Research by Sami et al. (2023) employed ANN in predicting student interactions with learning management systems. Their findings suggested that ANN was effective in identifying influential predictors, showcasing its potential applicability in forecasting PowerSchool usage based on student attributes, aligning with the second objective.
Furthermore, the application of Decision Trees in predicting technology usage patterns has been explored. Huynh et al. (2021) utilized Decision Trees to predict student engagement with e-learning platforms. Their study illustrated the Decision Tree’s ability to identify critical predictors affecting system usage, supporting its comparative performance in predicting technology adoption among students, aligning with the third objective.
Moreover, recent literature has emphasized the critical evaluation of predictive approaches in understanding student engagement within educational systems. Ibrahim & Rusli (2007) critically compared the strengths and weaknesses of various predictive techniques in explaining student interactions with educational technologies. Their analysis provided valuable insights into the strengths of each technique, contributing to the objective of critically evaluating the predictive approaches’ effectiveness in explaining the dynamics of student engagement within PowerSchool.
CONCEPTUAL FRAMEWORK
METHODOLOGY
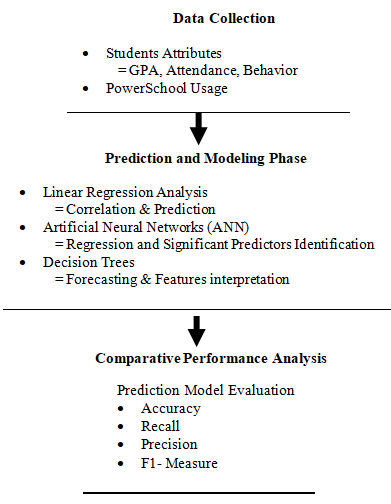
In this study, three regression models will be utilized to predict PowerSchool Usage based from students’ attributes.
Data Collection
The research drew data from 1094 high school students enrolled at Suzhou Bei Mei School in China over the academic years 2021 to 2023. Information on students’ attributes, specifically General Point Average (GPA), Attendance, Behavior insights (rated on a scale from 1 to 5), and PowerSchool usage (ranked from 1 to 5), were collected and utilized for analysis.
Visualization and Analysis
The Statistical Package for the Social Sciences (SPSS) software was employed to clean, organize, visualize, and analyze the collected data.
To address the objectives, the following methods were performed:
Relationship Analysis and Linear Regression:
- To evaluate the correlation between student attributes (GPA, attendance, behavior) and PowerSchool usage, a correlation coefficient was generated.
- A linear regression model was developed to predict PowerSchool usage based on the identified variables.
Utilization of Artificial Neural Networks (ANN):
- The Multilayer Perception (MLP) topology was employed to establish the ANN model due to the data size constraints, providing forecasting for PowerSchool usage and determining significant predictors. The model also generated an independent variable importance matrix.
Application of Decision Trees:
- Using the classification Tree function in SPSS, a Decision Tree model was simulated to predict PowerSchool usage and comprehend its features in regression. The model summary was generated for analysis.
Critical Evaluation of Predictive Approaches:
- Accuracy rate, recall, precision, and F1-Measure were computed for the three regression models (linear, ANN, and Decision Tree models) to critically evaluate their effectiveness in capturing and explaining the dynamics of student engagement with PowerSchool.
RESULTS AND DISCUSSIONS
The study derived significant insights related to student attributes and PowerSchool usage at Suzhou Bei Mei School, China, between 2021 and 2023.
Relationship Analysis and Linear Regression:
Table 1. The Correlation between Students’ attributes and PowerSchool Usage.
| Correlations | |||||
| PowerSchool Usage | Attendance | GPA | Behavior | ||
| Pearson Correlation | PowerSchool Usage | 1.000 | 0.237 | 0.774 | 0.534 |
| Attendance | 0.237 | 1.000 | 0.235 | 0.342 | |
| GPA | 0.774 | 0.235 | 1.000 | 0.522 | |
| Behavior | 0.534 | 0.342 | 0.522 | 1.000 | |
| Sig. (1-tailed) | PowerSchool Usage | .000 | .000 | .000 | |
| Attendance | .000 | .000 | .000 | ||
| GPA | .000 | .000 | .000 | ||
| Behavior | .000 | .000 | .000 | ||
According to the correlation matrix analysis, the PowerSchool usage of students demonstrates a weak positive linear relationship with attendance at 23.7%, a moderately positive linear relationship with behavior at 53.4%, and a notably strong positive correlation with GPA at 77.4%. This signifies that all the relationships between students’ attributes, namely attendance, behavior, and GPA, with PowerSchool usage were statistically highly significant. Notably, among the predictors, GPA exhibited the strongest association with Power School usage.
Table 2. The Linear Model between Students’ attributes and PowerSchool Usage.
| Model Summaryb | |||||
| Model | R | R Square | Adjusted R Square | Std. Error of the Estimate | |
| 1 | .789a | 0.622 | 0.621 | 0.539 | |
Table 3. The ANOVA between Students’ attributes and PowerSchool Usage.
| ANOVAa | ||||||
| Model | Sum of Squares | df | Mean Square | F | Sig. | |
| 1 | Regression | 520.827 | 3 | 173.609 | 597.406 | .000b |
| Residual | 316.759 | 1090 | 0.291 | |||
| Total | 837.587 | 1093 | ||||
As per the model summary and ANOVA, the combined influence of students’ attributes—behavior, GPA, and attendance—on PowerSchool usage is registered at 78.9%. The linear model demonstrates a 62% adequacy in predicting PowerSchool usage, which is statistically significant.
Table 4. The Coefficients between Students’ attributes and PowerSchool Usage.
| Coefficientsa | ||||||
| Model | Unstandardized Coefficients | Standardized Coefficients | t | Sig. | ||
| B | Std. Error | Beta | ||||
| 1 | (Constant) | -2.178 | 0.253 | -8.602 | .000 | |
| Attendance | 0.002 | 0.003 | 0.019 | 0.948 | 0.344 | |
| GPA | 0.062 | 0.002 | 0.679 | 31.014 | 0 | |
| Behavior Insights | 0.187 | 0.025 | 0.173 | 7.623 | .000 | |
The linear model utilized to forecast PowerSchool usage is expressed as follows:
Predicted PowerSchool usage = -2.178 + 0.002 (Attendance) + 0.062 (GPA) + 0.187 (Behavior)
Utilization of Artificial Neural Networks (ANN):
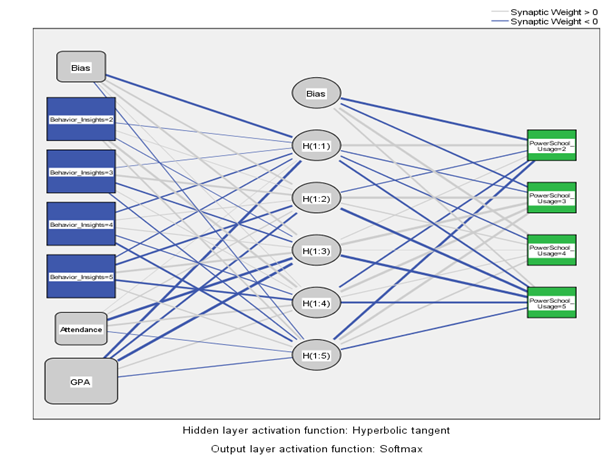
The neural network structure comprises:
- Input Layer: Comprising Behavior Insights, Attendance, and GPA. The covariates are standardized for data consistency.
- Hidden Layer: Housing 5 neurons with a hyperbolic tangent function, enabling intricate pattern recognition.
- Output Layer: Predicting PowerSchool Usage via 4 output units utilizing a Soft max activation function, suitable for multi-class classifications.
- The network lacks a bias unit. These features provide insight into the flow of information across layers for predictive modeling purposes.
Table 5. The ANN Model between Students’ attributes and PowerSchool Usage.
| Model Summary | ||
| Training | Cross Entropy Error | 338.832 |
| Percent Incorrect Predictions | 25.10% | |
| Stopping Rule Used | 1 consecutive step(s) with no decrease in errora | |
| Training Time | 00:00.7 | |
| Testing | Cross Entropy Error | 153.983 |
| Percent Incorrect Predictions | 28.50% | |
The neural network’s performance metrics are as follows:
- Training Performance: Cross-entropy error was 338.832 during training, with 25.1% incorrect predictions. The stopping rule was triggered after 1 step without error reduction, and training lasted around 0.71 seconds.
- Testing Performance: The cross-entropy error reduced to 153.983 during testing, but the percentage of incorrect predictions rose to 28.5%. These metrics are based on the testing sample, providing insight into error rates and prediction accuracy during training and testing phases.
Table 6. The Predictors Importance Analysis between Students’ attributes and PowerSchool Usage.
| Independent Variable Importance | ||
| Importance | Normalized Importance | |
| Behavior | 0.367 | 90.90% |
| Attendance | 0.229 | 56.70% |
| GPA | 0.404 | 100.00% |
The analysis of independent variable importance highlights their significance in predicting the outcome:
- Behavior: Holds a value of .367, contributing to 90.9% normalized importance.
- Attendance: Recorded at .229, contributing 56.7% to the normalized importance.
- GPA: Registered with a value of .404, representing the highest normalized importance at 100.0%.
These values represent the relative impact of each independent variable on predicting the outcome, indicating that GPA holds the highest normalized importance (100.0%) among the variables
Application of Decision Trees:
Table 7. The Decision Tree Model Summary between Students’ attributes and PowerSchool Usage.
| Model Summary | ||
| Specifications | Growing Method | CHAID |
| Dependent Variable | PowerSchool Usage | |
| Independent Variables | Attendance, GPA, Behavior Insights | |
| Validation | None | |
| Maximum Tree Depth | 3 | |
| Minimum Cases in Parent Node | 100 | |
| Minimum Cases in Child Node | 50 | |
| Results | Independent Variables Included | GPA, Attendance, Behavior Insights |
The CHAID model summary highlights the key specifics and outcomes of the analysis:
- Specifications: The CHAID model predicts PowerSchool Usage using independent variables: Attendance, GPA, and Behavior Insights.
- Validation: No validation method was utilized in the analysis.
- Tree Characteristics: The tree depth was capped at 3, with minimum cases set at 100 for the parent node and 50 for the child node.
- Results: Significant independent variables in the model encompassed GPA, Attendance, and Behavior Insights.
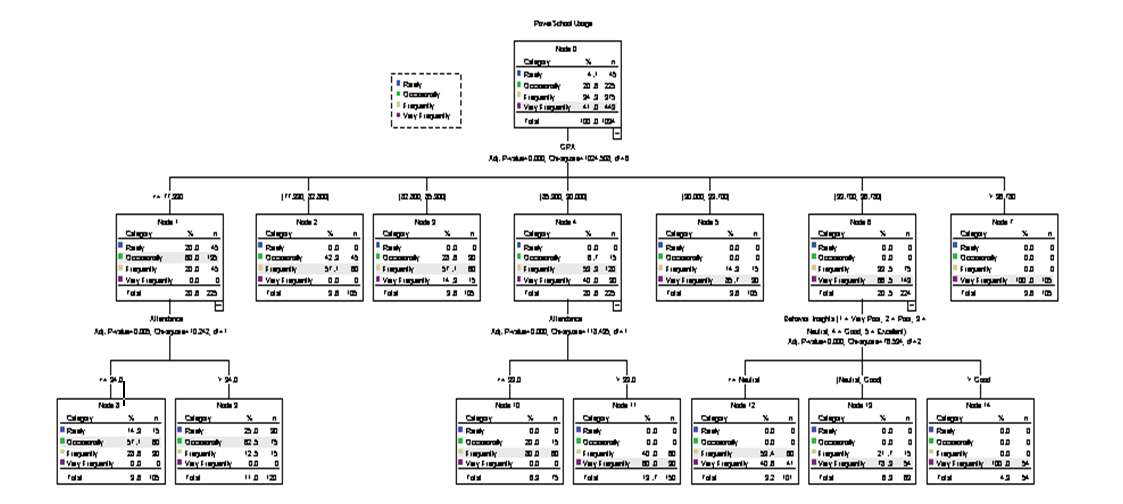
- Tree Structure: The model comprised 15 nodes, including 11 terminal nodes, with a depth of 2. These details provide insight into the CHAID model setup and the importance of specific independent variables for predicting PowerSchool Usage.
Fig. 2. The Decision Tree diagram between Students’ attributes and PowerSchool Usage.
Table 8. The Decision Tree Model Summary between Students’ attributes and PowerSchool Usage.
| Risk | |
| Estimate | Std. Error |
| 0.298 | 0.014 |
Growing Method: CHAID
The risk estimate is .298 with a standard error of .014. These values were obtained using the CHAID growing method with PowerSchool Usage as the dependent variable. This risk estimate indicates the level of risk associated with the predicted outcome, suggesting a certain level of uncertainty in the prediction.
Table 9. The Decision Tree Model Summary between Students’ attributes and PowerSchool Usage.
| Evaluation Metrics | Prediction Techniques | ||
| Linear_Model | ANN_Model | Decision Tree Model | |
| Accuracy | 85.28 | 91.67 | 80.6 |
| Recall | 81.67 | 99.99 | 94.54 |
| Precision | 88.02 | 85.71 | 73.93 |
| F1-Measure | 84.73 | 92.31 | 82.98 |
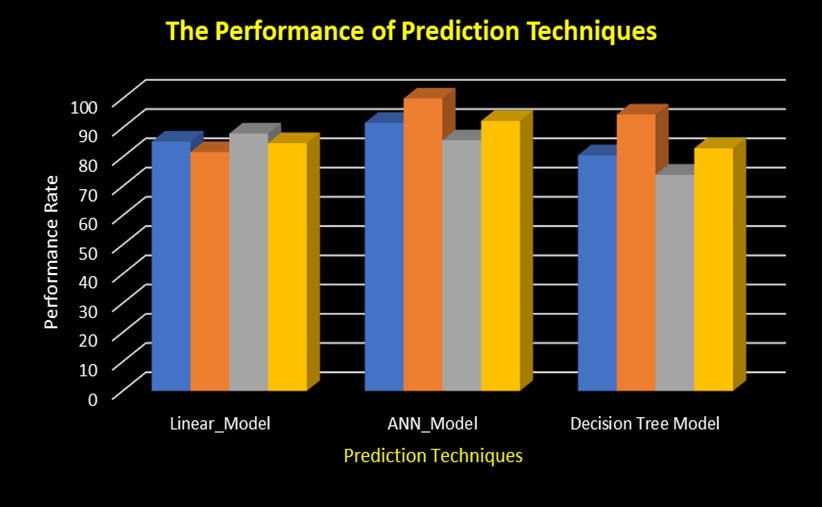
Fig.3 The Performance Analysis of three Prediction Techniques – Linear Regression, Artificial Neural Network (ANN), and Decision Tree Model to forecast PowerSchool Usage based from Students’ attributes.
In overview, the evaluation metrics for three prediction techniques—Linear Model, Artificial Neural Network (ANN) Model, and Decision Tree Model—are as follows:
- The ANN Model outperforms the others with the highest accuracy (0.9167) and recall (0.9999).
- The Linear Model follows with good accuracy (0.8528) and precision (0.8802).
- The Decision Tree Model, while having a high recall (0.9454), has slightly lower accuracy (0.8060) and precision (0.7393).
- The F1-Measure, which balances precision and recall, is highest for the ANN Model (0.9231).
CONCLUSIONS
In the examination via Linear Regression analysis, a discernible relationship emerged between student attributes (GPA, attendance, behavior) and their PowerSchool usage. Among the predictors, GPA showcased the most robust association with PowerSchool usage, illustrating a 62% predictive adequacy within the linear model.
Regarding the Artificial Neural Network (ANN) analysis, the model presented heightened accuracy and recall rates. However, an escalation in incorrect predictions surfaced during testing. Notably, GPA exhibited the highest normalized importance in predicting the outcome.
In the Decision Tree analysis employing the CHAID model, a comprehensive outline delineated the structure’s specific components and the significance of various variables in predicting PowerSchool usage. An estimated risk of .298 with a standard error of .014 surfaced, indicating a level of uncertainty in predictions.
Summarily, the ANN model excelled in overall performance, showcasing superior accuracy, recall, precision, and F1-Measure, thereby outclassing both the Linear Model and the Decision Tree Model.
RECOMMENDATIONS
Though the study resulted to above satisfactorily of at least 73%, it is recommended to delve deeper into several areas:
- Feature Engineering and Additional Variables: Incorporate additional relevant factors beyond GPA, attendance, and behavior that could influence PowerSchool usage. This might include extracurricular activities, socio-economic factors, or teacher engagement to create a more comprehensive predictive model.
- Comparative Model Analysis: Conduct a comparative study with other advanced machine learning techniques beyond those utilized in this research (e.g., Support Vector Machines, Random Forests) to ascertain their effectiveness in predicting PowerSchool usage. This comparison could shed light on the most suitable predictive modeling technique.
- Longitudinal Data Analysis: Utilize longitudinal data to observe how changes in student attributes over time influence PowerSchool usage. Long-term trends and patterns could reveal a more comprehensive understanding of student engagement dynamics.
Implementing these recommendations in future studies can enhance our understanding of the interplay between student attributes and PowerSchool usage, potentially improving the accuracy of predictive models. This refinement could optimize PowerSchool’s data analytics, evaluating its effectiveness in upgrading PowerSchool Pro tools.
REFERENCES
- Alharbi, Zahyah & Cornford, James & Dolder, Liam & Iglesia, Beatriz. (2016). Using data mining techniques to predict students at risk of poor performance. 523-531. 10.1109/ SAI.2016.7556030.
- Asim, Nadia & Almawaali, Shahad & Yusuf, Lamiya & Sarmi, Al & Alyakoobia, Jamila & Malali, Puttaswamy. (2018). Parental Involvement: A Proof of Concept Study at MEC. 10.13140/RG.2.2.15757.77287.
- Bird, Ken. (2006). Student Information Systems: How Do You Spell Parental Involvement? S-I-S. T.H.E. Journal.
- Dries, Shannon D. (2014). The influence of Parent Portal Access on Student Efficacy and Parental Involvement” (2014). Seton Hall University. Dissertations and Theses (ETDs). 2076. https://scholarship.shu.edu/dissertations/2076
- Gurkut, Cannur & Cemal Nat, Muesser. (2017). Important Factors Affecting Student Information System Quality and Satisfaction. Eurasia Journal of Mathematics, Science and Technology Education. 14. 10.12973/ejmste/81147.
- Hussain, Sadiq & Gaftandzhieva, Silvia & Maniruzzaman, Md & Doneva, Rositsa & Muhsin, Zahraa. (2021). Regression analysis of student academic performance using deep learning. Education and Information Technologies. 26. 10.1007/s10639-020-10241-0.
- Huynh-Cam, Thao-Trang, Long-Sheng Chen, and Huynh Le. 2021. “Using Decision Trees and Random Forest Algorithms to Predict and Determine Factors Contributing to First-Year University Students’ Learning Performance” Algorithms 14, no. 11: 318. https:// doi.org/ 10.3390/a14110318
- Ibrahim, Zaidah & Rusli, Daliela. (2007). Predicting Students’ Academic Performance: Comparing Artificial Neural Network, Decision Tree and Linear Regression. 21st Annual SAS Malaysia Forum.
- Kaspi, Samuel, and Sita lakshmi Venkatraman. (2023). “Data-Driven Decision-Making (DDDM) for Higher Education Assessments: A Case Study” Systems 11, no. 6: 306. https:// doi.org/10.3390/systems1106030
- H. A. Mengash, “Using Data Mining Techniques to Predict Student Performance to Support Decision Making in University Admission Systems,” in IEEE Access, vol. 8, pp. 55462-55470, 2020, doi: 10.1109/ACCESS.2020.2981905.
- Mohamad, Siti & Tasir, Zaidatun. (2013). Educational Data Mining: A Review. Procedia – Social and Behavioral Sciences. 97. 10.1016/j.sbspro.2013.10.240.
- Muraina, Ismail & Aiyegbusi, Edward & Abam, Solomon. (2023). Decision Tree Algorithm Use in Predicting Students’ Academic Performance in Advanced Programming Course. International Journal of Higher Education Pedagogies. 3. 13-23. 10.33422/ijhep.v3i4.274.
- Mojares, Juvy. (2022). PowerSchool SIS Powers up!. Trust Radius Insights. Online. https:// www.trustradius.com/reviews/powerschool-student-information-system-2022-04-11-20-10-57
- Ngoma, Sylvester (2009). An Exploration of the Effectiveness of SIS in Managing Student Performance. https://files.eric.ed.gov/fulltext/ED507625.pdf
- Ngoma, Sylvester (2010). Improving Student Learning: A Strategic Planning Framework for an Integrated Student Information System for Charlotte-Mecklenburg Schools.
- Park, S., & Choi, J. (2015). Factors influencing smartphone usage and consumption recovery: The mediating roles of goal conflict and self-control. Cyberpsychology, Behavior, and Social Networking, 18(6), 350-356.
- PowerSchool, “2022 PowerSchool K-12 Talent Index: Education Research Report,” PowerSchool (2022): online, Internet, 15 June 2022. Available: https://www. power school. com/whitepaper/2022-powerschool-k-12-talentindex-education-research-report/
- Powerschool (2022). Education Focus Report: Top District Priorities and Shifts in PK-12 Education District Leader Considerations for School Year 2022-23. powerschool.com/edtech-focus-report-2022/
- Sami, Noor & Najjar, Noor & Al-jammali, Karrar. (2023). Prediction and Evaluation of Students’ Performance in E-Learning Using Data Mining Algorithm. 3. 488-491.
- Saqr, Mohammed & Fors, Uno & Tedre, Matti. (2017). How learning analytics can early predict under-achieving students in a blended medical education course. Medical Teacher. 39. 1-11. 10.1080/0142159X.2017.1309376.
- Yilmaz, Ercan & Jafarova, Gulnar. (2022). RESEARCH ON EDUCATION AND PSYCHOLOGY (REP) Development of Data Driven Decision Making Scale: A Validity and Reliability Study. 69-91.
- Zhang, Yupei & Yun, Yue & An, Rui & Cui, Jiaqi & Dai, Huan & Shang, Xunqun. (2021). Educational Data Mining Techniques for Student Performance Prediction: Method Review and Comparison Analysis. Frontiers in Psychology. 12. 10.3389/fpsyg.2021.698490.
- Blackmon, O.M. (2015). Underrepresented Minority Students in Four Urban School Districts: A Study of Technology Use and Student Academic Performance in Math Grades Four and Eight.
- S. Natek and M. Zwilling (2014) “Student data mining solution knowledge management system related to higher education institutions,” Expert Syst. Appl., vol. 41, no. 14.
- P. M. Arsad, N. Buniyamin, and J.-L.-A. Manan (2013) “A neural network students’ performance prediction model (NNSPPM),” in Proc. IEEE Int. Conf. Smart Instrum., Meas. Appl. (ICSIMA), Kuala Lumpur, Malaysia.


