
Performance Evaluation of Greases Produced from Wild Melon and Calabash Seeds
- F.A. Idoko
- E. Barki
- D.A. Ogenyi
- 2464-2478
- Apr 20, 2024
- Education
Performance Evaluation of Greases Produced from Wild Melon and Calabash Seeds
F.A. Idoko, E. Barki, D.A. Ogenyi
Department of Mechanical Engineering, Benue State Polytechnic, Ugbokolo, Nigeria
DOI: https://dx.doi.org/10.47772/IJRISS.2024.803173
Received: 29 February 2024; Revised: 12 March 2024; Accepted: 16 March 2024; Published: 20 April 2024
ABSTRACT
In this study titled ‘Performance Evaluation of Greases Produced from Wild Melon and Calabash Seeds’ oil seeds from wild melon and calabash were investigated as base oils for the production of greases. The oil seeds were oven dried to moisture contents of 12.5 % and11.1 % for calabash seeds and wild melon seeds respectively. The oils were extracted using solvent method. The percentage oil yields were 56.3 and 55.2 % for wild melon and calabash seeds respectively. Chemo-physical properties like flash point, free-fatty acid, viscosity index, and pour point of the oils proved that they are all suitable for the production of greases. The aim of this work was to produce greases from renewable raw materials that are environmental friendly and to improve upstream agricultural activities and provision of employment. The greases were prepared using Nailen and Yeong method. The greases produced were evaluated. Analysis of the produced greases showed that there was a gradual drop in viscosity with increase in temperature. It is recommended that greases produced using natural oil seeds like wild melon and calabash seeds be used as alternative to petroleum base grease. This is because the base oils are from renewable source, are less volatile and have high free fatty acid content.
Keywords: Evaluation of greases, grease lubricant, Melon and Calabash seeds.
INTRODUCTION
Lubrication is the process, or technique employed to reduce wear of one or both surfaces in close proximity, and moving relative to each other, by interposing a substance called lubricant between the surfaces to carry or to help carry the load (pressure generated) between the opposing surfaces. Adequate lubrication allows smooth continuous operation of equipment, with only mild wear, and without excessive stresses or seizures at bearings [1].
Wear leads to surface damage that involves a progressive loss of material and affects the lifetime of several mechanical elements such as gears and rolling element bearings [2]. Rolling contact wear (RCW) is a particular type of wear that results from the repeated mechanical stressing of the surface of a loaded body rolling against another [3]. To improve RCW life, lubrication is often employed. A lubricant film that aims to keep them sufficiently apart to prevent asperity contact separates the contacting surfaces. Among the most commonly used lubricants are greases, which provide low friction, are easily confined and have a long lubricating time at a low cost.
Burning generates both airborne pollutants and ash rich in toxic materials, mainly heavy metal compounds. Thus lubricant burning takes place in specialized facilities that have incorporated special scrubbers to remove airborne pollutants and have access to landfill sites with permits to handle the toxic ash. Unfortunately, most lubricants that end up directly in the environment are due to general public discharging. Lubricants contain 90% base oil (most often petroleum fraction. Lubricants are essential and ease movements. When lubrication breaks down, metal or other components can rub destructively over each other, causing damage, heat and failure [4].
Petroleum-containing industrial wastes and petroleum products lost during processes (losses) are quantitatively and qualitatively basic environmental pollutants —of water, soil, and air. Some petroleum wastes from production and use of lubricants (greases, motor and industrial oils, etc.) are collected and regenerated. Wastes, which are not regenerated due to their physiochemical properties, are dangerous environmental pollutants [5]. When wastes (used oil or grease) are released into the soil, they are expected to quickly evaporate, or readily biodegrade or leach into the underground water; but when released into the air, the materials may be moderately degraded by photosynthesis or be removed from the atmosphere by wet disposition.
It is estimated that 40% of all lubricants are released into the environment. Unused lubricating grease is disposed of in accordance with all Federal, State and Local environmental regulations. In some cases, used oil recyclers will accept used grease. Some municipalities or industries hold household chemical disposal drives at which grease may be accepted. Depending on the service the grease has been in and contaminants to which it may have been exposed, used grease may be contaminated and considered to be hazardous waste and may require special handling for disposal. Used grease should not be re-used [6].
Disposal of used lubricants includes recycling, burning, landfill and discharge into water. There are typically strict regulations in most countries regarding disposal in landfill and discharge into water as even small amount of water. Most regulations permit a threshold level of lubricant that may be present in waste streams and companies spend hundreds of millions of dollars annually in treating their wastewaters to get acceptable levels. Burning the lubricant as fuel, typically to generate electricity is also governed by regulations mainly on account of the relatively high level of additives present. Burning generates both airborne pollutants and ash rich in toxic materials, mainly heavy metal compounds. Thus lubricant burning takes place in specialized facilities that have incorporated special scrubbers to remove airborne pollutants and have access to landfill sites with permits to handle the toxic ash. Unfortunately, most lubricants that end up directly in the environment are due to general public discharging onto the ground, into drains and directly into landfills as trash. Other direct contamination sources include runoff from roadways, accidental spillages, natural or man-made disasters and pipeline leakages. Improvement in filtration technologies and processes has now made recycling a viable option (with rising price of base stock and crude oil). Typically various filtration systems remove particulates, additives and oxidation products and recover the base oil. The oil may get refined during the process. This base oil is then treated much the same as virgin base oil however there is considerable reluctance to use recycled oils as they are generally considered inferior. Base stock fractionally vacuum distilled from used lubricants has superior properties to all natural oils, but cost effectiveness depends on many factors. Used lubricant may also be used as refinery feedstock to become part of crude oil. Again there is considerable reluctance to this use as the additives, soot and wear metals will seriously poison/deactivate the critical catalysts in the process. Cost prohibits carrying out both filtration (soot, additives removal) and re-refining (distilling, isomerization, hydrocrack, etc.) however the primary hindrance to recycling still remains the collection of fluids as refineries need continuous supply in amounts measured in cisterns, rail tanks. Occasionally, unused lubricants require disposal. The best course of action in such situations is to return them to the manufacturer where they can be processed as part of fresh batches [7].
Lubricants both fresh and used can cause considerable damage to the environment mainly due to their high potential of serious water pollution. Further, the additives typically contained in lubricants can be toxic to flora and fauna. In used fluids the oxidation products can be toxic as well. Lubricants persistence in the environment largely depend upon the base fluid, however if very toxic additives are used they may negatively affect the persistence. Lanolin lubricants are non-toxic making them the environmental alternative, which is safe for both users and the environment [8].
Grease lubricant consists of oil and/or other fluid lubricant that is mixed with a thickener, a soap, to form a solid. Soap is a metallic salt of fatty acid, which forms an emulsion with oil. Greases are used where a mechanism can only be lubricated infrequently and where a lubricating oil would not stay in position. They also act as valuable sealants to prevent ingress of water and dust [9].
According to [10] the current trend in the production of grease is the use of base oil from petroleum source. Petroleum base stock for grease production is often scarce or expensive, not renewable and highly volatile. There is increased cost of exploitation and processing of mineral based lubricating oils, stringent environment regulation and dwindling reserves of petroleum crude. Petroleum (mineral) base grease is not biodegradable and causes upstream and downstream environmental pollution. It is toxic and can harm aquatic organisms. Free fatty acids (FFA) that forms metallic soaps with metal surfaces during lubrication of metals under boundary lubrication condition often encountered in metal work and to a large extent, in gear transmission system is very low with petroleum oils [11].
These actually have caused renewed and more intensive search for alternative, biodegradable and environmental friendly grease for engineering applications from short rotation plantation oil seeds that are regenerative and a veritable source of renewable oil seeds. Hence, this research works.
[12] defined oil seeds as varieties of lipids rich seeds, fruits, cereals, and nuts that are used in vegetable oils and fats for cooking, soap making, food manufacture, lubrication, fuels, paints and varnishes, and cosmetics among others. These oil seeds are products of many plants and each contains at least traces of lipids which are esters of fatty acid and glycerol.
Wild melon (citrus vulgare) is a short-rotation plantation crop widely cultivated in the southern and middle belt regions of Nigeria. It is an important crop popularly known in Nigeria as ‘egusi’ by most ethnic groups. The place of origin is not known with certainty, but the center of origin and distributions is believed to be Asia. The composition of melon seeds, their nutritional chemical and biological characteristics is well established [13].
The oil from wild melon requires varying degrees of purification, depending on the extraction process, type of pigments present and utilization [14]. In their study of the rheological behaviour of wild melon oil lubricant blended with transmission oil it was concluded that the seeds of wild melon contain 52- 57% oil and 34% protein. The oil is yellowish in colour with a pleasant odour.
The calabash or Bottle gourd is a vine grown for its fruit, which can either be harvested young and used as a vegetable or harvested mature, dried, and used as a bottle, utensil, or pipe. Calabash seeds contain about 45% oil.
This study is restricted to the performance evaluation comprising chemo physical properties analyses and Rheological behaviour of greases. Seeds of interest included wild melon seeds and calabash seeds. Oils extracted from the seeds of interest above are the base oils for the grease production.
MATERIALS AND METHODS
Materials
The following oil seeds were used for this work; Calabash and Wild Melon. These seeds were procured from open markets in Nasarawa and Benue states of Nigeria respectively. The oils were extracted using solvent method. These oil samples were blended. Each oil blend was used to produce grease.
Methods
Extraction and blending of oils
The seeds were broken and the oil seeds were collected. These oil seeds were dried properly, weighed, and cleaned to remove sand, dust, and other contaminants. The calabash seed oils and wild melon seed oils have similar extraction processes. The processed oil seeds were ground with a grinding machine. The finely ground grain were put into a clean new white cloth and tightened. The tightened cloth was put into a strong bucket. n – Hexane (a chemical/reactor) was poured on the tightened cloth until the cloth was submerged. The bucket was properly covered and left there for 24 hours. After 24hrs it was opened and kept under sun for 4 hours to enable n – Hexane to escape (evaporate). The extracted oil was then collected. The residue (chaff) was then weighted. The calabash oil and the wild melon oil were blended in equal ratio.
Characterization of the oil samples
The sample oils for this work were Calabash oil and wild melon oil and their blends. The characterisation was done using the following parameters with which base oil are identified as recommended by National Lubricating Grease Institute (NLGI):
Determination of flash point
10 ml of the sample was poured into a copper cup, a thermometer was secured to it and the sample was heated over a kerosene stove. A flame was passed over the surface of the sample at 5OC intervals and its temperature observed. The temperature at which the vapour ignited with an easily detected flash was noted and recorded as the flash point.
Determination of fire points
10ml of the sample was poured into a copper cup, a thermometer was secured to it and the sample was heated over a kerosene stove. A flame was passed over the surface of the sample at 5OC intervals and its temperature observed. The temperature at which the flame was sustained for five seconds was recorded as fire point.
Determination of cloud point
The cloud was determined in accordance with ASTM D-2500. 25 ml of each sample was poured into a measuring cylinder with a thermometer inserted into it and placed inside a refrigerator to cool and observed at intervals of 2 minutes. The temperature of first crystallization when the thermometer in the samples was no longer visible was observed and recorded as the cloud point of the sample.
Determination of pour point
The pour point of the samples was determined in accordance with ASTM D-97. 25 ml of each sample was weighed into a measuring cylinder of 25ml capacity and cooled in a refrigerator with a thermometer secured in place. The sample was observed at intervals of 2 minutes. The temperature at which wax became visible or at which the sample gelled was recorded as the pour point of the sample.
Determination of viscosity index
The value of viscosity index of the oil samples was determined by reading it off from a table specially constructed for the purpose as contained in viscosity index table for Celsius temperature given in ASTM data series. The value of the kinematic viscosity of the oil sample at 1000C was located in the table and traced down to the value of the kinematic viscosity of the same oil at 400C and the value at the point of intersection represents the viscosity index of the oil sample.
Manufacture of Greases
The greases for this work were prepared according to [15] method using the following three steps.
- Soap preparation (saponification process)
Stearic acid (C17H35 – COOH) was heated in an iron pot with aqueous sodium hydroxide at 110oC until the fat dissolved. The mixture was stirred and heated to form soap. The aqueous sodium hydroxide was a solution of 1 cup of caustic soda (sodium hydroxide) and 4 cups of water. The mixture was stirred vigorously at intervals for 24 hours until it became fermented chemical (aqueous sodium hydroxide).
- Dehydration and condition of soap
The reaction mixture (soap) was further heated to 200oC for 35 to 40 minutes to dehydrate the soap.
- Incorporation of base oil and additive
The soap which is the thickener was cooled to 180oC and held at this temperature while the base oil was added. That formed the grease. The grease was further cooled to 120OC with stirring and finally left to cool to room temperature after which the additive was added to the cooled grease.
C17H35COOH + NaOH ——- C17H35COONa + H2O (1)
Stearic acid sodium stearate
Analysis of grease samples
The following tests were carried out to analysis the grease samples:
Determination of dropping point of lubricating grease over wide temperature range.
This test was carried out in accordance with ASTM D – 2265 using aluminium block oven equipment.
The dropping point temperature was calculated using equation 2
Dpt = T1 + (T2-Dpt)/3 (2)
Where; Dpt is the dropping point of grease sample, T1 is the thermometer reading when the first drop reaches the bottom of the test tube, and T2 is the block temperature when the drop falls.
Determination of apparent viscosity of grease samples
The apparent viscosity of the grease samples was determined according to the ASTM method D-1092. The apparent viscosity was calculated as;
Vab = Ctab (3)
Where; Vab s the determined apparent viscosity value for Va and Vb respectively (mm2/s), C is the calibrated constant of the viscometer (mm2/s), Tab is the measured flow time ta and tb respectively. Then, the apparent viscosity result, V is the average of Va and Vb.
Viscosity temperature coefficient (VTC)
The apparent viscosity coefficient was evaluated using equation 4
VTC = (Apparent viscosity at 400C – Apparent viscosity at 1000C)/(Apparent viscosity at 400C) (4)
Determination of the consistency (penetration) of the grease samples. This test was carried out using a penetrometer in accordance with ASTM D – 217.
Statistical Analysis
Multiple regression modeling
Regression model was formulated for predicting viscosity index, the formulated equation was;
VI=β0+β1 X1+β2 X2+β3 X3+β4 X4+β5 X5+β6 X6+β7 X7+β8 X8+β9 X9+E (5)
Where VI is the viscosity index, X1 –X9 are the inputs (predictors); and E and ∈ are the errors between the predicted and experimental viscosity index.
x1 is the thickener used;
x2 is additives used,
x3 is the Free-fatty acid,
x4 is the density
x5 is the cloud point
X6 is the viscosity temperature coefficient
X7 is mechanical stability
X8 is the kinematic viscosity at 100oC
X9 is the penetration
A programme for multiple regressions using the reglin function as shown in Plate 1 is written and executed in the SCILAB environment to evaluate the coefficients β0, β1,β2,β3,β4,β5,β6,β7,β8 and β9. These coefficients were then substituted in equations (5) to give the formula for the prediction of viscosity index.
x1=[70 50 65 70 100 80 120 200 140 180]
x2=[12 18 20 20 25 40 30 26 30 40]
x3=[3.4 3.4 2.6 2.82 3.5 3.7 3.8 3.4 4.0 4.2]
x4=[0.0879 0.909 0.875 0.925 0.885 0.881 0.890 0.890 0.910 0.900]
x5=[13 8 8 8 9 9 9 11 11 12]
x6=[0.2381 0.2400 0.2400 0.2418 0.2265 0.2290 0.2274 0.2288 0.227 0.228]
x7=[35 40 30 45 40 41 32 45 39 40]
x8=[21 71 65 50 111 109 109 108 108 108]
x9=[179 270 315 235 230 325 185 360 360 190]
y= [70 236 216 165 370 362 362 358 356 358]
X=[x1; x2; x3; x4; x5; x6; x7; x8; x9];// create matrix x from the nine rows
[a, a0, sigma]=reglin (X,y);// perform a multiple regression analysis of y as a function of x1, x2, x3, x4, x5, x6, x7, x8 and x9
ypred = a0 + a(1)*x1 + a(2)*x2 + a(3)*x3 + a(4)*x4 + a(5)*x5 + a(6)*x6 + a(7)*x7 + a(8)*x8 + a(9)*x9;// fitted data
filename = myreglindir + basename(myfile) + “-plot.png”;// create filename from basename of file
xs2png(wn, filename);// save graphic in PNG format
result = [“a0” “a(1)” “a(2)” “a(3)” “a(4)” “a(5)” “a(6)” “a(7)” “a(8)” “a(9)”];// first row of data
result(2,:) = string([a0 a]);// convert coefficients to string for export
result(:,$) = result(:,$) + “\\\ hline”;//add end of line commands for LaTex table
filename = myeeglindir + basename(myfile) + “text”;// filename for saving results
csv Write(result, filename, “&”);// use “&” to separate the colums
Plate 1: Programme code for the prediction of Viscosity index.
RESULTS AND DISCUSSION
Extraction of Oils
The results in Table 1 show that wild melon seeds yielded 56.3% oil and calabash seeds yielded 55.2% oil. The seeds of wild melon generally contain 52-57% oil [16] therefore; the result of 56.3% in Table 1 is in order. This proves that calabash seeds do not contain much oil unlike wild melon seeds.
Characterization of the Seed Oils
The results of the characterization of the oils and blends are presented in Table 2. The calabash oil produced the highest flash point of 3100C, followed by wild melon oil of 2600C and the blend 1200. Flash points indicate the temperature at which a lubricant gives off sufficient vapour to form a flammable mixture with air. Oil with high flash point withstands high temperature operations. This means that such oil is safer to handle and be moved from place to place. In this study calabash oil is safer to handle than wild melon oil and the blend oil. This is because the calabash oil is less volatile than and the wild melon oil and blend oils.
The fire points of calabash oil, wild melon oil, and the blend in this study are 3500C, 3250C, and 2500C respectively as seen in Table 2. Since fire point is the lowest temperature that particular oil will sustain burning for five seconds, blend oil with fire points of 2500C have the ability to ignite flame easily and sustain burning for five seconds more than calabash and wild melon oils. That mixture stands the best oil sample, though higher than the minimum recommended ASTM value of 1000C.
The free fatty acids (FFA) values of the pure oils (S1and S2) are 3.4% and 2.6% respectively and the blend 3.7%. High free-fatty acids content of the seed oils favours the production of grease as it reacts with metals to form soap. This means that that the blend oil is the better than any of the pure oils in agreement with [17].
Table 3 shows the results of viscosity index of the sample oils. From the table, S2 (wild melon oil) has a viscosity index of 215, which is higher than the other sample oils. The high number, 215 could mean that the oil was highly refined and pure. According to [18], oils with higher viscosity index will remain stable and not vary much in viscosity over the temperature range, which allows for consistent engine performance within the normal working conditions. This means that wild melon oil is the best sample oil for lubrication and also good for grease manufacture. Generally, all the sample oils are suitable for lubricants because they are within the acceptable range of minus 60 to over 400 as reviewed [19].
The pour points of the sample oils are 100C and 200C S1 and S2 respectively. The pour point of the blend is 160C (S3). The lower the pour points the better the ability of the oil to withstand extreme cold conditions. Such oil lubricates better in temperate region and transverse across regions without been affected by cold climates. It will have an easier start up than those with higher pour points. From the results therefore, calabash oil (S1) with the lowest pour point of 100C is better than others to withstand cold condition and therefore could act as good base oil for grease to be used under extreme cold temperature condition. Pour point is an indication of flow of oils. That is why calabash oil at low pour point temperature is better for cold condition.
Analysis of Grease properties
The results of the viscosity temperature coefficient of the grease samples are shown in Table 4. The values are 0.2381, 0.2400 and 0.2290 for S1, S2 and S3 respectively. The smaller the viscosity temperature coefficient, the smaller the relative change in viscosity with temperature. The smaller the relative change in lubricant viscosities with temperature, the better the performance of the lubricant when subjected to great temperature changes experienced in practice. The lower the viscosity temperature coefficient is inversely proportional to viscosity index. It follows that calabash blended with melon base grease (s3) with the least viscosity temperature coefficient is the best among the three grease samples produced. It is less sensitive to temperature change.
The dropping point of soap-thickened lubricating grease is the temperature at which it passes from a semi-solid to a liquid state under specific conditions. It is an indication of the type of thickener used, and a measure of the cohesiveness of the oil and thickener of grease. It is used to determine the suitability of greases for specific applications. From Table 5, calabash oil grease (s1) has a dropping point of 1700C, S2 has a dropping point of 1680C and S3 has a dropping point of 1700C. Looking at the results, the dropping point of the grease samples are relatively the same and so each of the oils or the blend could be recommended for use to produce grease.
Table 6 shows the penetration depth of the grease samples. Penetration goes with consistency of grease. The penetration depth is inversely proportional to the consistency number. S1 with penetration depth of 179 has consistency number 4 and stiff in nature. S2 and S3 with penetration depths of 315 and 325 respectively have the same consistency number 1 and are soft in nature. Greases with consistency number of zero (0) are said to be very soft or semifluid. Such grease does not have ‘stay put’ property. Such grease runs-off the lubricating surfaces, hence have poor lubricating properties. S1with stiff nature may take longer time for the base oil to breed out for lubrication.
According to Machinery Lubrication Guide [20], the most common NLGI grade is two (2), which is recommended for most applications. However, all the grease samples produced can be recommended for engineering applications.
Generally, one of the functions of the thickener (the metallic soap) is to hold the lubricating oil in a semi- solid state for easier handling. When there is rise in temperature, the oil bleeds out from the thickener and functions as a lubricating agent, and when the temperature drops again, the thickener soaks up the oil to become semi-solid once more. Grease such as (S1) cannot effectively be used under cold condition, especially during start-up condition.
Multiple Regression Modeling
Table 7 shows the predicted and experimental viscosity index. Table 8 shows regression coefficients for the multiple regressions using Reglin Function. Inside the table are values for viscosity index of the grease samples. Table 9 shows the predicted and experimental viscosity index of the grease samples… Figure 1 shows comparison of experimental and predicted viscosity index. Figure 2 shows correlation of experimental and predicted viscosity index and Figure 3 shows the correlation of predicted and experimental viscosity index using multiple regressions.
The test RMSE provides information on the short-term performance of the studied model as it allows a term by term comparison of the actual deviation between the predicted value and measured value. [21] Recommended that a zero value for MBE is ideal and low RMSE is desirable.
The multiple regression equation was developed for prediction of viscosity index (VI);
VI = -110.981 – 0.0234X1 – 0.0385X2 – 3.1678X3 – 7.9171X4 – 0.6652X5 + 474.14X6 + 0.0565X7 + 3.5168X8 – 0.0158X9 + 3.49×10⁻¹²
This equation was used to predict the values of viscosity index presented in Table 9. The Table also showed statistical analysis for the validation of the model such as Mean bias error (MBE) and Nash-Scutcliffe efficiency (NSE). As shown in Table 8 the regression coefficients for, cloud point, viscosity temperature coefficient, mechanical stability and kinematic viscosity at 100oC, gave positive indicators while those of thickener, additives free-fatty acid, density and penetration gave negative values for viscosity index. According to [22] negative values of a multiple regression constants implies that as the independent variables increased the dependent variable decreases; thus this implies that as the thickener, additives free-fatty acid, density and penetration increased viscosity index decreases while viscosity index increased with increase in cloud point, viscosity temperature coefficient, mechanical stability and kinematic viscosity at 100oC. The values of statistical indicators MBE, and NSE for validation of the multiple regression model for prediction of viscosity as shown in Table 9, show that the prediction of viscosity index employing the multiple regression model was satisfactorily with the values of, MBE, reasonably low, and NSE values reasonably high at almost all measured values and the overall error between the predicted and experimental values being 3.49 x 10⁻¹².
Figure 1 shows the visual assessment of the predicted and experimental viscosity index. The predicted values by multiple regression models matched with the experimental values. This was confirmed by the regression of the predicted and experimental viscosity index as shown on Figure 2. There was high correlation between the predicted and experimental with R2 of 1.0000 for viscosity index. Hence, the visual assessment as presented clearly showed that multiple regression model was successful in modelling the viscosity index. Correlation between experimental and predicted viscosity index is positive and high (r=0.96).
CONCLUSION
Based on the results of the analysis carried out the base oils and blends are suitable for the production of greases that are bio-degradable and that the greases produced are suitable for engineering applications. These greases can be used as an alternative to petroleum base grease.
RECOMMENDATIONS
From the studies carried on the topic titled: Performance evaluation of greases produced from wild melon and calabash seeds, the following recommendations are given:
- Other renewable oil bearing plants should be explored;
- Tests such as friction at low temperatures, running at high temperatures and high speeds, quiet running behavior, lubrication film load capacity etc. which could not be carried out in this work because of lack of equipment are equally important and should be carried out for further work
- Rheological Evaluation such as viscosity, shear stress and shear strain of Grease Samples should be carried out for further work.
Table 1: Percentage Oil Yield
| Seeds | Quantity used (kg) | Quantity of oil extracted (kg) | Percentage oil yield |
| Wild melon | 8.0 | 4.5 | 56.3 |
| Calabash | 10.5 | 5.8 | 55.2 |
% moisture content for calabash seeds = 12.5, % moisture content for wild melon seeds = 11.1
Table 2: Characterization of Seed Oils and Blend
| Properties | S1 | S2 | S3 |
| Flash point (0C) | 310 | 260 | 120 |
| Fire Point (0C) | 350 | 325 | 200 |
| Free fatty acid % | 3.4 | 2.6 | 3.7 |
| Kinematic viscosity@400C | 89 | 275 | 460 |
| Kinematic viscosity@1000C | 21 | 65 | 109 |
| Pour point (0C) | 10 | 20 | 17 |
S1 = Calabash oil, S2 = Wild melon oil, S3 = mixture of Calabash oil & wild melon oil (1:1)
Table 3: Characterization of Sample Oils and Reference Oil
| Properties | S1 | S2 | S3 | Ref |
| Flash point (0C) | 310 | 260 | 120 | 270 |
| Kinematic viscosity@1000C | 21 | 65 | 50 | 38.5-42.5 |
| Pour point (0C) | 10 | 20 | 17 | -9 |
| viscosity index | 155 | 215 | 212 | 95 |
Table 4: Apparent Viscosities of Sample Greases at 400C and 1000C and their Viscosity Temperature Coefficients
| Sample | Apparent | Viscosity | Viscosity Temperature |
| @ 400C | @1000C | Coefficients | |
| S1 | 147 | 112 | 0.2381 |
| S2 | 350 | 266 | 0.2400 |
| S3 | 345 | 266 | 0.2290 |
Table 5: Analysis of Grease Properties
| Properties | S1 | S2 | S3 |
| Penetration@ 250C (10ths of mm) | 179 | 315 | 325 |
| Dropping point | 170 | 168 | 170 |
| Apparent viscosity (Cp) @ 400C | 147 | 350 | 345 |
| Apparent viscosity (Cp) @ 1000C | 112 | 266 | 266 |
Table 6: Penetration of Grease Samples
| Sample | Penetration (mm) | NLGI consistency no. | Nature of grease |
| S1 | 179 | 4 | Stiff |
| S2 | 315 | 1 | soft |
| S3 | 325 | 1 | Soft |
| Ref. grease | 230 | 3 | medium |
Table 7: Predicted and Experimental Viscosity index
| S/N | Experimental Viscosity index | Predicted Viscosity index | NSE | RMSE | NMSE | MBE |
| 1 | 70 | 69 | 1.0000 | 0.3160 | 1.0×10⁻⁶ | -1.0000 |
| 2 | 236 | 238 | 0.9980 | 0.6320 | 4.0×10⁻⁸ | 2.0000 |
| 3 | 216 | 216 | 1.0000 | 0.0000 | 0.0000 | 0.0000 |
| 4 | 165 | 168 | 0.9999 | 0.9490 | 1.05×10⁻⁵ | 3.0000 |
| 5 | 370 | 370 | 1.0000 | 0.0000 | 0.0000 | 0.0000 |
| 6 | 362 | 362 | 1.0000 | 0.0000 | 0.0000 | 0.0000 |
| 7 | 362 | 360 | 0.9985 | 0.6320 | 1.0×10⁻⁶ | -2.0000 |
| 8 | 358 | 361 | 0.9999 | 0.9490 | 1.05×10⁻⁵ | 3.0000 |
| 9 | 356 | 259 | 0,9985 | 0.9490 | 1.05×10⁻⁵ | 3.0000 |
| 10 | 358 | 358 | 1.0000 | 0.0000 | 0.0000 | 0.0000 |
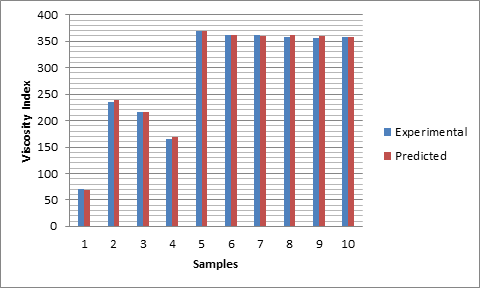
Figure 1: Comparison of experimental and predicted viscosity index
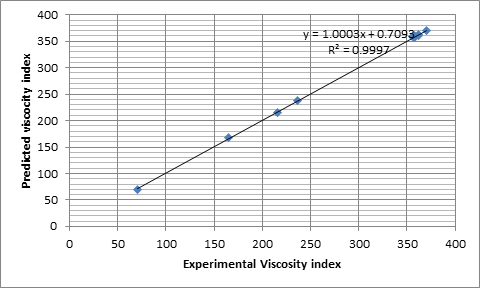
Figure 2: Correlation of predicted and experimental viscosity index.
Table 8: Regression Coefficients for the Multiple Regression using Reglin Function
| S/N | COEFFICIENT VALUE FORVISCOSITY INDEX |
| β0 | -110.981 |
| β1 | -0.0234 |
| β2 | -0.0385 |
| β3 | -3.1678 |
| β4 | -7.9171 |
| β5 | 0.6652 |
| β6 | 474.145 |
| β7 | 0.0565 |
| β8 | 3.5168 |
| β9 | -0.0158 |
Table 9: Predicted and Experimental Viscosity index
| S/N | Experimental
Viscosity Index |
Predicted
Viscosity index |
MBE | NSE |
| 1 | 70 | 70 | 0.000 | 1.0000 |
| 2 | 236 | 234 | -0.300 | 0.9887 |
| 3 | 216 | 216 | 0.0000 | 1.0000 |
| 4 | 165 | 164 | -0.1000 | 0.9987 |
| 5 | 370 | 370 | 0.0000 | 1.0000 |
| 6 | 362 | 362 | 0.000 | 1.0000 |
| 7 | 362 | 362 | 0.0000 | 1.0000 |
| 8 | 358 | 358 | 0.0000 | 1.0000 |
| 9 | 356 | 356 | 0.0000 | 1.0000 |
| 10 | 358 | 358 | 0.0000 | 1.0000 |
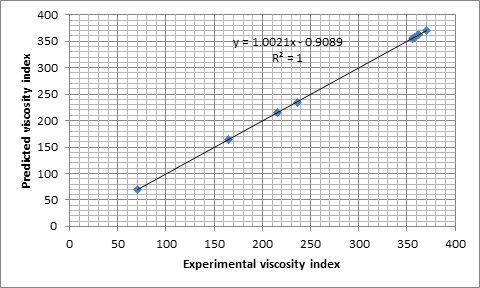
Figure 3: Correlation of Predicted and Experimental Viscosity Index using Multiple Regressions
REFERENCES
- F.A. Idoko, M.I. Oseni, and L.T. Tuleun, Artificial Network Prediction of Viscosity Index and Specific Heat Capacity of Grease Lubricant Produced from Selected Oil Seeds and Blends, American Journal of Engineering Research,6(3), 2017, p-SSN: 2320-0936, 176-181
- F.A. Idoko, J.M. Onuh, and C. Ogbole (2019), Multiple Regression Model for the Prediction of Mechanical Stability of Grease Lubricant Produced from Selected Oil Seeds and Blends, Benue Polytechnic Journal of Engineering, 1(2), 2019, ISSN: 2682- 6186, 12-19
- V. Mota and L.A.Ferreira, Influence of Grease Composition on Rolling Contact Wear: Experimental Study, Tribology International Journal, 42(4), 2010, ISSN: 2682-6186, 37- 45
- M.I Oseni., A.O. Ette and, E.E. Nnuka, (2006) Comparative Analysis of Rheology of Straight and Blended Oil Lubricants, Journal of Engineering and Applied Sciences, 2(2), 2006, 83-88
- G.E Totten, Handbook of Lubrication and Technology. 1(1), 2006, ISBN: 0-8493-2095- X.
- D. Turner and M. Moon, NLGI, (https://www.nlgi/faqs.lubricating-grease), 2013
- J.-M. Bouvet, Near Infrared Spectroscopy for High-Throughput Characterization of Shea Tree (Vitellaria paradoxa) Nut Fat Profiles, Journal Of Agricultural and Food Chemistry, 5(8), 2010, 7811-7819.
- I.A. Inman, Compacted Oxide layer Formation under Conditions of Limited Debris Retention at the Wear Interface during High Temperature Sliding Wear of Super Alloys (http://en.wikipedia.org/wiki/lubricant), 2009
- P. Onoja and L. Imgbian, Analysis of Grease Produced from Selected Natural Oil Seeds. Benue Polytechnic Journal of Engineering, 4(1), 2021, ISSN: 2682-6186, 37-45
- V.V. Ostrikov,. and E.V.Smokyakova, Production of Greases from Industrial Petroleum Wastes, Journal of Chemistry and Technology of Fuel and oils springer New York. 2007, 281-283.
- G. Salvator, Jr., Determination of Performance Characteristics of Local Oils as Lubricants, Nigerian Journal of Engineering, 2007, 4(2), 17-22.
- H. C. Olisakwe, Comparative Study of Thevetia Peruviana Jatropha Curcas Seed Oils as Feed-stock for grease production, M.Eng. Thesis, Department of Mechanical Engineering, University of Agriculture, Makurdi, Nigeria, 2011, 163
- A.A. Onogu, M.I. Oseni, and A. Ashwe, Artificial Neural Network Prediction of Viscosity Index and Pour Point of Some Bio Lubricants from Selected Oil Plants, International Journal of Applied Information Systems, Foundation of Computer Science FCS, New York, USA, 2016, ISSN: 2249-0868, 10(10), 23-27
- I.A. Njiribeako, and C.I.O. Kamalu, Manufacture of Grease, International Research Journal in Engineering, Science and Technology, 2004, 1(3), 36-42.
- S. K Yeong,., P.F. Luckham, and T.F.Tadros, (2004). Steady Flow and Viscoelastic Properties of Lubricating Grease containing various Thickener Concentrations, Journal of Colloid and Interface Science, 2004, 274(1), 285-293.
- M.I. Oseni, and S. Nuhu, Rheological Behaviour of Wild melon lubricant blended with transmission oil, Nigerian Journal of Mechanical Engineering, 2006, 4(1), 95-107
- Oinu and A.P. Onyilo, Characterization of Natural Oil as Base Oils for Grease Production, Benue Polytechnic Journal of Engineering, 4(1), 2021, ISSN: 2682-6186, 27-36
- D. Gunstone, J.I. Harwood, and A.J. Dijkstra, The Lipid Handbook. 3rd Edition, New York, Chapman Hall, 2007, 67-92.
- Jim, Don’t Ignore Viscosity Index when Selecting a Lubricant. http://www.machinerylubrication.com/Articles/Print/28956, 2012.
- Machinery Lubrication Guide, Step- by- Step Grease Selection. http://www.machinerylubrication.com/Articles/print/798, 2015.
- O. Falayi, J.O. Adepitan,A.B. Rabiu, (2008). Empirical models for the correlation of global solar radiation with meteorological data for Iseyin, Nigeria, The Pacific journal of science and Technology, 2008, 9(2), 583-591.
- Vlachogianni, P. Kassomenos, A. Karppinen, S. Karakitsios, J. Kukkonen, Evaluation of a Multiple Regression Model for Forcasting the Concentrations of NOx and PM10 in Athens and Helsinki, Science of the Total Environment, 2011, 409, 1559-1571.