Does Enterprise Risk Management Improve Performance and Create Shareholder Value? Empirical Evidence of Listed Firms on the Ho Chi Minh Stock Exchange, Vietnam
- Phan Thi Anh Nguyet
- 3073-3090
- Jul 23, 2024
- Economics
Does Enterprise Risk Management Improve Performance and Create Shareholder Value? Empirical Evidence of Listed Firms on the Ho Chi Minh Stock Exchange, Vietnam
Phan Thi Anh Nguyet
School of Economics, Can Tho University, Can Tho, Vietnam
DOI: https://dx.doi.org/10.47772/IJRISS.2024.806233
Received: 31 May 2024; Accepted: 22 June 2024; Published: 23 July 2024
ABSTRACT
This study applies Agency Theory, Stakeholder theory, and Modern Portfolio Theory, which revolves around the way enterprises are organized, managed, and controlled and guides the managers’ decisions in ensuring stability and creating value based on satisfying the interests of stakeholders, to analyze the impact of enterprise risk management implementation on the firm’s performance and value creation of 285 listed firms on the Ho Chi Minh Stock Exchange, Vietnam, from 2017 to 2022. Feasible Generalized Least Squares (FGLS) estimation results show that risk management practices positively affect firm value and business performance. In addition, the study also indicates that the variables of Big 4 auditor, inspection committee presence, sales growth, firm age, firm size, and leverage have affected firm performance and value differently. The findings have several implications for investors, managers, and researchers.
Keywords: enterprise risk management, firm value, firm performance
INTRODUCTION
The world economy is experiencing a difficult and volatile period because of the COVID-19 pandemic. The areas of change over the next decade will affect how organizations, from SMEs to large corporations to public sector bodies, seek to deliver long-term, sustainable value. This is compounded by the significant challenges the growing environmental emergency presents. These changes will impact and shape the organization’s implementation management tools to navigate these challenges. COSO (2004) stated that Enterprise Risk Management (henceforth ERM) helps management align risk appetite and strategy, providing a better response to risk, integrating the view of risk management, enhancing corporate governance, reducing operational surprise and losses, seizing opportunities, and reducing unacceptable performance variability. ERM has become an increasingly popular business strategy in enterprises. Firms usually employ it to evaluate their risk attitude, identify and prioritize their risks, and determine which risks should be accepted, mitigated, or avoided. Implementing ERM aims to achieve the company’s business objective and enhance value creation (Nocco & Stulz, 2006). Understanding the benefits mentioned, many firms make efforts to approach ERM. However, the effects of ERM practice on firm performance and shareholder value are still controversial among researchers and administrators.
In general, theoretical and empirical studies have provided evidence of the relationship between ERM implementation, performance, and the value of companies. The relationship may differ depending on each country’s economic characteristics and the specific characteristics of listed companies. Therefore, the former research results cannot be applied to all firms in different countries. This is a major limitation of the above studies. In addition, this is a relatively new topic in Vietnam. Therefore, this study was conducted to (i) examine the impact of the ERM system on the performance and value of companies listed on HOSE and (ii) propose governance implications for implementing an ERM system to enhance the performance and value of companies listed on HOSE.
This article is constructed as follows: Section two concentrates on the theories and literature reviews of the impact of ERM on firm performance and value. All the data used and research models are described in Section Three. The main results and analysis discussions are presented and discussed in Section Four. The final section presents some main conclusions and suggested policies.
THEORIES AND LITERATURE REVIEWS ON THE IMPACT OF ERM ON THE FIRM PERFORMANCE AND VALUE
2.1 Theories
Modern Portfolio Theory (MPT) was discovered in 1952 by Markowitz, who argued that the portfolio problem is a choice of the mean and variance of a group of assets (Elton & Gruber, 1997). This investment theory increases risk and trade-offs (Shad et al., 2019), commonly used in financial theory and practice (Fabozzi et al., 2002). The MPT asserts that enterprise-specific ERM is not valuable to stakeholders because shareholders can use asset allocation and diversification to minimize overall risk (Markowitz, Therefore, Markowitz (1952) argued that ERM does not create value for stock owners. Thus, all ERM practices are not implemented and have a negative net present value. According to the explanations of Beasley et al. (2008), the negative NPV project that occurs because the firm minimizes risk is typically based on the view that capital markets work without any constraints or shortcomings. When such impediments and shortcomings are introduced, the value creation of ERM is noticed (Horvey & Ankamah, 2020). The MPT used in this study is because the implementation of ERM uses resources wisely, helps select and manage the enterprise’s portfolio, and guides the managers’ decisions (Horvey & Ankamah, 2020).
Stakeholder theory is a fundamental theory that supports a company’s ethical business practices (Carroll, 1998). Stakeholder theory holds that the purpose of a business is to create as much value as possible for its stakeholders to remain successful and sustainable over time. In business, managers must keep the interests of employees and stakeholders aligned and move in the same direction (Albasu & Nyameh, 2017). Stakeholder theory covers three important aspects of economic, social, and environmental value creation (Wheeler et al., 2003). Therefore, ERM systems are often applied to stakeholder theory (Aziz et al., 2015). According to Shad et al. (2019), the benefits of this theory combined with modern portfolio theory to test the effect of integrating ERM implementation with sustainability reporting increase the economic added value of business activities. Taking the same view, Lim and Wang (2007) indicated that stakeholders can mitigate a firm’s systematic risk through financial hedging, which can increase investment.
Agency theory is a principle to explain and solve problems in the relationship between business owners and their agents. Disputed relationships are often between shareholders, management, and creditors because of income asymmetry, which can cause the company to take too much risk or not participate in projects. That is, to assist in explaining the disparity between management incentives and the interests of shareholders in the firm (Horvey & Ankamah, 2020), agency theory deals with two possible problems in the agency-manager relationship. The first is the problem when desires or goals between two conflicting parties and shareholders make verifying what management is doing difficult or costly. Second, the problem of risk sharing arises when they have different risk attitudes. While owners may require higher risk for a high return on investment, managers expect low risk and a low return on investment (Smith & Stulz, 1985). According to Smith and Stulz (1985), the agency theory of ERM has greatly impacted managers’ attitudes toward risk-taking and hedging behavior. Moreover, it highlights that ERM must engage shareholders and regulators in increasing corporate performance. Therefore, the impact of ERM as a governance tool to monitor the actions and decisions of managers to reduce the ERM costs of the regulator (Horvey & Ankamah, 2020).
2.2 Literature Review
Many domestic and international studies on ERM’s influence on firm performance and value exist. Kommunuri et al. (2016) used a sample of 199 companies in different industries listed on the Ho Chi Minh City and Hanoi Stock Exchanges. The linear regression (OLS) results showed that improving ERM practices will help businesses achieve their goals and improve the market’s perception of their company’s value. This is the first study that provides empirical evidence of the importance of ERM to corporate performance and corporate value in Vietnam. Similarly, the studies of Phan et al. (2020) and Anh & Hoa (2021) provided empirical evidence about the impact of ERM on Vietnamese corporate value. They found that ERM implementation has a potential effect on the performance and market valuation of the companies.
In addition, the results could be more consistent among researchers worldwide. Mohd Tahir Razali (2011) used Tobin’s Q as the dependent variable (firm value) to evaluate the impact of ERM on firm value and other factors of 528 listed companies in Malaysia. The OLS regression results show that firm value has a positive but insignificant relationship with ERM. Similarly, Lin et al. (2012) found that ERM implementation negatively correlates with firm value. They argue that in the early stages of ERM implementation, it can be difficult for investors to interpret the value of ERM and see it as an expensive program with low potential benefits. However, most studies support that firm value is greater for companies that apply ERM. Specifically, Hoyt Liebenberg (2011) estimated the relationship between ERM and firm value through a sample of 275 insurance companies between 1995 and 2005. The study used a maximum-likelihood treatment effects model to estimate the decision to engage in ERM and its effect on Tobin’s Q as a proxy for firm value. Factor estimation research indicated that insurers participating in ERM are valued approximately 20% more than other insurers. Bertinetti et al. (2013) investigated the impact of the application of the ERM system on the value of 200 large European companies and examined what factors determine this choice. The results showed that ERM increases business value in any industry. Iswajuni et al. (2018) studied manufacturing companies on the Indonesia Stock Exchange (IDX) with data from audited financial statements and annual reports from 2010–2013. The results from the multiple regression model showed that although the implementation of ERM in Indonesia was still small, it could prove that ERM had a positive impact on firm value. Later, Faisal et al. (2021) examined the mediating effects of investment decisions on the relationship between ERM and firm value of 215 companies listed on the Indonesian Stock Exchange (IDX) between 2017 and 2018. ERM and investment decisions positively influence firm value. They also found that investment decisions play a mediation role in the relationship between ERM and firm value.
DATA DESCRIPTION AND RESEARCH MODELS
3.1 Data Collection
The study employed secondary data sources of 1,710 observations with 285 firms listed on HOSE. Specifically, most data are collected from FiinPro, provided by FiinGroup Vietnam Joint Stock Company, accessed through the Learning Resources Center at Can Tho University. The missing values were added through financial websites such as www.vietstock.vn and the companies’ audited financial reports. To ensure consistency and reliability, the data of companies has to satisfy the following criteria: (1) having a full audited financial statement and annual report for the period 2017–2022, (2) non-banking, finance, and insurance enterprises, and (3) still listing on HOSE at the end of 2022.
3.2 Research Model
Based on the studies by Kommunuri et al. (2016), the models measuring the impact of ERM on the performance and shareholders’ value of Vietnam-listed firms on HOSE were built as follows:
(1) Effect of ERM practice on firms’ performance (ROA)
\[ \text{ROA}_{i,t} = \beta_0 + \beta_1 \text{FSize}_{i,t} + \beta_2 \text{Leverage}_{i,t} + \beta_3 \text{Growth}_{i,t} + \beta_4 \text{Fage}_{i,t} + \beta_5 \text{Audit}_{1,t} + \beta_6 \text{ERM}_{1,t} + \beta_7 \text{InspComm}_{i,t} + \epsilon_{i,t} \quad \text{(1)} \]
(2) Effect of ERM practice on firms’ value (Tobin’s Q)
\[ \text{Tobin’s Q}_{i,t} = \beta_0 + \beta_1 \text{FSize}_{i,t} + \beta_2 \text{Leverage}_{i,t} + \beta_3 \text{Growth}_{i,t} + \beta_4 \text{Fage}_{i,t} + \beta_5 \text{Audit}_{1,t} + \beta_6 \text{ERM}_{1,t} + \beta_7 \text{InspComm}_{i,t} + \epsilon_{i,t} \quad \text{(2)} \]
3.3 Variable Measurement
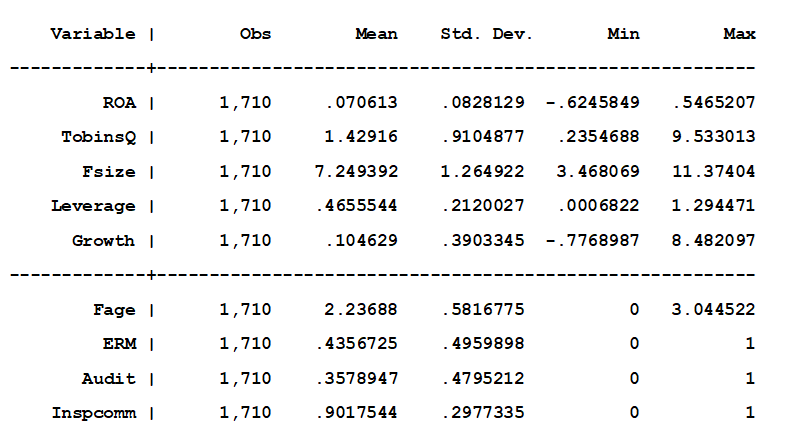
The measurement and sources of all variables are described in detail in Table 1 below, and the statistical descriptions of all variables are presented in Appendix I
Table 1. Variable descriptions
| Variable | Denote | Measurement | Data sources | Expected Signs | Preferences |
| Firm Value | Tobin’s Q | The total market capitalization of a firm plus total liabilities divided by its total assets | Financial reports, Fiinpro | Hoyt and Liebenberg, (2011); Kommunuri et al, (2016); Lang et al, (1996); Horvey andAnkamah, (2020); Otero González et al, (2020) | |
| Firm performance | ROA | Return on assets calculated as EBIT/Average Total Assets | Fiinpro | Hoyt and Liebenberg, (2011); Selvarajan et al, (2007); Ballal andBapat, (2020); Short andKeasey, (1999)) | |
| Firm Age | Fage | Natural log of the number of years the firm has been listed on the stock market | Annual reports | (+/-) | Kommunuri et al, (2016); Horvey and Ankamah, (2020), Janardhanan & Ramkumar, (2022) |
| Big4 Auditor | Audit | Big4 auditor = 1, otherwise 0 | Financial reports | (+) | Wang and Huang, (2014); Wijaya, (2020); Cohen et al, (2017), Janardhanan & Ramkumar, (2022) |
| Sales growth | Growth | Δ in revenue from t-1 to t period divided by t-1 revenue | Fiinpro | (+) | Liebenberg and Hoyt, (2003); Hoyt and Liebenberg, (2011); Kommunuri et al, (2016) |
| ERM application | ERM | Dummy variable one is if a firm has ERM practices; otherwise, 0. | annual reports | (+) | Pagach and Warr, (2011); Iswajuni et al, (2018); |
| Inspection committee presence | Inspcomm | If a firm has an inspection committee, a dummy variable is used, and 0 otherwise | Annual reports | (+) | Malik et al. (2020) |
| Firm size | Fsize | Natural log Total assets | Financial reports, | (+) | Otero González et al, (2020); Beasley et al, (2008); Horvey and Ankamah, (2020); Kommunuri et al, (2016) |
| Leverage | Leverage | Percentage of assets financed by debt (total debt/total assets) | Fiinpro | (+/-) | Harvey and Ankamah (2020). Pagach and Warr (2011). Beasley et al. (2008) |
3.4 Analysis Matrix of Coefficient Correlation
To test the correlation between the variables in the model, this study used the correlation matrix described in more detail in Table 2. Gujarati (2022) states that if the correlation coefficient between variables exceeds 0.8, the model will likely experience a serious multi-colinearity problem. At that time, the sign of the regression coefficients may be altered, leading to biased research results. The results showed that the absolute value of the correlation coefficients is less than 0.8. This means the model can handle serious multi-colinearity problems.
Table 2 Matrix of the correlation coefficient between variables
| Tobins’Q | ROA | Fsize | Leverage | Growth | Fage | ERM | Audit | Inspcomm | |
| Tobins’Q | 1 | ||||||||
| ROA | 0,446* | 1 | |||||||
| Fsize | 0,2263* | -0,0562* | 1 | ||||||
| Leverage | -0,1695* | -0,4161* | 0,3264* | 1 | |||||
| Growth | -0,0061 | 0,1260* | 0,0081 | 0,0812* | 1 | ||||
| Fage | -0,0257 | -0,0096 | 0,0374 | -0,0607* | -0,1614* | 1 | |||
| ERM | 0,1473* | 0,0287 | 0,3119* | 0,0847* | 0,0139 | 0,0331 | 1 | ||
| Audit | 0,2314* | 0,0620* | 0,4591* | 0,0211 | -0,0514* | 0,0925* | 0,2937* | 1 | |
| Inspcomm | -0,0246 | 0,0274 | -0,1381* | -0,0651* | 0,0151 | -0,0410 | -0,0745* | -0,0815* | 1 |
Source: Estimated from research data
However, to increase credibility, the article continues to test through the Variance Inflation Factor (VIF). As shown in Table 3, all VIF coefficients are less than 5, indicating no multi-co linearity in the research models.
Table 3 Variance Inflation Factor (VIF)
| Variables | Fsize | Audit | Leverage | ERM | Fage | Growth | Inspcomm |
| VIF | 1,52 | 1,35 | 1,16 | 1,15 | 1,04 | 1,03 | 1,02 |
| Mean VIF | 1,18 |
Source: Estimated from research data
3.5 The Regression Model Determination test
The three regression methods are employed to analyze the impact of ERM on firm performance and shareholders’ value of HOSE-listed firms, including the Pooled Ordinary Least Square Regression (Pooled OLS), the Fixed Effects Model (FEM), and the Random Effects Model (REM). In addition, the Feasible Generalized Least Square (FGLS) method is also used in the article to control autocorrelation and altered error variance.
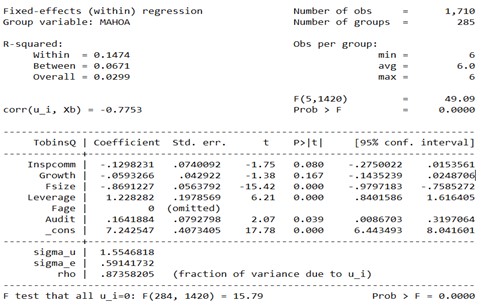
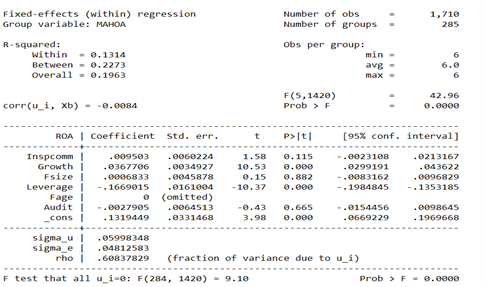
Results from the F test in Section 1, Appendix II show that in both cases, the dependent variables (Tobins’Q and ROA) have a P-value <significant level of 1%It. It means the Pooled OLS method is inappropriate because it does not reflect the impact of individual firms’ differences. However, the results confirm that the FEM model is appropriate.
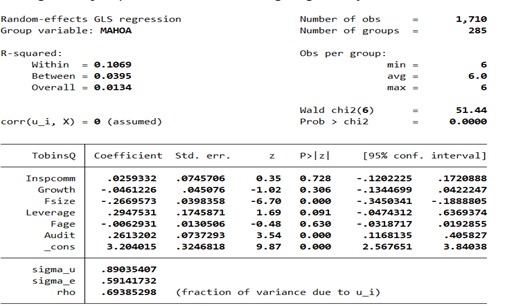
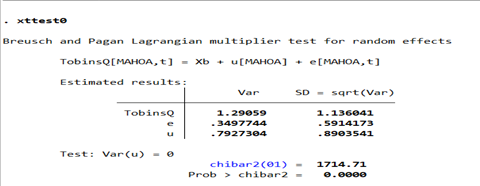
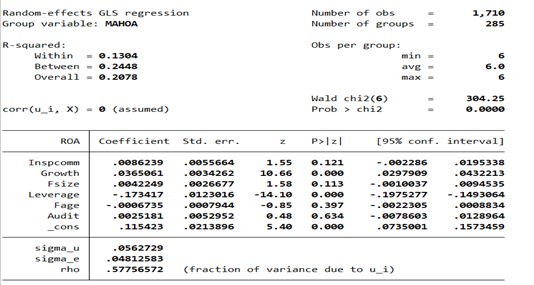
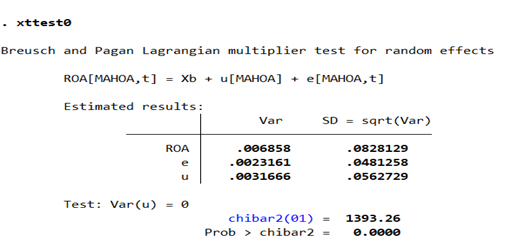
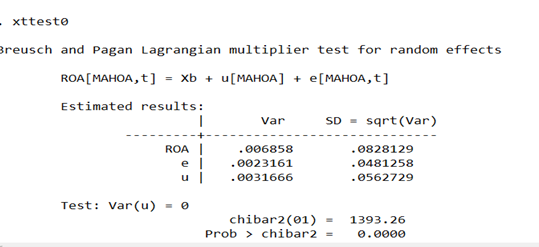
The results from the Breusch-Pagan test in Section 2, Appendix II, show that the dependent variables (Tobins’Q and ROA) have P-value <significant level of 1%, at 1% and 5% significant levels. That is, the error variance varies across the entities, and the REM model is appropriate.
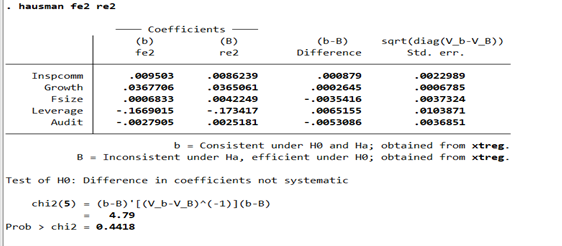
The Hausman test is presented in Section 3, Appendix II, to select the most suitable model between FEM and REM. The results show that the dependent variable of Tobins’Q has a statistically significant P-value (0.0000) <significant level of 1%. In contrast, this result for ROA has a P value (0.4418)> significant level of 1%. Therefore, it can be concluded that FEM regression would be more appropriate for the TobinsQ model, and REM regression is more appropriate for the ROA model.
3.6 Model Appropriation Tests
To assess the appropriation of the research models, the article continually examines some of the model’s defects, including heteroskedasticity and autocorrelation, as presented in Appendix III.
The results of the Wald test (model 1-TobinsQ) and Breusch and Pagan Lagrangian (Model 2-ROA) in Section 1, Appendix III, show that the research models with dependent variables of Tobins’Q and ROA have P-value statistic value < significant level of 1%. It proves hypothesis H0 is rejected, and the models occur in heteroskedasticity.
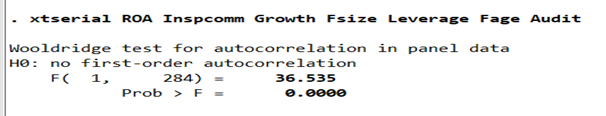
In addition, the Wooldridge results in Section 2, Appendix III indicate the TobinsQ and ROA have a P-value <significant level of 1%, with a significance level of 5%. As a result, hypothesis H0 is ignored, and the research models have an autocorrelation phenomenon.
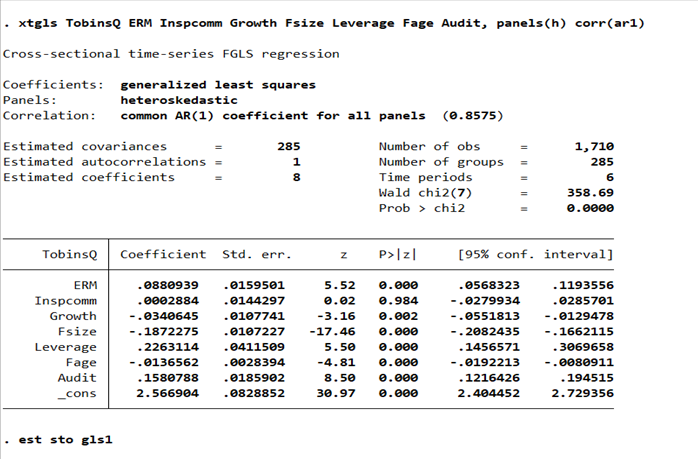
In summary, the results from the above tests show that estimation by the fixed-effects model of Tobins’Q and the random effects model of ROA violate the regression hypothesis, including heteroskedasticity and autocorrelation. Consequently, the Feasible Generalized Least Square method is applied to solve the above problems Tabak et al., (2011). This method is supposed to be useful to control autocorrelation and heteroskedasticity Wooldridge, (2002).
FINDINGS AND DISCUSSION
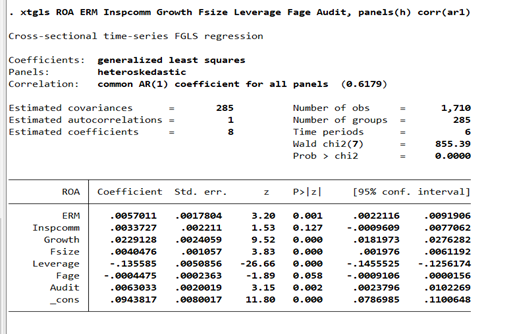
The table below shows the results from the Feasible Generalized Least Square method.
Table 4: Results from the FGLS method
| Variables | ROA (1) | TobinsQ (2) |
| ERM | 0,00557*** | 0,08809*** |
| Audit | 0,00601*** | 0,07878*** |
| Inspcomm | 0,00380*** | 0,002057 |
| Leverage | -0,13598*** | -0,25095*** |
| Growth | 0,02302*** | -0,02632*** |
| Fage | -0,00113 | -0,06118*** |
| Fsize | 0,00417*** | -0,02652*** |
| _cons | 0,09125 | 1,67129 |
| Observations | 1,710 | 1,710 |
| Wald chi28) | 870.64 | 171.42 |
Notes: ***, **, and * denote significance at 1%, 5%, and 10%, respectively.
(Source: Estimated from research data)
ERM Implementation (ERM):
The estimated results from FGLS indicated a positive relationship between the implementation of ERM and the performance and value of companies with coefficients of 0,00557 and 0,08809 with a statistical significance of 1%, respectively. That is, if enterprises have implemented a complete ERM system, the risk control in the enterprise is effective, leading to better performance and value than companies that do not apply. According to Putri (2017), their empirical evidence suggests that implementing ERM is a value-creation mechanism for enterprises because it enables management to face all types of uncertainty-related risks by integrating them. Pagach and Warr (2011) argue that if ERM can help companies avoid financial difficulties related to costs so that companies can achieve the highest level of profit, then this goal of value creation can be reached. These results are consistent with expectations and with the studies of Kommunuri et al. (2016), Zou et al. (2019), Hoyt and Liebenberg (2011), Anh and Hoa (2021), Gordon et al. (2009). Additionally, this is partially supported by Horvey and Ankamah (20(20) because they assume that ERM for performance is a U-shaped non-linear relationship, which means that ERM does not always have a positive relationship with performance but can also lead to negative outcomes.
Big 4 Auditor (Audit)
Through the positive estimation coefficients of the Audit variable of 0.00601 (ROA model) and 0.07878 (TobinsQ model) at a 1% significant level, it showed that if companies employed Big4 for auditing services, the company’s efficiency would increase in the same direction with these estimated coefficients. By being controlled by audit services at companies in the Big 4 group, the aggregated data of enterprises will achieve higher reliability, thereby increasing the ability to raise capital from the bank—Customers, creditors, investors, etc. Therefore, businesses can expand their operation scale, and the ability to realize investment opportunities is also higher. In addition, third parties often appreciate the quality of audits from Big4 companies; they believe that companies with high audit quality can reduce the risk of audit failure. Fraud prevention and quality audits will help provide information to investors, thereby gaining more confidence and enhancing value (Wijaya, 2020). This conclusion is consistent with previous studies on ERM implementation and performance and value as of Cohen et al. (2017), M. S. Beasley et al. (2005); Paape and Spekle (2012), Wijaya (2020), Fooladi and Farhadi (2011) and Wang and Huang (2014).
Inspection committee presence (Inscomm)
Although the regression coefficients are positive in both models, the Inscomm variable has no statistical significance in model 1 but is not in model 2 at the significance level of 1%. Therefore, it can be concluded that the presence of the Inspection committee in the corporate governance structure does not increase the company’s value but increases operational efficiency. This result is consistent with previous studies; they said that the existence of an Audit Committee, or audit subcommittee, would be more statistically significant for the application of ERM than the Inspection committee (Kommunuri et al., 2016; Malik et al., 2020,..).
Sales growth (Growth):
P values are less than a 1% significance level, and variable Sales growth (Growth) is statistically significant in both models. However, the regression coefficients show the opposite effect of the variable on the performance and the value of the firm. More specifically, the estimated coefficient in model 1 is 0.02302, showing that the growth rate of the enterprise has a positive influence on the performance of the enterprise. This result also explains that when businesses implement business strategic policies, they will control and limit risks in the process of investment and business, thereby increasing revenue and profit—business, leading to an increase in the business’s profitability. Agreeing with the above view is the author’s empirical research Zou et al. (2019) and Kommunuri et al. (2016). In contrast, in model 2, the estimated coefficient of Growth is negative, which confirms that the company’s revenue growth rate is inversely proportional to the enterprise value (Tobin’s Q). Specifically, if revenue growth increases by 1 unit, Tobin’s Q coefficient of the enterprise decreases to 0.02632 units. It indicates that this revenue growth may be due to the manager’s decision to undertake unprofitable projects for personal gain in the short term, thereby reducing the business value in the long run (Abdullah et al., (2017). Although this result is contrary to initial expectations and with previous studies of Maury (2006), Fruhan (1979), and Kommunuri et al. (2016), it is supported by studies of McShane et al. (2011), Phan Thuy Duong et al. (20(20) and Jang and Park (2011).
Firm age (Fage):
Table 4 shows that the firm age variable (Fage) is not statistically significant in model (1) at the 1% significance level. Therefore, it cannot conclude about the relationship between the age of the enterprise and the performance. In addition, in model 2, the results are contrary to initial expectations, with a negative regression coefficient (-0.06118) at a 1% significance level. The results of this study do not support the previous views in the previous research papers of Putri (2017). The author argued that age will make businesses aware of their strengths, and profits will generally be more stable than new companies. However, the estimated results show that the age of the firm is inversely proportional to the value of the firm, and it is supported by previous studies by Agarwal and Gort (1996), Kommunuri et al. (2016) and Horvey and Ankamah (2020).
Control variables
Firm size (Fsize): The estimation results show that Size has a positive relationship with ROA (coff = 0.00417) but has a negative effect on Tobin’s Q (coff = -0.02652) at a statistically significant level of 1%. This means that the larger the company size, the greater the profitability and the lower the market value. Although the effect of size on firm performance is not too significant, it also shows that size is a control. This positive relationship is consistent with the studies of Kommunuri et al. (2016) and Florio and Leoni (2017). Besides, the inverse relationship between firm size and firm value indicates that smaller firms are valued better. This result contradicts expectations that the larger the size, the greater the firm’s market value. This result is consistent with the study of Phan Thuy Duong et al. (2020) but not supported by Hoyt and Liebenberg (2011), Liebenberg and Hoyt (2003), M. S. Beasley et al. (2005) and Horvey and Ankamah (2020).
Leverage (Leverage): As expected, the results show that financial leverage is negatively related to both performance and firm value with estimated coefficients of -0,13598 and -0,25095, respectively. This negative relationship can be explained by the trade-off theory, i.e., as debt utilization increases, the firm receives an increase in the return with that increase in debt but lowers its risk. As the company increases, the cost of financial distress will also be higher, thereby causing the profit of the business to decrease. This is consistent with the views of Liebenberg and Hoyt (2003), Beasley et al. (2008), Anh and Hoa (2021), Mahakud and Misra (2009), McShane et al (2011), Đỗ Thị Vân Trang and Phạm Thị Vân Huyền (2021) and M. Beasley et al, (2008). They concluded that increasing the leverage ratio of listed companies leads to an increase in costs and, thus, a decrease in the profits and value of the companies. Although there is a negative effect, financial leverage is a decisive factor in the motivation to set up and operate the ERM system. Because a complete ERM implementation will help reduce financial costs by assessing and predicting the risks of using debt (Beasley et al., (2008).
CONCLUSION
The study examined the effects of ERM on the performance and value of 285 listed firms on HOSE from 2017 to 2022. It can be concluded that although the implementation of ERM in these companies is still very limited, it can increase corporate value and operational efficiency through the positive estimated coefficients. However, the effect of ERM on performance and value may be unstable over time because the estimated coefficient is very small (0.00557 and 0.08809) over six years. In addition, research results show that company size and growth rate have a negative relationship with firm value and a positive relationship with business performance. This indicates that expanding scale increases the scope of production activities. Consequently, the operating efficiency of these units will increase, but the size expansion faces many risks which may reduce the value of the business. Therefore, companies must consider carefully expanding their scale or merging with other companies. Similarly, revenue growth is only effective in the short term and at the corporate level, but for the market, this growth sometimes does not mean a business is doing well. Because based on revenue data, the market can only partially assess the business’s operating status, and assessing business value requires many other factors. To increase business value by assessing revenue growth factors, businesses should have a clear and effective sales policy. The study has the following limitations: (1) the study has not researched the effects of regulatory and market differences between industries, leading to differences in the application of ERM; (2) the topic has not considered the following factors: macroeconomic factors, factors belong to corporate governance, cultural factors, … Because setting up and running a good ERM system requires a long time to reap the benefits of it, longitudinal studies to examine the long-term effects of ERM or comparative studies across different countries or regions can be done for future research.
REFERENCES
- Abdullah, B., Syah, M. H., Janor, H., Hamid, M. A., & Yatim, P. (2017). The Effect of ERM on Firm Value: Evidence from Malaysian Technology Firms. Jurnal Pengurusan, 49.
- Agarwal, R., & Gort, M. (1996). The evolution of markets and entry, exit, and survival of firms. Review of Economics and Statistics, 78(3), 489–497. https://doi.org/10.2307/2109796
- Albasu, J., & Nyameh, J. (2017). Relevance of stakeholders theory, organizational identity theory and social exchange theory to corporate social responsibility and employees performance in the commercial banks in Nigeria. International Journal of Business, Economics and Management, 4(5), 95–105.
- Anh, N. T., & Hoa, T. P. (2021). The Impact of ERM and Sustainability Reporting on Business Performance of Listed Enterprises on Vietnam Stock Market. Vnu Journal of Economics and Business, 1(5). https://doi.org/10.25073/2588-1108/vnueab.4664
- Aziz, N. A. A., Manab, N. A., & Othman, S. N. (2015). Exploring the Perspectives of Corporate Governance and Theories on Sustainability Risk Management (SRM). Asian Economic and Financial Review, 5(10), 1148–1158. https://doi.org/10.18488/journal.aefr/2015.5.10/102.10.1148.1158
- Ballal, J. M., & Bapat, V. (2020). Socioemotional Wealth and Its Effect on Family Firm Performance. In Handbook of Research on the Strategic Management of Family Businesses (pp. 201–227). IGI Global. https://doi.org/10.4018/978-1-7998-2269-1.ch010
- Beasley, M., Pagach, D., & Warr, R. (2008). Information conveyed in hiring announcements of senior executives overseeing enterprise-wide risk management processes. Journal of Accounting, Auditing and Finance, 23(3), 311–332. https://doi.org/10.1177/0148558X0802300303
- Beasley, M. S., Clune, R., & Hermanson, D. R. (2005). ERM: An empirical analysis of factors associated with the extent of implementation. Journal of Accounting and Public Policy, 24(6), 521–531. https://doi.org/10.1016/j.jaccpubpol.2005.10.001
- Bertinetti, G. S., Cavezzali, E., & Gardenal, G. (2013). The Effect of the ERM Implementation on the Firm Value of European Companies. SSRN Electronic Journal. https://doi.org/10.2139/ssrn.2326195
- Carroll, A. B. (1998). The four faces of corporate citizenship. Business and Society Review, 100(1), 1–7.
- Cohen, J., Krishnamoorthy, G., & Wright, A. (2017). ERM and the financial reporting process: The experiences of audit committee members, CFO s, and external auditors. Contemporary Accounting Research, 34(2), 1178–1209.
- (2004). Applying COSO’s ERM — Integrated Framework. ERM, 3(September), 1–16. http://www.coso.org/documents/COSO_ERM_ExecutiveSummary.pdf
- Elton, E. J., & Gruber, M. J. (1997). Modern portfolio theory, 1950 to date. Journal of Banking & Finance, 21(11–12), 1743–1759.
- Fabozzi, F. J., Gupta, F., & Markowitz, H. M. (2002). The legacy of modern portfolio theory. The Journal of Investing, 11(3), 7–22.
- Faisal, F., Abidin, Z., & Haryanto, H. (2021). ERM (ERM) and firm value: The mediating role of investment decisions. Cogent Economics and Finance, 9(1). https://doi.org/10.1080/23322039.2021.2009090
- Florio, C., & Leoni, G. (2017). ERM and firm performance: The Italian case. British Accounting Review, 49(1), 56–74. https://doi.org/10.1016/j.bar.2016.08.003
- Fooladi, M., & Farhadi, M. (2011). Corporate governance and audit process. International Conference on Humanities, Society and Culture (ICHSC) Kuala Lumpur, Malaysia, November, 4–6.
- Fruhan, W. E. (1979). Financial strategy: Studies in the creation, transfer, and destruction of shareholder value. Richard d Irwin.
- Gordon, L. A., Loeb, M. P., & Tseng, C. Y. (2009). ERM and firm performance: A contingency perspective. Journal of Accounting and Public Policy, 28(4), 301–327. https://doi.org/10.1016/j.jaccpubpol.2009.06.006
- Gujarati, D. N. (2022). Basic econometrics. Prentice Hall.
- Horvey, S. S., & Ankamah, J. (2020). ERM and firm performance: Empirical evidence from Ghana equity market. Cogent Economics and Finance, 8(1). https://doi.org/10.1080/23322039.2020.1840102
- Hoyt, R. E., & Liebenberg, A. P. (2011). The Value of ERM. Journal of Risk and Insurance, 78(4), 795–822. https://doi.org/10.1111/j.1539-6975.2011.01413.x
- Iswajuni, I., Manasikana, A., & Soetedjo, S. (2018). The effect of ERM (ERM) on firm value in manufacturing companies listed on Indonesian Stock Exchange year 2010-2013. Asian Journal of Accounting Research, 3(2), 224–235. https://doi.org/10.1108/AJAR-06-2018-0006
- Janardhanan, A. K., & Ramkumar, U. V. (2022). Does internal control process and firm characteristics improve firm value? An empirical analysis in the manufacturing sector. Corporate Ownership and Control, 19(3), 101–111. https://doi.org/10.22495/cocv19i3art7
- Jang, S. S., & Park, K. (2011). Inter-relationship between firm growth and profitability. International Journal of Hospitality Management, 30(4), 1027–1035.
- Kommunuri, J., Narayan, A., Wheaton, M., & Jandug, L. (2016a). ERM and Firm Performance Empirical evidence from Vietnam. New Zealand Journal of Applied Business Research, 14(2), 17–28.
- Kommunuri, J., Narayan, A., Wheaton, M., & Jandug, L. (2016b). Firm performance and value effects of ERM. New Zealand Journal of Applied Business Research, 14(2), 17–28. https://search.informit.org/doi/pdf/10.3316/informit.797918171949834?download=true
- Lang, L., Ofek, E., & Stulz, R. (1996). Leverage, investment, and firm growth. Journal of Financial Economics, 40(1), 3–29.
- Liebenberg, A. P., & Hoyt, R. E. (2003). The Determinants of ERM: Evidence From the Appointment of Chief Risk Officers. Risk Management <html_ent Glyph=”@amp;” Ascii=”&”/> Insurance Review, 6(1), 37–52. https://doi.org/10.1111/1098-1616.00019
- Lim, S. S., & Wang, H. (2007). The effect of financial hedging on the incentives for corporate diversification: The role of stakeholder firm-specific investments. Journal of Economic Behavior and Organization, 62(4), 640–656. https://doi.org/10.1016/j.jebo.2005.04.012
- Lin, Y., Wen, M. M., & Yu, J. (2012). ERM: Strategic Antecedents, Risk Integration, and Performance. North American Actuarial Journal, 16(1), 1–28. https://doi.org/10.1080/10920277.2012.10590630
- Mahakud, J., & Misra, A. K. (2009). Effect of Leverage and Adjustment Costs on Corporate Performance. Journal of Management Research, 9(1), 35–42.
- Malik, M. F., Zaman, M., & Buckby, S. (2020). ERM and firm performance: Role of the risk committee. Journal of Contemporary Accounting and Economics, 16(1), 100178. https://doi.org/10.1016/j.jcae.2019.100178
- Markowits, H. M. (1952). Portfolio selection. Journal of Finance, 7(1), 71–91.
- Maury, B. (2006). Family ownership and firm performance: Empirical evidence from Western European corporations Author links open overlay panel. Journal of Corporate Finance, 12(2), 321–341.
- Mayers, D., & Smith Jr, C. W. (1987). Corporate insurance and the underinvestment problem. Journal of Risk and Insurance, 45–54.
- McShane, M. K., Nair, A., & Rustambekov, E. (2011). Does ERM increase firm value? Journal of Accounting, Auditing and Finance, 26(4), 641–658. https://doi.org/10.1177/0148558X11409160
- Mohd Tahir, I., & Razali, A. R. (2011). the Relationship Between ERM (Erm) and Firm Value: Evidence From Malaysian Public Listed Companies. International Journal of Economics and Management Sciences, 1(2), 32–41.
- Otero González, L., Durán Santomil, P., & Tamayo Herrera, A. (2020). The effect of ERM on the risk and the performance of Spanish listed companies. European Research on Management and Business Economics, 26(3), 111–120. https://doi.org/10.1016/j.iedeen.2020.08.002
- Paape, L., & Spekle, R. F. (2012). The Adoption and Design of ERM Practices: An Empirical Study. SSRN Electronic Journal, January, 1–34. https://doi.org/10.2139/ssrn.1658200
- Pagach, D., & Warr, R. (2011). The Characteristics of Firms That Hire Chief Risk Officers. Journal of Risk and Insurance, 78(1), 185–211. https://doi.org/10.1111/j.1539-6975.2010.01378.x
- Phan, T. D., Dang, T. H., Nguyen, T. D. T., Ngo, T. T. N., & Hoang, T. H. Le. (2020). The effect of ERM on firm value: Evidence from Vietnam industry listed enterprises. Accounting, 6(4), 473–480. https://doi.org/10.5267/j.ac.2020.4.011
- Putri, V. R. (2017). The Effect of Profitability, Dividend Policy, Debt Policy, and Firm Age on Firm Value in The Non-Bank Financial Industry. Jurnal Ilmu Manajemen & Ekonomika, 10(1), 14–21.
- Selvarajan, T. T., Ramamoorthy, N., Flood, P. C., Guthrie, J. P., MacCurtain, S., & Liu, W. (2007). The role of human capital philosophy in promoting firm innovativeness and performance: Test of a causal model. The International Journal of Human Resource Management, 18(8), 1456–1470.
- Shad, M. K., Lai, F. W., Fatt, C. L., Klemeš, J. J., & Bokhari, A. (2019). Integrating sustainability reporting into ERM and its relationship with business performance: A conceptual framework. Journal of Cleaner Production, 208, 415–425. https://doi.org/10.1016/j.jclepro.2018.10.120
- Short, H., & Keasey, K. (1999). Managerial Ownership and the Performance of Firms: Evidence from the UK. Journal of Corporate Finance, 5(1), 79–101.
- Smith, C. W., & Stulz, R. M. (1985). The determinants of firms’ hedging policies. Journal of Financial and Quantitative Analysis, 20(4), 391–405.
- Wang, Y.-F., & Huang, Y.-T. (2014). How do auditors increase substantially firm value. International Journal of Economics and Finance, 6(10), 76–82.
- Wijaya, A. L. (2020). The Effect of Audit Quality on Firm Value: A Case in Indonesian Manufacturing Firm. Journal of Accounting Finance and Auditing Studies (JAFAS), 6(1), 1–15. https://doi.org/10.32602/jafas.2020.001
- Zou, X., Isa, C. R., & Rahman, M. (2019). Valuation of ERM in the manufacturing industry. Total Quality Management and Business Excellence, 30(11–12), 1389–1410. https://doi.org/10.1080/14783363.2017.1369877
APPENDICES
Appendix I: Statistical Descriptions
Sum ROA TobinsQ Fsize Leverage Growth Fage ERM Audit Inspcomm
Appendix II: Regression selection tests
- F Test
| Dependent variables | F (284, 1420) | Prob>F | Selected Model |
| TobinsQ | 15.79 | 0,0000 | Fixed Effects Model |
| ROA | 9.10 | 0,0000 | Fixed Effects Model |
- TobinsQ:
- ROA:
- Breusch-Pagan Test
| Dependent variables | chibar2(01) | Prob>Chi2 | Selected Model |
| TobinsQ | 1714.71 | 0.0000 | Random Effect Model |
| ROA | 1393.26 | 0.0000 | Random Effect Model |
- TobinsQ:
- ROA:
- Hausman Test
| Dependent variables | CChi2 | Prob>Chi2 | Selected Model |
| • TobinsQ | 253.88 | 0.0000 | Fixed Effect Model |
| ROA | .79 | 0.4418 | Random Effect Model |
- TobinsQ
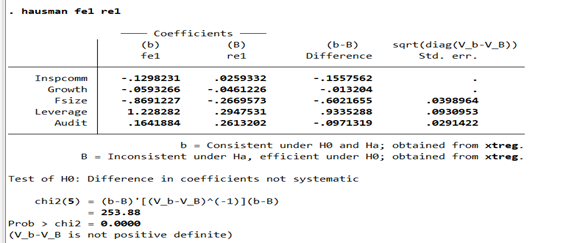
- ROA
Appendix III: Regression model appropriation tests
- Heteroskedastocity Tests
| Dependent variables | Test | Chi2 | Prob>Chi2 | Results |
| TobinsQ | Wald | 4.0e+09 | 0,0000 | Heteroskedasticity |
| ROA | Breusch and Pagan Lagrangian | 1393.26 | 0,0000 | Heteroskedasticity |
- TobinsQ

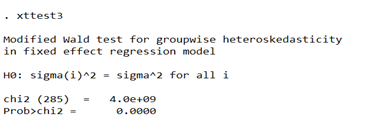
- ROA
- Autocorrelation Test-Wooldridge Test
| Dependent variables | F | PProb>F | Results |
| • TobinsQ | 859.896 | 0.0000 | Autocorrelation |
| ROA | 36.535 | 0.0000 | Autocorrelation |
- TobinsQ

- ROA
Appendix IV: Results From Feasible Generalized Least Square – FGLS
- TobinsQ
- ROA