
Electricity Generation and Economic Growth in Nigeria: A Nonlinear ARDL Analysis
- ISAH Ukwenya Shuaib
- John Olu-Coris Aiyedogbon
- Marvelous Aigbedion
- 3144-3157
- Aug 21, 2024
- Economics
Electricity Generation and Economic Growth in Nigeria: A Nonlinear ARDL Analysis
ISAH Ukwenya Shuaib, John Olu-Coris Aiyedogbon and Marvelous Aigbedion
Economics Department, Faculty of Social Sciences, Bingham University Karu, Nigeria
DOI: https://dx.doi.org/10.47772/IJRISS.2024.807241
Received: 05 July 2024; Accepted: 17 July 2024; Published: 21 August 2024
ABSTRACT
Nigeria is endowed with a variety of renewable energy sources, including solar and wind power but the country energy mix is mostly powered by natural gas and hydropower. However, numerous problems across the entire value chain, from production to transmission, distribution, gas supply, tax collection to losses and tariffs, confront Nigeria’s power industry. Equally, a number of reforms have been implemented in the industry. The most important reform was the Electricity Power Sector Reform Act of 2005, which ended the long-standing monopoly of the now-defunct National Electric Power Authority (NEPA) and allowed private companies to engage in the production, transmission, and distribution of electricity. Despite series of reforms within the electricity sector, alarmingly poor electricity conditions exist with inconsistent economic growth rates. Thus, the paper examines how electricity generation influences economic growth in Nigeria; using the Non-Linear Autoregressive Distributed Lag (NARDL) estimation technique from 1980 to 2022. Finding reveals differential impacts of positive (ΔEPG^+) and negative (ΔEPG^-) changes in electricity power generation on economic growth. The more pronounced effect of positive changes suggests that increases in electricity power generation have a greater and more immediate impact on the economic growth (GDP) compared to decreases. Conversely, changes in capital growth (ΔCPTG) do not exhibit short-run significance, indicating that fluctuations in capital growth do not instantaneously affect economic growth. In contrast, the significant negative impact of changes in the natural log of labour (ΔlnLBR) implies that alterations in labour dynamics have tangible and adverse effects on economic growth in the short run. Turning to the long-run perspective, the constant term’s significance at the 10% level (-248.338) suggests a persistent, albeit relatively muted, impact in the absence of changes in the independent variables. In the long run, the positive and significant coefficient (0.576) associated with electricity power generation (EPG) signifies its pivotal role as a driving force in the electricity power generation sector. Lagged variables for capital growth (CPTG_(t-1)) and the natural log of labour (lnBR_(t-1)) fail to achieve significance, indicating a limited long-run impact of these variables on economic growth. Considering the pronounced short-run impact of positive changes in electricity power generation, policymakers should consider incentivizing and promoting initiatives that lead to increased electricity production. This can contribute to a more immediate boost in economic activity. Also, due to lack of short-run significance for changes in capital growth, policymakers may focus on longer-term strategies for capital investment in the electricity sector.
Keywords: Electricity Generation, Economic Growth, Climate Change, NARDL and Nigeria
JEL Codes: L94; O44; Q54, C30 and N47
INTRODUCTION
The primary objective of any nation’s economic policy is economic growth. Fundamentally, the term “economic growth” refers to the gradual rise in an economy’s output of goods and services, as indicated by an increase in the GDP or GNP. But Gross Domestic Product is however, not a complete indicator of economic health because individual nations may estimate nominal GDP incorrectly or biasedly World Econonmic Forum (2018), Adegbie & Fakile (2011).
Reliable energy mix and availability is one of the major key drivers of economic productivity as evident during Covid-19 pandemic where human to human contact was reduced drastically and people have to work from home relying on electricity sources. Therefore, quantifying the amount of electricity produced could be a different method of measuring economic growth. This is a proxy for the need for electricity and, ultimately, the amount of energy consumed by a particular economy. It may be a little higher because of potential energy imports and power plants, particularly in cases when the nation has a lot of renewable energy resources. But various nations have varied energy resources, which means they have different chances to produce enough electricity to meet demand (Nyasapoh et al., 2023).
Nigeria’s desire for industrialization and overall economic expansion depends heavily on energy, which has an installed capacity of more than 13.4GW, an operating capacity of about 7GW, and an actual dispatch to end users of less than 4GW. Nigerians are now forced to generate their own electricity, with an estimated 8GW to 13GW of total generator capacity, due to the low installed capacity. Nigeria’s economy depends heavily on energy, which also boosts the country’s competitiveness and guarantees a high standard of living for its more than 200 million citizens. Both small and large firms can operate profitably if there is adequate energy provision.
In addition, Nigeria is endowed with a variety of renewable energy sources such as biomass, solar power, and wind, but it has not yet fully utilized them. Numerous problems across the entire energy value chain, from production to transmission, distribution, gas supply, tax collection to losses and tariffs, confront Nigeria’s power industry. Persistent vandalism has also severely damaged the gas supply, thereby causing power plants to operate below capacity. Indeed, Nigeria’s National Development Plan (NDP), 2021–2025, states that the country’s industrialization goals cannot be achieved without dependable and reasonably priced energy supply.
Despite the abundance of renewable energy sources, including solar and wind power, Nigeria’s present energy mix is mostly powered by natural gas and hydropower without the use of renewable energy. A number of reforms have been implemented in the industry through the creation of plans and roadmaps. The most important reform has been the Electricity Power Sector Reform Act of 2005, which ended the long-standing monopoly of the now defunct National Electric Power Authority (NEPA) and allowed private companies to engage in the production, transmission, and distribution of electricity. It also enforced performance standards and allowed competitive markets to grow. As a result, NEPA was unbundled into six firms that generate electricity, eleven companies that distribute it, and one company that handles transmission. Additionally, with the Rural Electrification Agency (REA) spearheading the Nigeria Electrification Project (NEP), the Nigerian energy sector has also seen a surge in the use of off-grid renewable energy technology. However, in spite of the series of reforms implemented within the electricity sector, dismal poor electricity conditions still exist in Nigeria with fluctuating economic growth. For example, Nigeria’s GDP expanded by an average annual rate of 7 percent between 2000 and 2014 as reported by the National Bureau of Statistics (NBS); but also witnessed challenges between 2015 and 2023, including two economic recessions recorded between 2016 and 2020 (NBS, 2023).
Therefore, the paper was motivated by the challenges in the energy sector to examine how electricity generation influences Nigeria’s economic growth both in the short-run and long-run in Nigeria. To this end, the paper uses the Non-Linear Autoregressive Distributed Lag (NARDL) estimation technique to estimate this influence from 1980 to 2022. This paper differs from previous studies in several ways: First, to the best of the authors’ understanding, only a few studies have investigated how electricity generation affects economic growth in Nigeria. In general however, there are more studies on electricity consumption and economic growth nexus in the literature compared to the few available studies on power generation and economic growth nexus in Nigeria. Secondly, the paper applied the Non-Linear Autoregressive Distributed Lag (ARDL) technique, which is an advancement that specifies and restricts difficulties associated with considering the short time series. Moreover, the NARDL technique can assess long-term and short-term parameters parallel to avoid difficulties related to nonstationarity time-series data (Dekle & Hamada, 2015).
LITERATURE REVIEW
Conceptual Review
Economic Growth
Economic growth as a concept is viewed differently by different scholars. This is attributed to the condition prevailing at the time of these scholars. Economic growth stands as one of the most widely deliberated and researched concepts in the realm of economics, public policy, and development studies. At its core, economic growth pertains to the increase in the output of goods and services in an economy over time, typically measured by the rise in the Gross Domestic Product (GDP) or Gross National Product (GNP). Majority of scholars see economic growth as an increase in the level of national income and output of a country.
However, Todaro and Smith (2011) define economic growth as a steady process by which the productive capacity of the economy is increased over time to bring about rising levels of national output and income. While, Jhingan (2006) views economic growth as an increase in output, he explained further that it is related to a quantitative and sustained increase in a country’s per capita income or output accompanied by an expansion in its labour force, consumption, capital and volume of trade. The main characteristics of economic growth are a high rate of structural transformation, and international flows of labour, goods and capital.
Electricity Power Generation
According to Singh and Nachtnebel (2016) power generation is the process of producing electric energy or the amount of electric energy produced by transforming other forms of energy into electrical energy; commonly expressed in kilowatt-hours (kWh) or megawatt-hours (MWh). Electricity generation is the process of generating electric power from sources of primary energy. For utilities in the electric power industry, it is the stage before its delivery to end users (transmission, distribution, etc.) or its storage (using, for example, the pumped-storage method). One major characteristic of electricity is that it is not freely available in nature in large amounts, so it must be “produced” (that is, transforming other forms of energy into electricity).
Similarly, power generation is the process of generating electrical power from other sources of primary energy. The fundamental principles of electricity generation were discovered during the 1820s and early 1830s by the British scientist Michael Faraday. His basic method is still used today: it involved generating electricity by the movement of a loop of wire, or disc of copper between the poles of a magnet. Since then, mankind has been generating electricity on an industrial scale since 1881. The first power plants used hydroelectric power and coal power (Yang et al, 2016). Thus, power generation is the first process in the delivery of electricity to consumers. The other three processes are electric power transmission, electricity distribution and electricity retailing.
Theoretical Framework
The choice of Cobb-Douglas Production Function is premised on the foundation that shows the relationship between the amount of inputs and the amount of output that can be produced, in this situation Economic growth and Electricity Power Generation (EPG) while Capital growth (CPTG) and labour are the control variables as demonstrated with the choice of the model. The amount of electricity generated fuels economic growth with the supporting variables of capital and labour.
The Cobb-Douglas Production Function is the theoretical foundation of the paper. Theoretically, one of the models commonly considered for examining growth is the production function, and precisely, the Cobb-Douglas. It is given by:
![]()
X, K, L, and A represent output, capital, labor, and total factor productivity, respectively. Eq. (1) can be expressed in the intensive form given by:
![]()
where x = X / L, is gross output per worker; and k = K / L, capital per worker. Finally, as is well-known, Ο ≺ α ≺1 , which implies that there are diminishing returns to output per worker.
The (net) output is defined by
![]()
Y = net output, y = Y / L, i.e., net output per worker, and λ = a fixed proportion of the domestic (gross) output devoted to emission control. The capital accumulation equation is given by:
![]()
Where dk/dt = change in capital per worker. It is assumed that a proportion of net output is saved and invested. The first term on the right-hand side of equation 4, sΑΚα (1- λ) , represents gross investment; the second term,δ+ n , is the sum of the depreciation rate and the labor force growth rate.
Eq. (4) can be rewritten as follows:
![]()
Empirical Review
Ghana’s energy generation from 2020 to 2048 was quantitatively assessed by Nyasapoh et al. (2023) using the IAEA MESSAGE analysis tool. The findings showed that, by 2048, a diversified electricity generation scenario will result in a 32.30% decrease in cost and a 55.27% reduction in CO2 emissions, compared to an accelerated economic growth (AEG) scenario, which will increase cost and CO2 emissions by 12.21% and 21.10%, respectively. The results underscored the importance of ensuring that electricity generation policies balance economic, environmental, and social concerns. The conclusion was that achieving a greater economic growth transition agenda in Nigeria and other developing nations will require a long-term commitment to a generation mix that is both sustainable and economically viable and that the implementation of such a policy will require an informed and dedicated effort from all stakeholders.
Nelson et al. (2022) explored the impact of electricity generation on the economic growth of 30 African countries over the period 1990 to 2020. They employed Panel Autoregressive Distributed Lag-Pooled Mean Group (ARDL-PMG) data analysis technique. Using Pedroni’s test for cointegration, they confirmed the presence of cointegration among the variables. The study findings revealed that electricity generation has a positive long-term impact on economic growth over the study period. Furthermore, the study findings indicated that industrial output, foreign direct investment inflows, and inflation had a significant impact in the long run on economic growth in the countries under study. In addition, the study applied Dumitrescu & Hurlin (2012) causality test and confirmed no causality between economic growth and electricity generation. However, they found causality between industrial production, foreign direct investment inflows, gross fixed capital formation, and economic growth. Based on the empirical evidence, they recommended that decision-makers can formulate solid policies to impact the African electricity industry based on important economic policy implications.
The potential connection between GDP growth and energy output in European countries was examined by Szustak et al. (2022). The research used data on hourly power production in MWh/h averaged over a whole day, which were converted into total quarterly production. The data were divided in terms of the type of energy into conventional, renewable, others and total. Next, the correlation coefficient was calculated for proper data sets in order to determine whether there was a correlation between the variables. The main conclusion from the study was the fact that a correlation measured with the Pearson correlation coefficient was not reflected in the data. Changes in power production independent of the source of power did not influence the GDP directly. Naturally, in some countries, the connection between power production and GDP was stronger; however, comparing this to the rest of the researched countries, where correlation was low or even extremely low, the researchers discovered that the relationship was random. The recommendation was that changes in the energy policy will undoubtedly affect the economy of European countries in the future (both in the short and long term), and in this context, research on the relationship between energy issues and their impact on macroeconomic figures should be continued
Using the Autoregressive Distributed Lag Model and Granger Causality test methodologies, Abur et al. (2022) investigated the relationship between electricity generation and economic growth in Nigeria from 1986 to 2019. The study found that electricity is an important factor in economic growth in Nigeria. The result is thus an indication that electricity consumption enhances economic growth enormously. Furthermore, the result from the causality test shows that there is a bi-directional causal relationship between total electricity consumption and economic growth in the long run. The study recommends that the policymaker need to improve the power sector to harness the potential of electricity in growing the economy.
Ebhotemhen (2021) examined the impact of the relevant factors that could affect electricity generation in Nigeria within the period 1970-2018. In order to capture the objective of this work, the study used Autoregressive Distributed Lag Model (ARDL) approach. The study found significant and direct relationship between price of electricity, economic growth, installed capacity and electricity generation in Nigeria. Also found in the results is the inverse relationship between annual rainfall, gas consumption and electricity generation in the long-run. The study therefore recommended the use of installed capacity, price of electricity, electricity consumed, and economic growth as these could enable increase in electricity generation in Nigeria. In addition to these, hydroelectricity power station should be located where there is sufficient rainfall to enable the hydroelectricity function to its full capacity.
The relationship between South Africa’s economic expansion and the production of power was examined by Hlongwane and David (2021). The study employed time series data spanning from 1985 to 2020. By employing an Autoregressive Distributed Lag Model (ARDL), Error Correction Model and Granger causality test, the results revealed that there was a positive relationship between electricity generation and economic growth both in the short and long-run period.
Azam et al (2021) investigated renewable electricity generation and economic growth nexus in developing countries: An ARDL approach This study examined the short- and long-run of the causal correlation between economic growth and renewable electricity generation sources for a panel of 25 developing nations over the period 1990–2017.The main findings indicatd that the positive and significant impact of renewable electricity generation on growth revealed that renewable electricity generation sources stimulated growth in the long run for these selected countries. It is also demonstrated that there is bidirectional causality between renewable electricity generation and growth both in the short run and long run.
By applying the Blanchard and Quah long-run constraints to the Structural Vector Autoregressive model (SVAR), Oryani et al. (2020) aimed to assess the influence of the mix of renewable electricity generation on economic development and CO2 emissions in Iran between 1980 and 2016. The yearly data on real Gross Domestic Product (GDP), the share of electricity generation from renewable sources, and carbon dioxide emissions (CO2) caused by liquid, solid, and gaseous fuels were used. The positive impact of one standard deviation shock of increasing the share of renewable electricity on economic growth was confirmed by using Impulse Response Function (IRF). Contrary to the expectation, the share of renewable electricity in the energy mix was not at a desirable level to lower CO2 emissions, which partly could be explained by the dominant role of fossil fuel in Iran (as an energy-driven country). Moreover, the findings of Variance Decomposition (VD) verified the low share of electricity generated by renewable energy in explaining forecast error variations in economic growth and CO2 emissions. It indicated that in this stage of development, increasing the share of renewable electricity could not be considered as an appropriate strategy to control environmental issues. Therefore, initiating and implementing environmental policies could be considered as the most proper policies to lower CO2 emissions and to achieve the goal of sustainable development.
From 1981 to 2016, Akindele (2019) investigated the connection between Nigeria’s national development and the production of energy. The study employed Autoregressive Distributed Lag (ARDL) bound test which was found to be the most appropriate to establish the short-run and long-run relationship since there was fractionally integrated variables. That is, variables at different level of integration (but not at I (2) level). The study revealed that electricity generation negatively affected national development both in the long and short run periods. The consequence of electricity generation effects on national development was negative; thus, it served as a disincentive to productivity, economic activity and national development. The study concluded that electricity generation had significantly impacted negatively on productivity and national development of the Nigerian economy over the years.
Oyedele & Akinlo (2019) examined the impact of energy generation on economic growth in Nigeria by explicitly focusing on the two significant sources of energy generation. The study covered the period 1980–2017, and error correction model as a technique of estimation the results indicated the existence of cointegration among the variables. It also found that gas energy, physical capital and interest rates were crucial to the development of economic growth in the long run. However, in the short run, hydropower contributed to the development of the economy.
Using data for a panel of 174 nations for the years 1980–2012, Atems & Hotaling (2018) investigated the relationship between energy generation and economic growth using the System Generalized Method of Moments (GMM). The results indicated a strong positive and statistically significant relationship between renewable and nonrenewable electricity generation and growth after disentangling electricity generation into renewable and non-renewable sources.
Ogbonna et al (2016) examined the impact of power generation capacity on economic growth in Nigeria from 1980 – 2015.using co integration test, vector error correction mechanism and granger causality. The study concluded that there was no causality between power generation capacity and economic growth in Nigeria within the study period.
Power generation capacity’s effect on Nigeria’s economic growth from 1980 to 2015 was studied by Onyeisi, et al (2016). In the model specified, Real Gross Domestic Product was a function of Power generation capacity in Kilowatts, Gross capital formation and Unemployment. With the aid of econometric techniques employed (co-integration test, vector error correction mechanism and granger causality); the following results were found; a stable long-run relationship existed between the dependent and explanatory variables in the model as supported by the presence of two co-integrating equations. This meant that the result of this finding could be relied upon in taking long-run policy decisions. In the VECM equation result presented, the t-statistics for PGCKWH was 0.003106 while its P-value was (0.2659). The t-statistics for GCF was 1.109381 while its P-value was (0.5843). The VECM result also showed a t-statistics of – 4652.801 with a p-value of 0.0297, indicating an insignificant relationship with RGDP. The study concluded that there was no causality between power generation capacity and economic growth in Nigeria within the study period. The study, therefore, made the following recommendations; For the growth of the economy and improvement in power generation capacity, the government must ensure transparency in the overall implementation of power sector policy and its attendant reform agenda. There was need to ensure full implementation of the power sector budget through oversight function by the legislative arm of government to check the endemic corruption associated with the sector.
METHODOLOGY
Research Design
In this paper, the selected research design is the ex-post facto design. This is because this research relies on time series data. The ex-post facto design is an empirically based research design that determines the cause-and-effect relationship between the dependent and independent variables. This approach is characterized by the researcher’s inability to manipulate the data under examination.
Model Specification
Following Abdullah & El-Rasheed (2021), the paper derived an asymmetric ARDL framework from the conventional ARDL as follows:
![]()
GDP is the economic growth rate, EPG represents electricity power generation, CPTG reprersents capital growth, and ln LBR denotes log of labour. Subscript t is the period and μ is a stochastic error term.
Nature and Sources of Data
The study spans 1980 to 2022 and uses time series data for Nigeria. The impact of electricity generation on economic growth is empirically examined. The data on electricity power generation (EPG) (measured as electricity production from all sources), investment (CPTG) (measured as Gross Fixed Capital Formation % of GDP), Economic Growth (GDP, constant 2015 US$) and labour (LBR) (labour force, total) were sourced from World Development Indicators (WDIs) of the World Bank[1]. All the variables were used based on the Cobb-Douglas production function highlighted earlier.
METHOD OF DATA ANALYSIS
The paper examined the relationship between electricity generation and economic growth in Nigeria as well as how electricity generation drives economic growth using the Nonlinear Autoregressive Distributed Lag Model (NARDL) approach by Shin et al. (2014). Shin et al. (2014) proposed the use of the Nonlinear ARDL cointegration technique, which involves the decomposition of positive and negative partial sums. This technique enables the discovery of asymmetric effects in both the long run and short run periods (Ibrahim, 2015 and Abdullah & El-Rasheed, 2021).
The Nonlinear ARDL specification enables the simultaneous analysis of non-stationarity and nonlinearity by using an error correcting model. Additionally, it has the benefit of applicability regardless of the integration order of the variables, whether they are integrated of order 0 (I(0)), order I(1), or a combination of both. This allows for statistical inferences to be made on long-term estimations. These are not achievable using alternative methods of cointegration analysis. However, similar to the traditional ARDL method, the Nonlinear ARDL cointegration methodology is not applicable when I(2) series are present. The nonlinear autoregressive distributed lag (ARDL) model is an innovative method used to identify nonlinearities by examining the differences in long-term and short-term asymmetries within economic series. This is an extension of the traditional ARDL concept. The nonlinear autoregressive distributed lag (ARDL) model is more effective in identifying cointegration in small sample sizes, as demonstrated in Shin et al (2014) study.
Transforming Equation (6) into an ARDL Model results as follows:
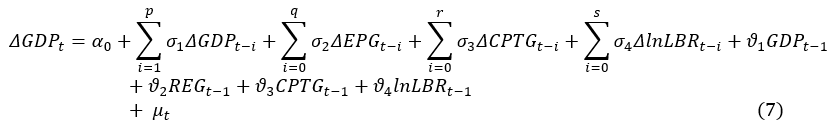
Equations 6 and 7 clearly express the short run and the log run coefficients. Δ is a first difference operator. α0 is constant. σ1, σ2, σ3 and σ4 are short run estimates coefficients while ϑ1, ϑ2, ϑ3 and ϑ4 represent the long run estimates. μ is the stochastic error term.
In order to examine the impact of electricity power generation on economic growth, the paper followed Shin et al., (2014) that proposed transforming a linear equation into asymmetric form by replacing EPG with positive and negative components as follows:
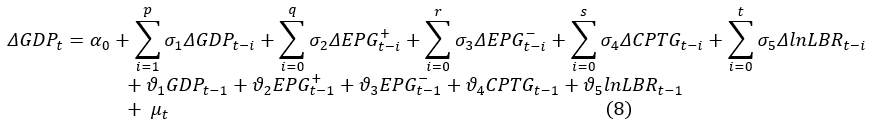
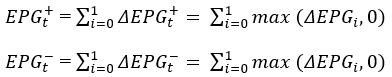
EPG is decomposed into increasing and decreasing partial sums as;
![]()
The partial sum for the positive as well as negative changes in EPG are generated through the following formular:
As in the conventional ARDL, the first part with the change symbol is used to analyse the short run asymmetric relationship and the second part is for long run relationship. The long run asymmetric impact can be tested with the use of Wald test by evaluating the Null hypothesis for an asymmetry. H0: ϑ+= ϑ–. The alternative is H1: ϑ+⧺ ϑ–.
RESULTS AND DISCUSSIONS
Descriptive Statistics
This section starts with some pre-estimation tests.
Table 1: Descriptive Statistics
| GDP | CPTG | EPG | LBR | |
| Mean | 0.404906 | -0.978432 | 29.03658 | 46204768 |
| Median | 1.060704 | 1.393454 | 30.24166 | 43015210 |
| Maximum | 12.27614 | 40.38866 | 41.86490 | 73272344 |
| Minimum | -15.69786 | -30.17164 | 17.59131 | 31936585 |
| Std. Dev. | 5.113238 | 13.58663 | 7.979833 | 11989757 |
| Skewness | -0.913508 | 0.113901 | -0.186265 | 0.650824 |
| Kurtosis | 5.039777 | 3.753743 | 1.620628 | 2.309358 |
| Jarque-Bera | 13.43513 | 1.110873 | 3.657590 | 3.890197 |
| Probability | 0.001209 | 0.573822 | 0.160607 | 0.142973 |
| Observations | 43 | 43 | 43 | 43 |
Source: Authors Compilation
The Gross Domestic Product (GDP) exhibits a mean of 0.404906 with a median of 1.060704. The distribution displays negative skewness (-0.913508), indicating a longer left tail, and high kurtosis (5.039777), signifying heavier tails and a more peaked distribution. This departure from normality is confirmed by the Jarque-Bera test (statistic: 13.43513, p-value: 0.001209), suggesting non-normality. The wide range, as evidenced by the substantial standard deviation (5.113238), is noteworthy.
CPTG, with a mean of -0.978432 and a median of 1.393454, demonstrates a distribution that is approximately symmetric (skewness: 0.113901) and mesokurtic (kurtosis: 3.753743). The Jarque-Bera test (statistic: 1.110873, p-value: 0.573822) does not reject the normality assumption, indicating a plausible adherence to a normal distribution. The large standard deviation (13.58663) suggests considerable variability in the data.
The variable EPG, representing a certain aspect, has a mean of 29.03658 and a median of 30.24166. The distribution is slightly negatively skewed (skewness: -0.186265) and platykurtic (kurtosis: 1.620628). The Jarque-Bera test (statistic: 3.657590, p-value: 0.160607) does not provide evidence to reject the normality assumption. The relatively low standard deviation (7.979833) suggests less variability compared to GDP.
Labour data, as represented by LBR, displays a positively skewed distribution (skewness: 0.650824) with a kurtosis of 2.309358, indicating a platykurtic profile. The Jarque-Bera test (statistic: 3.890197, p-value: 0.142973) does not reject normality, suggesting that the data may reasonably approximate a normal distribution. The substantial standard deviation (11989757) underlines significant variability in labor-related observations.
Table 2: Correlation Analysis
| Series | GDP | EPG | CPTG | LLBR |
| GDP | 1.000000 | |||
| —– | ||||
| EPG | 0.092721 | 1.000000 | ||
| 0.5543 | —– | |||
| CPTG | 0.441287 | -0.048820 | 1.000000 | |
| 0.0031 | 0.7559 | —– | ||
| LLBR | 0.254985 | -0.790430 | 0.258905 | 1.000000 |
| 0.0989 | 0.0000 | 0.0937 | —– |
Source: Researcher’s Computations based on E-Views 12 Results
Table 2 presents results of the correlation analysis conducted to examine the possibility of multicollinearity among the independent variables. None of the series appears to be up to 0.80. Therefore, all the series can be in the same equation.
Unit Root Test
Time series data frequently display trends that can be addressed with differencing, mainly to determine the data’s stationarity. To ascertain the stationarity of the series, an essential step in time series analysis is the Philips Perron (PP) unit root test, whose findings are shown in Table 3.
Table 3: Unit Root Test Results Table (Pp)
| Null Hypothesis: the variable has a unit root | |||||
| At Level | |||||
| GDP | EPG | CPTG | LBR | ||
| With Constant | t-Statistic | -3.7612 | -1.1489 | -5.7839 | 2.1343 |
| Prob. | 0.0065 | 0.6873 | 0.0000 | 0.9999 | |
| *** | *** | ||||
| With Constant & Trend | t-Statistic | -4.1491 | -1.7024 | -6.2224 | -0.6820 |
| Prob. | 0.0112 | 0.7326 | 0.0000 | 0.9679 | |
| ** | *** | ||||
| Without Constant & Trend | t-Statistic | -3.7973 | -1.3477 | -5.8464 | 4.4548 |
| Prob. | 0.0003 | 0.1621 | 0.0000 | 1.0000 | |
| *** | n0 | *** | |||
| At First Difference | |||||
| d(GDP) | d(EPG) | d(CPTG) | d(LBR) | ||
| With Constant | t-Statistic | -12.9682 | -7.7490 | -14.8327 | -5.4378 |
| Prob. | 0.0000 | 0.0000 | 0.0000 | 0.0000 | |
| *** | *** | *** | *** | ||
| With Constant & Trend | t-Statistic | -18.0703 | -7.7951 | -14.8776 | -5.9959 |
| Prob. | 0.0000 | 0.0000 | 0.0000 | 0.0001 | |
| *** | *** | *** | *** | ||
| Without Constant & Trend | t-Statistic | -12.8691 | -7.7902 | -14.4796 | -4.1742 |
| Prob. | 0.0000 | 0.0000 | 0.0000 | 0.0001 | |
| *** | *** | *** | *** | ||
Source: Researcher’s Computations based on E Views 12 Results
Notes: a: (*) Significant at the 10%; (**) Significant at the 5%; (***) Significant at the 1%
b: Lag Length based on SIC
c: Probability based on MacKinnon (1996) one-sided p-values.
Table three 3 presents the PP unit root test results. Only GDP and CPTG was found to be significant at level. Therefore, the two are I (0) while the other two variables are I (1).
Cointegration Test
Table 4 presents the analysis of cointegration, using the NARDL bounds technique.
Table 4: NARDL Bounds Test
| F-statistics | 5.638** | |
| Sample Size | I (0) | I (1) |
| 40 | 3.967 | 5.455 |
| 45 | 3.892 | 5.173 |
| Asumptotic | 3.290 | 4.370 |
Source: Researcher’s Computations based on E-Views 12 Results
Note: * signifies significant at 1 % while I (0) and I(1) are respectively the stationary and non-stationary bounds.
Table 4 presents the NARDL Bounds test. The F-statistics at 5.638 signifies cointegration at 1 % level. This is because the F-statistics is higher than the two bounds (upper and lower) at 1% level and since there is cointegration at 1%, the paper did not present the critical values at 5% and 10%.
Non-Linear Autoregressive Distributed Lag Estimates
Table 5 displays the findings of the Non-Linear ARDL estimate in light of the cointregration of the dependent variable with the regressors and the mixed-order of integration derived from the unit root analysis.
Table 5: Nardl Results
| Short-Run Results | Long-Run Results | ||||
| EPG Model | EPG Model | ||||
| COINTEQ* | -0.857 | 0.138*** | Constant | -248.338 | 177.746* |
| 0.494 | 0.155*** | 0.576 | 0.171*** | ||
| 0.365 | 0.208* | 0.426 | 0.231* | ||
| 0.044 | 0.032 | 0.001 | 0.999 | ||
| -35.650 | 13.102** | 14.204 | 0.181 | ||
| Adjusted R-squared | 0.508074 | ||||
| F-statistic | 22.17295*** | ||||
| Breusch-Godfrey Serial Correlation LM Test | 0.3374 | ||||
| Heteroskedasticity Test: Breusch-Pagan-Godfrey | 0.4437 | ||||
Source: Researcher’s Computations based on E-Views 12 Results
Note: ***, **, * signifies significant at 1, 5 and 10 percent while I(0) and I(1) are respectively the stationary and non-stationary bounds. Since there is cointegration at 1%, the paper did not present the critical values at 5% and 10%.
The application of the Non-Linear Autoregressive Distributed Lag (ARDL) framework to the study of electricity power generation (EPG), capital growth (CPTG), and labour dynamics provides nuanced insights into the short-run and long-run interactions between these key economic variables. The findings, as presented in Table 5, unravel the intricate relationships that shape the dynamics of the electricity sector.
Post-Estimation Test Results
The study conducted a few diagnostic tests to assess the model’s stability and applicability as well as the validity of the results. The model did not display serial correlation or heteroskedasticity during the study period, based on the findings in Table 5. Specifically, the absence of serial correlation, as indicated by the insignificant Breusch-Godfrey Serial Correlation LM Test (0.3374), suggests that the residuals do not exhibit systematic patterns over time. The Heteroskedasticity Test (Breusch-Pagan-Godfrey, 0.4437) further indicates no evidence of heteroskedasticity in the residuals, supporting the reliability of the model’s standard errors. Furthermore, the adjusted R-squared (0.508074) highlights the model’s ability to explain approximately 50.81% of the variation in the dependent variable. The significant F-statistic (22.17295) attests to the overall statistical significance of the model, providing confidence in the reliability of the findings.
Table 6: Coefficient symmetry tests
| Null hypothesis: Coefficient is symmetric | |||
| Degrees of freedom (simple tests): F (1,34), Chi-square (1) | |||
| Variable | Statistic | Value | Probability |
| Long-run | |||
| EPG | F-statistic | 0.682999 | 0.0143 |
| Chi-square | 0.682999 | 0.0086 | |
| Short run | |||
| EPG | F-statistic | 0.645926 | 0.0003 |
| Chi-square | 0.456456 | 0.0762 | |
| Joint (Long-Run and Short-Run) | |||
| EPG | F-statistic | 0.175845 | 0.0548 |
| Chi-square | 0.567396 | 0.0006 | |
Source: Researcher’s Computations based on E-Views 12 Results
From table 6, the null hypothesis of symmetry of coefficients is rejected for short run. Long-run and the joint (Long-run & short-run). The p-values in all the cases are less than 0.10. This supports the papers idea of estimating a non-linear model.
Stability Test Result
To test for the stability of the model, the paper conducted a stability test using the CUSUM Squares presented in Figure 1. The economic growth model was shown to be stable during the investigation period by the stability test results in Figure 1 because the chart plots at the 5% significant level fall within the critical constraints.
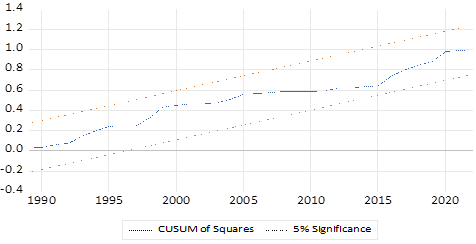
Figure 1: Stability Tests Result
DISCUSSION OF FINDINGS
In the short run, the significant coefficient of the error correction term (COINTEQ) at -0.857 underscores the presence of a robust adjustment mechanism. This implies that deviations from the long-run equilibrium in the electricity power generation sector were corrected in the short run. The differential impacts of positive (ΔEPG^+) and negative (ΔEPG^-) changes in electricity power generation are noteworthy. The more pronounced effect of positive changes suggests that increases in electricity power generation have a greater and more immediate impact on the Economic growth compared to decreases which is in conformity with the work of Azam et al (2021).
Conversely, changes in capital growth (ΔCPTG) did not exhibit short-run significance, indicating that fluctuations in capital growth did not instantaneously affect the Economic growth. In contrast, the significant negative impact of changes in the natural log of labour (ΔlnLBR) implies that alterations in labour dynamics had tangible and adverse effects on the Economic growth in the short run.
Turning to the long-run perspective, the constant term’s significance at the 10% level (-248.338) suggests a persistent, albeit relatively muted, impact in the absence of changes in the independent variables (EPG<CPTG and lnBR). In the long run, the positive and significant coefficient (0.576) associated with EPG signified its pivotal role as a driving force in the electricity power generation sector. Lagged variables for capital growth (CPTG_(t-1)) and the natural log of labour (lnBR_(t-1)) failed to achieve significance, indicating a limited long-run impact of these variables on the dependent variable.
The economic implications are profound. The significant long-run effect of electricity power generation implies that sustained efforts in enhancing power generation capacity are crucial for economic growth. Conversely, the lack of immediate impact from changes in capital growth suggests that the economic system may not be as responsive to short-term fluctuations in capital investments. The negative short-run impact of labor dynamics underscored the importance of stable and well-managed labor markets for the health of the electricity power generation sector.
CONCLUSION AND RECOMMENDATIONS
The study unveils crucial insights into the electricity power generation sector. The short-run analysis underscores the sector’s prompt correction of deviations from equilibrium, with positive changes in electricity generation exerting a more immediate impact. Long-run dynamics revealed the paramount importance of sustained investments in power generation for economic growth. However, capital growth and lagged labour dynamics exhibited limited influence in the long run. These findings have emphasized the need for strategic focus on power generation capacity enhancement. Stable labour markets proved crucial in mitigating short-run effects, while the sector displayed resilience to immediate changes in capital growth. The paper robust diagnostics validate the reliability of the model, providing policymakers and industry stakeholders with necessary actionable information to optimize economic development through effective management of the electricity power generation.
Considering the revealed short-run impact of positive changes in electricity power generation in the results, the Federal Government through the Ministry of Power and legislation fron National Assembly should consider incentivizing and promoting initiatives that lead to increased electricity production. This can contribute to a more immediate boost in economic activity. Also, due to lack of short-run significance for changes in capital growth, policymakers may focus on longer-term strategies for capital investment in the electricity sector. Additionally, addressing the adverse short-run impact of labor dynamics necessitates putting in place measures to stabilize labor markets for sustained sectoral health through private sector participations.
Emphasizing the significant long-run impact of electricity power generation underscores the need for sustained investments and policies that foster the growth of power generation capacity. Long-term planning should prioritize initiatives that ensure a reliable and expanding electricity supply. Policymakers should consider developing and implementing policies that align with the identified economic implications. This includes targeted measures to stimulate electricity power generation, promote stable labor markets, and encourage sustained investments in the sector for long-term economic prosperity.
REFERENCES
- Abdullah, H., & El-Rasheed, S. (2023). A Re-examination of the Impact of Credit on Economic Growth in Malaysia: Further Evidence from the Asymmetric ARDL Cointegration Technique. Indonesian Economic Review, 3(2), 14-29.
- Ibrahim, M. H. (2015). Oil and food prices in Malaysia: a nonlinear ARDL analysis. Agricultural and Food Economics, 3, 1-14.
- Shin, Y., Yu, B., & Greenwood-Nimmo, M. (2014). Modelling asymmetric cointegration and dynamic multipliers in a nonlinear ARDL framework. Festschrift in honor of Peter Schmidt: Econometric methods and applications, 281-314.
- Ebhotemhen, W. (2021). Economic growth and electricity generation in Nigeria. Journal of Economics and Allied Research, 6 (1), 264-278.
- Oryani, B., Koo, Y., & Rezania, S. (2020). Structural vector autoregressive approach to evaluate the impact of electricity generation mix on economic growth and co2 emissions in Iran. Energies, 13. https://doi.org/ 10.3390/en13164268
- Abur, C. C., Angahar, J. S., & Terande, T. J. (2022). Electricity generation and economic growth in Nigeria: Is there any link? Asian Journal of Current Research, 7(1): 1-7.
- Adegbie, F. F., & Fakile, A. S. (2011). Company income tax and Nigeria economic development. European Journal of social sciences. 22(2):309-32.
- Nelson, S. K., Xiaoyong, C., & Chomen, D. A. (2022). How does electricity generation affect economic growth? Empirical evidence from 30 African countries. Available at SSRN: https://ssrn.com/abstract=4087978 or http://dx.doi.org/10.2139/ssrn.4087978
- Nyasapoh, M. A., Debrah, S. K., & Twerefou, D. K.(2023).Long-term electricity generation analysis and policy implications – the case of Ghana,Cogent Engineering.https://doi.org/1080/23311916.2023.2209996
- Szustak, G. D., Abrowski, P., Grado, N. W., & Szewczyk, Ł. (2022). The relationship between energy production and GDP. Evidence from selected European economies. Energies, 15, 50. https:// doi.org/10.3390/en15010050
- National Bureau of Statistics (2023). Nigerian Gross Domestic Product Q2 2023. Retrieved from https://nigerianstat.gov.ng/elibrary/read/1241369.
- Dekle, R; & Hamada, K. (2015). Japanese monetary policy and international spillovers. Journal of International Money and Finance, 52: 175–99.
- Nigeria’s National Development Plan (NDP), 2021 – 2015, Volume 1. Federal Ministry of Finance, Budget and National Planning
- Akindele, O. O. (2019). Electricity generation and national development in Nigeria: The perspective of auto-regression distribution lag (ARDL) bond test analysis. Journal of Economics and Finance, 2 (12), 156-168.
- Singh, R. P., & Nachtnebel, H. P., (2016). Analytical hierarchy process (AHP) application for reinforcement of hydropower strategy in Nepal, Renewable and Sustainable Energy Reviews, 55(1), 43-58.
- Olusola, G. & Taiwo N. O. (2019). The impact of energy generation on economic growth in Nigeria. International Journal of Management, Accounting and Economics, 5(5), 1-12.
- Oyeleke, O. J., & Akinlo, T. (2019). Energy generation and economic growth: empirical evidence from Nigeria. Enviroment Development, and Sustainability, 3(5), 1-5. https/doi.org/10.1007/s/0668-019-00476-4
- Anam, A., Muhammad, R., Muhammad S., & Jiahai Y. (2021). An empirical analysis of the non-linear effects of natural gas, nuclear energy, renewable energy and ICT-Trade in leading CO2 emitter countries. Policy towards CO2 mitigation and economic sustainability, Journal of Environmental Management, (3) 286, https://doi.org/10.1016/j.jenvman.2021.112232.
- Hlongwane, N. W., & Daw, O. D. (2021). An increase of electricity generation can lead to economic growth in South Africa. MPRA Paper 111018, University of Munich, Germany.
- Su, M., Chen, C., & Yang, Z. (2016). Urban energy structure optimization at the sector scale: considering environmental impact based on life cycle assessment. Journal of Cleaner Production, 112, 1464-1474. https://doi.org/10.1016/j.jclepro.2015.01.059.
- Onyeisi, S. O., Odo, S. I., & Attamah, N. (2016). Power generation capacity and economic growth in Nigeria. A causality approach. European journal of business and management (8) 32, 222-1905.
- Bebonchu, A., & Chelsea, H. (2018). The effect of renewable and nonrenewable electricity generation on economic growth, Energy Policy, (1) 112, 111-118. https://doi.org/10.1016/j.enpol.2017.10.015.
- Jhingan, M.L (2006). Advanced Economics Theories: Vrinda (P) Ltd, New Delhi
- Todaro, M. P., & Stephen, S. C. (2011). Economic Development. 11th ed pearson education limited https://www.weforum.org/agenda/2018/01/gdp-frog-matchbox-david-pilling-growth-dilision
FOOTNOTE
[1] https://databank.worldbank.org/source/world-development-indicators