
Effect of Public Investment on Private Investment in Côte d’Ivoire: A Long-Term Analysis
- Pierre GUEI
- 3402-3411
- Aug 24, 2024
- Economics
Effect of Public Investment on Private Investment in Côte d’Ivoire: A Long-Term Analysis
Pierre GUEI
Department of Economics and Management, Université Péléforo Gon Coulibaly de Korhogo, Côte d’Ivoire
DEECAF, Rennes, France
DOI: https://dx.doi.org/10.47772/IJRISS.2024.807260
Received: 29 June 2024; Revised: 18 July 2024; Accepted: 23 July 2024; Published: 24 August 2024
ABSTRACT
Côte d’Ivoire has decided to boost private investment by increasing it to 30% of GDP, following a substantial reduction or even elimination of its debt. To achieve this, the authorities have opted to increase public investment through the construction of infrastructure and the development of Public-Private Partnerships (PPP). This strategy is based on the hypothesis of crowding-in effects, reflecting the positive impact of public investment on private investment. This article seeks to verify the existence of such effects in Côte d’Ivoire, within the framework of a dynamic analysis. The use of the Autoregressive Distributive Lag (ARDL) model, in the form of Error Correction Models (ECM), has made it possible to show crowding-out effects in both the short and long term. The results recommend redirecting public investment towards more productive sectors and call for caution in an increasing public investment.
Keywords: public investment, private investment, Crowding-in, Crowding-out, ARDL, Côte d’Ivoire
JEL Classification: H54, E22, R42, C32
INTRODUCTION
After benefiting from debt reduction and cancellation, Côte d’Ivoire has relied heavily on public investment to boost its economic growth. These public investments have enabled the country to increase private investment which is part of GDP. This has been done through building infrastructure and creation a favourable condition for investment. To this end, a national Public Private Partnership Steering Committee (PPP) was set up in 2012 to provide a framework for promoting, validating and guiding partnership projects. The aim of the Ivorian authorities is to increase the contribution of private investment to 30% of GDP by 2030 (CNP-PPP, 2022, p.3).
Since its independence, Côte d’Ivoire has always considered that the private market is the main engine of growth, in line with the Monterrey[1]Consensus. In this respect, private investment can be decisive. With low national savings, Côte d’Ivoire has been able to rely on Official Development Assistance (ODA) and Foreign Direct Investment (FDI) to boost its economy (Plourde, 2006). The public investments made, in conditions of budgetary constraint, consisted essentially of attracting these private investments through the construction of infrastructures, such as roads, bridges or the establishment of free trade zones, and through the introduction of a particularly attractive investment code. In certain situations, the share of public investment in GDP increases while that of private investment falls. This was the case from 1964 to 1968 and from 1975 to 1983 (see Fig. 1). In other situations, they moved in the same direction. This has been the case since 2012 but also from 1990 to 2011.
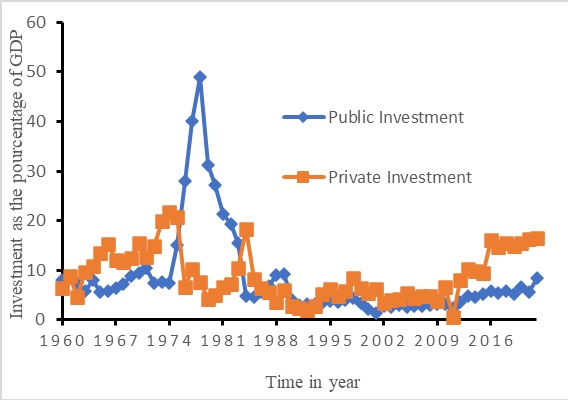
Fig. 1: Evolution of private and public investment rates in Côte d’Ivoire
The literature provides great explication about these evolution. An increase in public investment can have positive impact on private investment (Crowding-in effect). If this increase leads to a decrease in private investment, we are a crowding-out effect. This ambivalence comes from the fact that the budgetary authorities could compete with private players for access to finance. The importance of private sector financing by the financial sector on private investment may be a determining factor in this crowding out. Several other factors could be mentioned. However, a true understanding of the relationship between public and private investment necessarily involves a short- and long-term analysis (Creel & al., 2015).
The aim of this paper is to determine the nature of the impact of public investment on private investment in Côte d’Ivoire, from a long-term perspective. The challenge of such a study lies in the opportunity to increase caution about the dynamics of public investment (Lansley, 2023) in Côte d’Ivoire.
This paper is organised as follows. Section 2 provides the enriching experiences for the empirical study. Section 3 discusses the methodology adopted. Section 4 provides the results of this study followed by their interpretation. Section 5 concludes with some economic policy recommendations.
LITERATURE REVIEW
The economic literature identifies 2 positions regarding the relationship between public investment and private investment. The first, of neoclassical tendency, is supported by Barro (1989), Pradhan & al. (1990), Haque & Montiel (1993), Voss (2002) and Narayan (2004). The latter support the crowding-out effect of public investment on private investment. They highlight the competition between public borrowing and private borrowing for the financing of investments. Public deficits lead to an increase in the real interest rate, discouraging private investors. Other arguments such as the delay in carrying out public investments or the delay in paying domestic loans can negatively impact private investment and lead to the disappearance of businesses.
The second, of Keynesian tendency, is supported by Enrenburg & Wohar (1995), Pereira (2001), Naqvi (2002) and Hyder (2001) defend a crowding-in effect. Indeed, public investments make it possible to reduce the production costs of private companies and facilitate their investments. Thus the increase in the marginal efficiency of capital becomes the transmission channel of this crowding-in effect (Cavallo & Daude, 2011). Private-public complementarity is full of enormous advantages (Pereira & De Frutos, 1999) which can be analyzed in terms of skills creation, technological innovation and improvement in productivity.
This debate is far from being settled in both developed and developing countries. The study by Creel, & al. (2015) covering 4 developed countries, namely France, the United States, the United Kingdom and Germany, shows divergent results. Crowding-in is observed in France while crowding-out prevails in the United States. The results relating to the last 2 are not conclusive. The authors used a VAR model and quarterly data from 1966 to 2014, except for Germany where the study period used begins in 1991.
The study by Shen et al. (2018) analyzes the Crowding-out effect in low-income countries. It highlights the crowding-out effect of public investment, based on a New Keynesian model of a small open economy. However, it shows that external financing attenuates the crowding-out effect, by increasing available resources. The authors also note the perverse effects of imports which ultimately render public investment ineffective.
Studies covering both developed and developing countries show, on the contrary, a crowding-in effect of public investment. That of Mahmoudzadeh & al. (2013) covering the period 2000-2009 shows that the crowding-in effect is stronger in developing countries than in developed countries. To do this, they use a compound error model.
Studies in sub-Saharan Africa, although recent, show equally mixed results. The study by Ouédraogo & al. (2019) on 44 of these countries and covering the period 1960 to 2015 generally highlights a crowding-in effect. Only 21 countries experience a crowding-in effect. Divergences are remarkable in terms of the impact of public investment on private investment. This impact is stronger when the private sector is large. They use a panel model taking into account observable and unobservable heterogeneities, in addition to individual interdependence in order to guarantee robust and contingent results.
The recent study by Chuba (2021) provides more precision, concerning Nigeria. For this author, the crowding-in effect of public investment concerns that obtained by external financing and not that financed by national borrowing. For this author, the crowding-in effect depends on the sources of funding for public investment. To do this, it relies on short and long term analysis.
Most studies neglect the dynamic effects of public investment on private investment. However, Fournier & Johansson (2016) emphasize the importance of distinguishing short-term and long-term effects. This distinction explains the lack of unanimity and certainty on the prevalence of crowding-in. Recent studies (Saidjada & Jahan, 2018), using the ARDL model, have shown the prevalence of the crowding-out effect of public investment. This study on Côte d’Ivoire is motivated by the incompleteness of previous studies and complements the study on the impact of public investment on private investment in Sub-Saharan African countries.
METHODOLOGY
A. Model Specification
The model in this study seeks to estimate the importance of public investment on private investment in Côte d’Ivoire. It is based on a specification close to that of Furceri & Sousa (2011) which, unlike the model used in this study, tests the impact of public spending on private investment. This specification is also similar to that of Creel, & al. (2015) who test the link between public investment and private investment.
We use the ARDL(p,q) model which belongs to the family of dynamic models. The latter make it possible to grasp the temporal effects which underlie the relationship between private investment and public investment. In this case, the ARDL(p,q) model is presented in the form of an Error Correction Model (ECM). Indeed, this model makes it possible to express private investment according to its delays, the explanatory variables and the delays of the latter. Thus, this dynamic model ARDL(p,q) can be expressed in the form of the following equation:
![]() (1)
(1)
Where εt is the error term, identically and independently distributed (iid), following the reduced centered normal law ![]() ; αi, is the coefficient of inertia; et βo the short-term effect of X on
; αi, is the coefficient of inertia; et βo the short-term effect of X on ![]() (Private Investment). X is a vector of variables
(Private Investment). X is a vector of variables ![]() (Public Investment),
(Public Investment), ![]() (Real GDP) and
(Real GDP) and ![]() (GDP Deflator taken as a proxy for inflation). All data covering the period 1960-2022 in the model comes from the Central Bank of West African States (BCEAO) database and were taken in logarithmic form.
(GDP Deflator taken as a proxy for inflation). All data covering the period 1960-2022 in the model comes from the Central Bank of West African States (BCEAO) database and were taken in logarithmic form.
The short-term effect of the public investment ( ![]() ) is expressed by coefficient
) is expressed by coefficient ![]() . Parameters and are delays determined optimally by minimizing Akaike information criteria (AIC, SIC et HQ).
. Parameters and are delays determined optimally by minimizing Akaike information criteria (AIC, SIC et HQ).
We deduce equation 2 which is the following long term equation:
![]() (2)
(2)
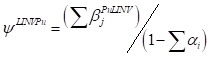
Where is the error term, following the reduce normal law ![]() ; To, is the constant and Ψ, a coefficient expressing the long-run effect of X:
; To, is the constant and Ψ, a coefficient expressing the long-run effect of X:
![]() (3)
(3)
The long run effect of ![]() is defined by equation 4
is defined by equation 4
 (4)
(4)
B. Estimation Procedure
The estimation procedure begins with stationarity tests, and then, make appropriate corrections and estimate equation 2. Autocorrelation, heteroscedasticity and stability tests of the coefficients will be carried out after the estimation.
1) Stationarity Test: We used the augmented Dickey-Fuller test for the analysis of stationarity, without trend, then with trend. The particularity of this analysis was to distinguish between a variable following a TS (Trend-stationary) process, representing a deterministic type non-stationarity, and a variable following a DS (Difference stationary) process, representing a random type non-stationarity.
Several authors have shown the harmful consequences of confusion between types of processes (Chan, & al., 1977; Nelson & Kang, 1981 and Bourbonnais & Terraza, 2016 ). Indeed, treating a TS process as a DS process leads to introducing an artificial disturbance, when we apply the difference filter to make it stationary. Applying the ordinary least squares method to make a DS process stationary artificially accentuates the autocorrelation of the residuals (Bourbonnais & Terraza, 2016, p.158). We therefore corrected the TS variables using the OLS method which consists of regressing the TS variable on the temp variable in order to eliminate this bias when estimating the model.
2) Model Estimation: The estimation of this ARDL model in the form of ECM is subject to the existence of the long-term relationship. If the test is conclusive, the choice of the optimal ARDL model is necessary in order to have the best results. For the same reasons, we carry out tests of autocorrelation, heteroskedasticity, and stability of the model coefficients.
RESULTS AND ANALYSIS
The results of the unit root test (Table 1) show that all variables are DS, except the variable ![]() which is TS. The latter is therefore integrated of order 0. The other variables are integrated of order 1. Thus, the ARDL model can be used for the estimation of our model.
which is TS. The latter is therefore integrated of order 0. The other variables are integrated of order 1. Thus, the ARDL model can be used for the estimation of our model.
| TABLE I: Augmented dickey fuller unit root test | ||||||
| Variables | Level | First difference | Stationarity type | Order of integration | ||
| No trend | trend | no trend | trend | |||
| -1.385 | -4.346*** | – | – | TS | I(0) | |
| -0.5893 | -0.02 | |||||
| -0.83 | -1.845 | -6.283*** | -6.221*** | DS | I(1) | |
| -0.81 | -0.6827 | 0 | 0 | |||
| -1.308 | -1.45 | -5.627*** | -5.567*** | DS | I(1) | |
| -0.6255 | -0.8456 | 0 | 0 | |||
| -1.214 | -0.662 | -5.916 | -5.981 | DS | I(1) | |
| -0.6677 | -0.9755 | 0 | 0 | |||
| ***Significance at 1%, ** Significance at 5%, * Significance at 10% | ||||||
| NB : The numbers are the test statistics and those in parentheses are the MacKinnon applied p-values. | ||||||
| Source : Author’s calculation from Stata 16 | ||||||
In order to estimate the model in the form of an ECM model, we need to test the existence of long-term relationships. The test of Pesaran et al. (2001) is used for this purpose, and allows tests to be carried out at terminals B(0) and B(1), according to different levels of significance (10%, 5% and 1%). The results of this test (Table 2) show that the calculated F-statistic is superior to the tabulated F-statistic whatever the level of significance at the B(1) terminal. We note that the calculated t-statistic is less than the tabulated t-statistic at the B(1) limit and is not greater than the tabulated t-statistic at the B(0) limit. We conclude that the null hypothesis of the non-existence of a long-term relationship is rejected.
| TABLE 2: boundary test for the existence of Pesaran & Al. (2001) long-term relationships | ||||
| F-Statistic | t-Statistic | |||
| B(0) | B(1) | B(0) | B(1) | |
| 1% | 4.734 | 6.194 | -3.536 | -4.514 |
| 5% | 3.409 | 4.63 | -2.886 | -3.806 |
| 10% | 2.83 | 3.934 | -2.56 | -3.444 |
| p-value | 0 | 0.001 | 0 | 0.001 |
| Optimal Model selected : ARDL(1,0,2,0) | ||||
| F-calculated = 7.555 et t-calculated=-5.295 | ||||
| Source : Author’s calculation from Stata 16 | ||||
Based on the Akaike information criteria, we retain the ARDL(1,0,2,0) model as the optimal model. The short and long term estimation of this model is summarized in Table 3.
The long-term model estimation results show a negative and significant impact of public investment on private investment. An increase of 1 billion FCFA(1.631 million Dollar) in public investment leads to a decrease of just over 530 million FCFA (862784.88 Dollar). They clearly show the importance of economic growth in accelerating private investment. The sensitivity of private investment to growth is relatively high, around 0.9.
The short-term analysis shows that private investment is less sensitive to independent variables variation. We note the presence of the crowding-out effect of public investment, considering a significance threshold of 10%. The impact of public investment on private investment is relatively less significant than in the long term, but remains negative. These results also reveal a positive and significant sensitivity of growth to the dynamics of private investment. A 1% increase in growth leads to 7.4% increase in private investment. Inflation appears to be a significant determinant of the private investment growth.
The model highlights the good capacity of private investment to return to its long-term equilibrium trajectory after having deviated from it. Indeed, when a shock deviates private investment from its trajectory, this deviation is corrected to 77%, significantly, in just one year (Table 3, 13th line).
Ultimately, the results were unable to demonstrate a crowding-in effect of public investment. Public investment does not seem to have been directed towards the most productive and driving sectors for a poor country. Mixed investments, in particular, have been more concentrated in the Energy & Oil sector, at 45%. Only 5% was allocated to the Water & Health sector over the period 2012-2022. In 2023, for every 1,000 live births, 52.4 children died. This infant mortality rate is well above the average for sub-Saharan Africa (48.6). However, the WHO (2001) points out the importance of health for the dynamics of private investment and economic growth.
The education sector is increasingly neglected. Public spending in this sector has fallen from 21.5% of total public spending in 2008 to 12.8% in 2023, according to World Bank data. The Nested-generation model with human capital accumulation, may help to understand this lack of efficiency in public investment. In the absence of significant investment in education, a country can be trapped in a low-development trap (Aghion & Howitt, 2010, p.265).
| TABLE 3: Estimation of the ardl model in ecm form | ||||
| Variables | Coefficient | Std. Err | t-statistic | p-value |
| Long term ARDL model | ||||
| L.lpuinv | -0.5308024** | 0.245656 | -2.16 | 0.036 |
| L.lgdp | 4.130038*** | 1.088086 | 3.8 | 0 |
| L.ldg | 0.9155839*** | 0.3607817 | 2.54 | 0.014 |
| Short-term ARDL model | ||||
| D.lpuinv | -0.4116097* | 0.2222371 | -1.85 | 0.07 |
| D.lgdp | 7.371392*** | 1.823974 | 4.04 | 0 |
| LD.lgdp | -2.84375* | 1.492252 | -1.91 | 0.062 |
| D.ldg | 0.7099877** | 0.3334114 | 2.13 | 0.038 |
| Cste | -44.93213*** | 15.51262 | -2.9 | 0.006 |
| L.ECM | -0.775448*** | 0.1464539 | -5.29 | 0 |
| ***Significance at 1%, ** Significance at 5%, * Significance at 10% | ||||
| Model selected according to the Akaike criteria (AIC):ARDL(1,0,2,0) | ||||
| Maximum number of delays considered: 6 | ||||
| Number of degrees of freedom/Number of observation: 57/63 | ||||
| R2-ajusted = 0.3935 | ||||
| Log likelihood = -34.275139 | ||||
| Source : Author’s calculation from Stata 16 | ||||
The following tests allow us to assess the quality of these estimates. The errors are not autocorrelated as the results attest (table 4). The results of the Breusch-Godfrey and Durbin Watson tests are consistent. The first test reveals a p-value well above 5% so we cannot reject the hypothesis H0 of absence of autocorrelation. The second test reveals a Durbin Watson statistic close to 2, which confirms the absence of autocorrelation of errors.
White’s homoscedasticity test (White,1980) summarized in Table 5 shows an absence of heteroskedasticity. The p-value corresponding to White’s Chi2 statistic is well above 5%, which attests to the presence of homoscedasticity with a confidence interval of 95%.
| TABLE 4: Autocorrelation tests of breusch-godfrey and durbin-watson errors | ||
| LM de Breusch-Godfrey with one delay and one differentiation of order 1 | Chi2 | p-value |
| 1.291 | 0.2559 | |
| Durbin-Watson d-statistic( 6, 57) = 1.853969 | ||
| NB : the Breusch-Godfrey test poses as H0 the absence of serial correlation between the errors; the Durbin-Watson test is to be compared with the value 2 | ||
| Source : Author’s calculation from Stata 16 | ||
| TABLE 5: Information matrix test composed of white, skewness and kurtosis tests | |||
| Tests | Chi2 | df | p-value |
| Hétéroscédasticité | 24.23 | 20 | 0.2325 |
| Skewness | 5.77 | 5 | 0.1105 |
| Kurtosis | 1.2 | 1 | 0.2479 |
| Total | 31.21 | 26 | 0.2207 |
| The heteroscedasticity test corresponds to the White test and the other tests correspond to the symmetry tests with respect to the normal (Skewness) and kurtosis (Kurtosis). | |||
| Source : Author’s calculation from Stata 16 | |||
The results of the recursive Cusum test, carried out to assess the stability of the estimated relationship over time, can be represented graphically. If the curves leave the band representing the 95% confidence interval, then we can consider that the model is unstable (Brown & al., 1975). The graph shows the stability of the model, which means that the investment behavior of private agents in Côte d’Ivoire remained stable throughout the study period (Fig. 2).
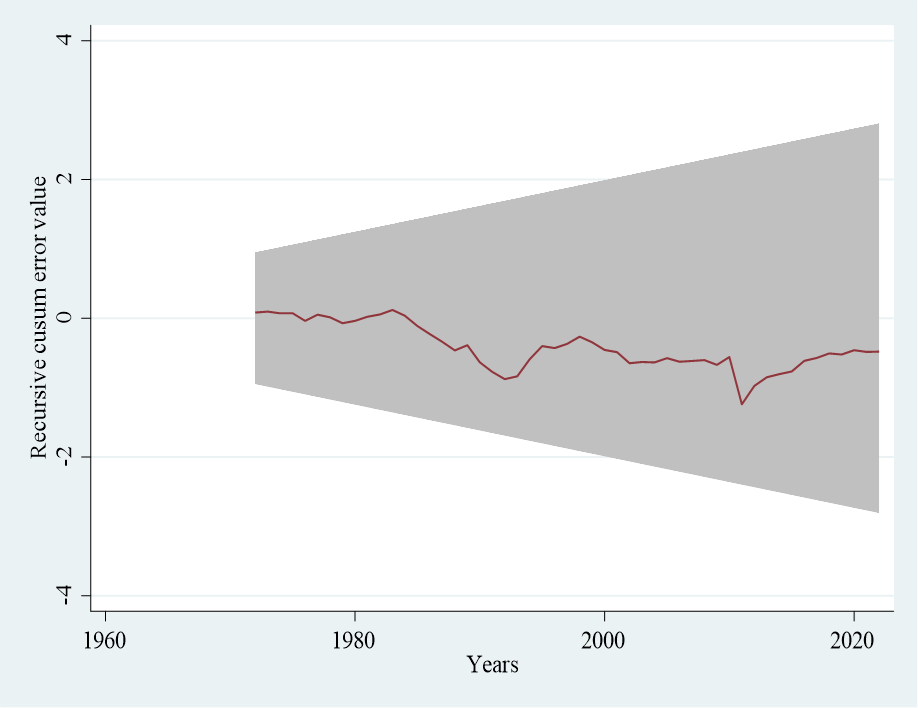
Fig.2: Recursive cusum representation with 95% confidence band
This stability questions the new investment strategy centered on public private partnership (PPP), promoted since independence and intensified since 2012. The question is whether the new public investment strategy has fundamentally modified investment behavior private in Côte d’Ivoire. The absence of long-term data after 2012 did not allow us to carry out a structural break test, since the study covers the period 1960-2021.
CONCLUSION
In recent years, Côte d’Ivoire, thanks to the reduction and then cancellation of its debt, has chosen to invest massively in infrastructure, but also in the development of the entrepreneurial sector. The goal is to boost economic growth, by bringing private investment to more than 30% of GDP. The essential question was whether such public investments could crowds in private investment (crowding-in effects).
The objective of this article is to verify the existence of crowding-in effects of public investment in Côte d’Ivoire. Based on the importance of dynamic analysis, we have mobilized an ARDL(p,q) model in ECM. The results reveal the predominance of crowding-out effects of public investment, more pronounced in the long term than in the short term. They depart from the studies carried out by Ouédraogo & al. (2019) which did not take into account short and long term analysis. Furthermore, inflation and economic growth are determining factors in the dynamics of private investment.
Ultimately, the results support calls for caution (Saker, 1993 and Lansley, 2023). They suggest the need to direct more public investment towards the education and health sectors. Less investment in these sectors could be a trap for slow development.
REFERENCES
- Aghion, P. & Howitt, P.(2010). L’Economie de la croissance. Economica, Paris, p.440
- Barro, R. J. (1989). The ricardian approach to budget deficits. Journal of Economic Perspectives, 3(2), 37-54.
- Bourbonnais, R., & Terraza, M. (2016). Analyse des séries temporelles, applications à l’économie et à la gestion,. Paris: Dunod.
- Brown, R. L., Durbin, J., & Evans, J. M. (1975). Techniques for Testing the Constancy of Regression Relationships over Time. (B. Publishing, Éd.) Journal of the Royal Statistical Society, 37(2), pp. 149-192.
- Cavallo. (2011). Public Investment in Developing Countries: A Blessing or a Curse? Journal of Comparative Economics, 39(1), pp. 65-81.
- Chan, K. H., Hayya, J. C., & Ord, J. K. (1977). A Note on Trend Removal Methods: The Case of Polynomial Regression versus Variate Differencing. Econometrica, 45(3), pp. 737-744.
- Chuba, M. (2021). Crowding-Out and Crowding-In Effects of Public Borrowing on Private Domestic Investment in Nigeria. International Journal of Research and Innovation in Social Science (IJRISS), 439. doi:DOI:10.47772/IJRISS.2021.51125
- CNP-PPP. (2022). Rapport d’activité.
- Créel, J., Hubert, P., & Saraceno, F. (2015). Une Analyse Empirique Du Lien Entre Investissement Public et Privé. Revue de l’OFCE, pp. 331-356.
- Ehrenburg, S. J., & Wohar, M. E. (1995). Public and Private Investment: Are there Causal Linkages? Journal of Macroeconomics, 17(1), 1-30.
- ESP. (2018). Etude sur le secteur privé et le financement des TPE/PME en Côte d’Ivoire. Rapport final, Abidjan.
- Fournier, J., & Johansson, A. (2016). L’effet de la taille et de la composition des dépenses publiques sur la croissance et les inégalités. Document de travail du Département des affaires économiques de l’OCDE(1344). doi:https://doi.org/10.1787/f99f6b36-en
- Furceri, D., & Sousa, R. M. (2011). The impact of government spendind on the private sector: crowding out versus crowding in effects. Kyklos, 64(4), pp. 516-533.
- Haque, N., & Montiel, P. (1993). Fiscal Adjustement in Pakistan: Some Simulation Results. IMF Economics Review, 40, pp. 471-480. doi:https://doi.org/10.2307/3867323
- Hyder, K. (2001). Crowding-out Hypothesis in a Vector Error Correction Framework: A case study of Pakistan. The Pakistan Development Review, 40(4), 633-650.
- Lansley, S. (2023). Rethinking ‘Crowding Out’ and the Return of ‘Private Affluence and Public Squalor. The Political Quaterly, 94(3).
- Mahmoudzadeh, M., Sadeghi, S., & Sadeghi, S. (2013). Fiscal Spending and Crowding-Out Effect: A Comparison between Developed and Developing Countries. Institutions and Economies, 5(1), pp. 31-40.
- Naqvi, N. H. (2002). Crowding-in or Crowding-out? Modelling the Relationship between Public and Private Fixed Capital Formation using Co-Integration Analysis: The Case of Pakistan 1964-2000. The Pakistan Development Review, pp. 255-275.
- Narayan, P. K. (2004). Do public investments crowd out private investments? Fresh evidence from Fiji. Journal of Policy Modeling, 26, pp. 747-753. doi:https://doi.org/10.1016/j.jpolmod.2004.06.002
- Nelson, C., & Kang, H. (1981). Spurious Periodicity in Inappropriately Detrended Time Series. Econometrica, 49(3), 741-751. doi:https://doi.org/10.2307/1911520
- Ouédraogo, R., Sawadogo, H., & Sawadogo, R. (2019). Impact of Public Investment on Private Investment in Sub‐Saharan Africa: Crowding In or Crowding Out? African Development Review, 31(3), pp. 318-334. doi:DOI:10.1111/1467-8268.12392
- Pereira, A. M. (2001). On the effects of public investment on private investment: What crowds in what? Public Finance Review, 29(1), 3-25.
- Pereira, A. M., & De Frutos, R. F. (1999). Public Capital Accumulation and Private Sector Performance. Journal of Urban Economomics, 46(2), pp. 300-322.
- Pesaran, M. H., Shin, Y., & Smith, R. (2001). Bounds testing approaches to the analysis of level relationships. Journal of Applied Econometrics, 16(3), pp. 289-326.
- Plourde, S. (2006). Les relations entre la Côte d’Ivoire et le FMI sous Houphouët Boigny: le mode de développement ivoirien à l’épreuve de Washington. Dans S. Plourde, Outre-mers (pp. 293-330). doi:doi:https://doi.org/10.3406/outre.2006.4235
- Pradhan, B. K., Ratha, D. K., & Sarma, A. (1990). Complementarity Between Public and Private Investment in India. Journal of Development Economics, 3(1), pp. 101-116.
- Saidjada, K. M., & Jahan, S. I. (2018). Public And Private Investment Nexus In Bangladesh: Crowding-In Or Out? Journal of Developing Areas, 52(4), pp. 115-127.
- Saker, K. (1993). Determinants of Private Investment in Pakistan. International Monetary Fund, 22(16).
- Shen, W., Yang, S.-C. S., & Zanna, L.-F. (2018). Government spending effects in low-income countries. Journal of Development Economics, 133, pp. 201-2019.
- Voss, G. M. (2002). Public and private investment in the United States and Canada. Economic Modelling, 19(4), pp. 641-664.
- White, H. (1980). A Heteroskerdasticity-Consistent Covariance Matrix and a Direct Test for Heteroskedasticity. Econometrica, 48, pp. 817-838.
- WHO. (2001). Macroéconomie et santé : investir dans la santé pour le développement économique. Rapport de la Commission macroéconomique et santé, Genève.
FOOTNOTE
[1] The Monterrey Consensus is an agreement reached by over 60 countries at the International Conference on Financing for Development, held in Monterrey, Mexico, from 18 to 22 March 2002. This agreement concerns the means by which underdeveloped countries have agreed with rich countries, in view of their precarious situation, to finance their development other than through debt. Measures to attract private investment, such as FDI, are strongly encouraged.