
A Multivariate Analysis of Variance Approach to Business Success Factors of SMEs in Nigeria
- Olamide Ebenezer G
- Daisi, F.T.
- 161-173
- Feb 20, 2025
- Business Administration
A Multivariate Analysis of Variance Approach to Business Success Factors of SMEs in Nigeria
Olamide Ebenezer G.*, Daisi, F.T.
Department of Banking and Finance, Osun State Polytechnic, Iree, Osun State, Nigeria
*Corresponding Author
DOI: https://dx.doi.org/10.47772/IJRISS.2025.914MG0013
Received: 04 February 2025; Accepted: 10 February 2025; Published: 20 February 2025
ABSTRACT
This study examined the success factors affecting the activities of SMEs in Nigeria, using the Multivariate Analysis of Variance (MANOVA) approach. The outcome variable of the study is business factors with marketing strategy, business plan, financial resources, and skill acquisition as the explanatory variables. With the exception of business plan with mixed response, all the variables suggest positive effects on SMEs activities in Nigeria. It was suggested that governments at all levels should continue to give priority attention to these variables in policy formulation. This is to sustain the positive contributions of SMEs to the developmental aspirations of the governments, especially in the areas of job creation and poverty reduction.
Keywords: Entrepreneurs, Business Factors, Knowledge, Experience, Inexperience
INTRODUCTION
It has generally been acknowledged that Small and Medium Enterprises (SMEs) are the engine of growth globally (Gumel & Baldai 2021 and Usani et al. 2024). Furthermore, sectors run by SMEs do create dynamic economies of scale that create jobs in an economy. According to Ojekemi and Adebayo (2020), developing economies are now concentrating on the connections that SMEs bring to the economy. Both developed and emerging economies benefit from the contributions that SMEs make to their economies. In Nigeria, the contribution of SMEs to the economic growth of the country was through employment generation and poverty reduction (Gumel & Baldai, 2021). Despite the acknowledgment on the importance of SMEs to economic growth, opinions differ on the relevance of the success factors of these growth enhancing unit of an economy. There is therefore a need to appraise some of the identified factors as enunciated in the literature. This is the main objective of this study, using Osun State of Nigeria as the target point.
Researchers have attributed various factors to the success or otherwise of SMEs in Nigeria. These factors ranges from finance, experience, skill, management style, environment, institution, marketing strategy and gender; among others. In this study, these factors are grouped into financial resources (Gumel & Baldai, 2021; Adeyemo & Olatunji, 2022; Anthony et al. 2023); marketing strategy (Etuk et al.,. 2022; Awotunde et al., 2024 & Usani et al., 2024); skill acquisition (Da Costa & Xiong, 2021; Sinha et al. 2022 & Yadewani, 2023) and business plan (Sugiarto, 2019; Ibrahim, 2019 & Consez & Bivona, 2021). It has never been more urgent for the Nigerian government to make a strong commitment to developing her economy. Nigeria’s economy has been lagging behind many other sub-Saharan economies in recent years, and this slow growth has continued to fuel inequality in the country because growth has failed to trickle down into all the other segments where poverty holds sway (World Bank, 2022). Nigeria’s main societal gimmicks remain its extremely high income inequality and unemployment, which are key factors in the current poverty and inequality.
The nation’s established business rate (3.5%) is noticeably below the average for economies driven by efficiency. These economies currently have an average of almost 8%, which is higher than Nigeria’s. Nigeria’s ranking of 53 out of 60 nations, which represents the lowest known business rates of all the economies that participated in GEM 2022, is especially concerning. According to the 2022 GEM figures, necessity-driven entrepreneurship increased by 18% compared to the previous year, while just two-thirds of Nigerian entrepreneurs were driven by chance, the lowest estimate in five years (GEM Report, 2022). This is sufficient evidence that the nation’s poor economic development and high unemployment rate are now having an impact on the entire system.
Nigeria has participated fourteen times in the Global Entrepreneurship Monitor as of 2022 (GEM Report, 2022). The survey demonstrates the low levels of company activity in comparison to other GEM participating nations. According to the 2022 GEM survey on Nigeria, the growing number of people who think they possess the skills, knowledge, and abilities needed to launch a business has not translated into advanced levels of entrepreneurial planning. Nigeria Statistics does propose that entrepreneurial intentions is in low level. When compared to 2021 and 2019 estimates, this has reduced by nearly 30% (from 15.3% to 10.8%). However, in relation to the African region as a whole, these ratios are meaningfully lower (GEM Report, 2022). The Nigerian mean is much lower three times than that of the African mean. However, the effectively ambitious economies as per the previous GEM survey is over double the Nigerian estimate.
Therefore, the need to analyse business success factors of SMEs in Nigeria has become imperative in order to achieve their meaningful contributions towards providing gainfully employment opportunities, income generation and ultimately, poverty reduction at rural areas such as Osun State. This is the general goal of this study; using desirable statistical tools.
Problem Statement/Justification
Systemic productive capabilities do increase with the expansion of SMEs. The only way to decrease poverty deficits that can result in wealth and employment creation is by promoting economic growth. SMEs have become the main source of income in developing countries that provides a training ground for entrepreneurs and as well as job creation (UNIDO Report, 2022). The economy of the majority of sub-Saharan Africa have benefited from rapid economic growth in recent years, but Nigeria’s growth rate has not been encouraging. Extreme high economic inequality and rising unemployment continue to be the primary societal issues (Nwakalila, 2023). It has therefore become imperative for policy makers to make a tough promise to avert further crisis. In addition, compared to the average for efficiency-ambitious economies, established business rates in Nigeria is meaningfully lower; nearly 8% more than twofold of South African rate at 3.3%. Even more concerning is the fact that, out of all the nations that took part in GEM 2022, the nation had one of the lowest established business rates (ranked 53rd out of 60 economies). Statistics further suggest that in 2021, about 66% of Nigerian entrepreneurs were opportunity-focused. Compared to 2020, essentially inspired entrepreneurship is up by 18%; this is evidence that chronically high unemployment and poor economic development within the country over the past five years is beginning to take its place. In addition, many Nigerian SME owners’ salaries and upkeeps are lower than those in other countries. However, if entrepreneurs can go past the unofficial, necessity-based entrepreneurship that currently dominates the system, it has the ability to close this gap.
The 2022 Global Entrepreneurship Monitor (GEM) survey data confirms that compared to other participating countries Nigeria has little levels of entrepreneurial motion. Such entrepreneurship motion is yet to transform into greater levels of entrepreneurial intent. In comparison to 2021, entrepreneurial inclinations have decreased by almost 30% (from 15.4% to 10.9%) and have roughly halved from 2020 record. Nigeria’s entrepreneurial intentions are significantly lower than the regional average of 3.6 times, which is significantly greater for Nigeria than the African continent. The average Total Early-Stage Entrepreneurial Activities (TEA) for the efficacy-driven economies is 15%, which is 1.6 times higher than Nigeria’s TEA rate, despite the fact that the country’s comforting TEA rate has somewhat recovered during 2014 (from 7% to 9.2%). The performance is still poor even though the Nigerian government (especially Osun State) and non-governmental organizations have launched a number of measures to support the growth of SMEs. The state’s inexperienced small business owners continue to live in substandard conditions and earn low wages, which limit the sector’s ability to contribute to the nation’s economic growth. Therefore, identifying the factors that affect company success in Nigeria’s Osun State is a first step towards the promotion of entrepreneurship activities.
LITERATURE REVIEW
The impact of the institutional environment and the experience of entrepreneurs in a particular industry are crucial to the performance of any business outfit (Ko & McKelvie, 2018 and Morales-Solis et al., 2023). According to these research studies, SME performance and survival are significantly influenced by the experiences and traits of its senior managers. For instance, Morales-Solis et al. (2023) investigated how the success of small and medium-sized businesses in emerging economies is impacted by the industry-specific experience of the Chief Executive Officers. The study suggested an inverted U-shaped association between a CEO’s industry-specific experience and firm success; based on learning theory and the upper echelons perspective. Additionally, it was contended that political instability and corruption in the nation mitigate this association, which means that CEOs with years of industry expertise or no industry experience perform worse in nations with high levels of political instability or corruption. Although pre-entry experience is widely regarded as a critical asset that positively influences new entrant performance, empirical support is mixed.
Cao & Posen (2022) studied the effects of four categories of pre-entry experience at the founder’s level (entrepreneurial, managerial, industry, and functional experience), two levels of pre-entry experience (firm and founder), and two types of environments (institutional and industrial). According to the findings of the meta-analysis, there is a strong and favorable association between founder-level pre-entry experience and economic performance. The findings of the moderating analysis also indicate that there is a stronger link between economic performance and founder-level pre-entry experience in low Knowledge or Technology-Intensive (KTI) manufacturing and service businesses and a less correlation in KTI industries. These results enhance the knowledge of boundary constraints on the association between pre-entry experience and new entrant performance and offer strong new evidence for the significance of pre-entry experience.
Yadewani et. al. (2023) investigated how innovation mediated the relationship between SMEs’ performance, experience, and skills. The study uses multiple and hierarchical regression analyses to assess the hypotheses. Data processing was done using SPSS version 25. The analysis’s findings showed that SMEs’ success was positively impacted by skills, experience, and creativity. Furthermore, it was discovered that experience and skill levels positively impacted innovation. Also, it was demonstrated that innovation mediates the relationship between SMEs’ performance, experience, and skills.
Da Costa and Xiong (2021) adopted the quantitative approach to investigate how skills, knowledge, and abilities affect SMEs’ performance. The results of the F test (simultaneous) analysis indicate that skills, knowledge, and ability have positive and significant effects on SMEs’ performance; while the partial t-test results indicate that while skills are positive but do not significantly influence SMEs’ performance, knowledge and abilities have positive and significant effects on its performance.
Amin (2021) investigated how marketing tactics affected SMEs’ performance in Abuja. The results showed product strategy as the most widely used marketing tactic. The study’s variables—promotion, price, place, and product strategies—were positively correlated, suggesting that the use of marketing techniques improved the performance of SMEs in Abuja. The study came to the conclusion that marketing tactics had a beneficial impact on the performance of SMEs in Abuja. Skills, knowledge, and ability have positive and substantial effects on SMEs’ performance, according to the results of the F test (simultaneous) study. Knowledge and abilities have positive and substantial effects on SMEs’ performance, while t-test (partial) results indicate that skills are favorable but do not significantly affect SMEs’ performance.
Researchers have further argued that in order to improve performance, SMEs should be more aggressive in exploring a variety of competitive marketing strategies (Etuk et al., 2022 & Usani et al., 2024). Usani et al. (2024) examined how marketing tactics affected SMEs’ performance in Cross River State of Nigeria. In particular, the study examines how the performance of SMEs is affected by electronic marketing, marketing communication, and micromarketing. Percentages were used to analyze the data, and multiple regression analysis was used to evaluate the hypotheses. The study’s conclusions showed a strong correlation between SMEs’ performance and marketing tactics such as electronic marketing, marketing communication, and micromarketing.
Using marketing tactics, Usman and Dangana (2024) investigated the relationship between the performance of SMEs in Jigawa State, Nigeria, and the effects of marketing strategies. Each predictor variable—pricing, strategies, and promotion—had a substantial effect on SME performance, according to the ANOVA results. In order to improve competitiveness and market performance, the report advised SME owners and managers to create and execute complete marketing plans that incorporate these components.
Momoh (2022) investigated the performance of SMEs in Kogi State with respect to marketing mix strategies. The findings demonstrated a significant and negative relationship between SMEs’ sales and profitability performance and their marketing strategy. Conversely, there was a strong positive link between the distribution strategy and sales performance as well as a big positive correlation between the pricing strategy and profitability performance. The study concluded that the marketing mix strategies used by Kogi State SMEs have a significant impact on their sales and profitability. It was suggested that SME owners in the State switch from less aggressive promotion strategies to more aggressive distribution and pricing techniques in order to boost sales and profitability.
Awotunde et al. (2024) examined how various digital marketing platforms—such as online marketing and ICT initiatives—can affect the performance and operations of SMEs. The study used a quantitative approach, gathering primary data through a questionnaire based on a 5-point Likert scale. The results unequivocally demonstrated that digital marketing had a major impact on SMEs’ performance. The outcome also demonstrates how online marketing boosts the competitiveness of SMEs. Nonetheless, this study came to the conclusion that, given its role in enhancing performance, 21st-century SMEs would always recognize the value and importance of digital marketing in this technologically advanced world. It was further noted in the study that SMEs update their online marketing channels periodically to include robust digital platforms.
The developmental potential of funding Micro, Small, and Medium-Sized Enterprises (MSMEs) in Nigeria was identified by Onyeiwu et al. (2021) and Awoyemi and Makanju (2020) along with the obstacles that stand in the way of MSMEs’ expansion in Nigeria. Descriptive analysis, basic percentages, and the deductive techniques were used in Awoyemi and Makanju (2020) to explain the challenges faced by MSMEs as well as the growth potential of financing them. Since many MSMEs are viewed by financial institutions as high-risk debtors who lack creditworthiness, it was discovered that their inability to obtain funding continues to impede their growth and survival.
Peter et al. (2018) investigated how financial aid affected SMEs’ performance in three Nigerian States. Semi-structured interviews and a survey were used in a mixed methods approach. The study chooses the questionnaire respondent, using the stratified and basic random techniques. Semi-structured interviews and survey were used in a mixed methods approach. The study found that although financial aid significantly affects SMEs’ performance, it is insufficient and defined by onerous, irrational bureaucratic requirements.
Ibrahim (2022) looked at how MSMEs in Nigeria have performed better as a result of CBN loans made through its subsidiary, the Nigeria Incentive-Based Risk Sharing System for Agricultural Lending (NIRSAL). Primary data for the study came from an online electronic survey (a Google Form). Chi-square and percentage bar charts were used to analyze the data. The outcome demonstrated that CBN loan programs significantly improve MSMEs’ performance in Nigeria. For improved growth, it was suggested that the government provide MSMEs with additional financing options.
Anthony et. al. (2023) investigated into how Kano State’s small and medium-sized businesses perform in relation to their access to financing. Structural Equation Modelling (SEM), using PLS version 3.0 was used to conduct the analysis. The findings demonstrate that SMEs’ performance in Kano State is positively and significantly impacted by their access to financing. Thus, the study suggests that SMEDAN, CBN, MFIs, and NIRSAL collaborate by offering sufficient financial resources that can help SMEs improve their performance.
The goal of the paper written by Gumel and Bardai (2021) was to pinpoint the obstacles preventing Nigerian small enterprises from obtaining finance from banking institutions. Four obstacles to Nigerian SMEs’ access to financial institution funding were identified by the mixed study method: limited financial institution access; insufficient owner/manager education, experience, and abilities; excessive interest rates; and gender discrimination. It was determined that expanding access to finance from financial institutions will boost prosperity and expansion, lower unemployment, and spur socioeconomic development—all of which the Nigerian federal government had envisioned.
Adeyemo and Olateju (2022) studies how financing availability affected the expansion of small and medium-sized businesses (SMEs) in Nigeria. The survey method was used as the research design. The results demonstrated that loans and microfinance, cooperative organizations, personal savings, and money from friends and family are the financial options accessible to SMEs. Additional findings showed that the obstacles to SMEs’ expansion—such as shortage of capital, governmental regulations, an epileptic power supply, taxes, and increased borrowing rates—all had a substantial impact on SME development.
The foregoing review show that different factors affect the activities of SMEs with varying effects. Therefore, identifying those considered most important in the context of Osun State of Nigeria is the main objective of this study.
Conceptual Framework
Scholars, as argued by Bridge, O’Neill, and Cromie (2003), have employed the word entrepreneurship to connote different meanings at different times. An enterprise’s measurement structure gathers data regarding environmental variations and business concern performance. Business decisions are based on the information as well as the company’s and its management’s values and preferences. As a result, the company’s financial performance and outputs (products, services, and operational performance) are altered. However, assessing business success is a complex and varied process. In this context, performance refers to a company’s market performance, which can have a variety of effects. While success generally refers to achieving the desired goals in any area of human life, performance is the capacity of enterprises to provide respectable results. Analysis will concentrate on factors such as – technological resources, skill acquisition, business plan, information access, marketing strategy, government support and financial resources. In business, while success is not always explicitly detailed, it remains a key term in the management field. Two pointers of management benchmarking are success and failure. In any business, the success theory is commonly utilised to refer to business presentation. However, there is usually no acknowledged description of what success is and therefore, business success has been construed in various ways (Foley & Green, 1989). There are at least two substantial aspects of success: 1) short- vs. long-term success; and 2) financial vs. other success. Hence, success might have diverse forms such as investment returns, turnover, number of persons working, endurance, repute, trades development, cheerfulness and so on. Therefore, success connote different meanings to different people. Irrespective of these dissimilarities, there appears to be a comparable idea as to what makes a business fruitful.
A successful firm necessitates determination in every area that impacts the engagement line. Due to their established business practices and a number of problems that significantly impact their success, SMEs are at risk from growing commercial rivalry. However, influencing elements would always persist regardless of the location of SMEs or the strength of the market circumstances.
It’s now clear that there are a lot more barriers to SMEs’ business success than there used to be. As a result, SME owners are worried about how to stay competitive in the market.
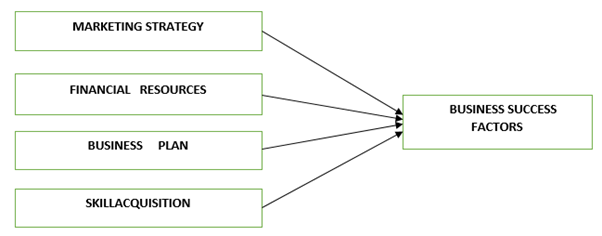
Fig. 1 Conceptual Framework
Research Questions
Arising from the above review and concept, the following questions are raised in this study:
- What is the degree of correlation of business success factors in Osun State of Nigeria?
- What determines business success factors for SMEs in Osun State of Nigeria?
- Can there be dissimilarity in the business success score for SMEs according to knowledge in Osun State?
Objectives of the study
- To examine the extent to which business success factors are correlated in Osun State of Nigeria.
- To evaluate the determinants of business success factors for SMEs in Osun State of Nigeria.
- To show the difference in the business success score for SMEs based on knowledge in Osun State of Nigeria.
METHODOLOGY
Data and Methods
A general survey of operating SMEs in Osun State, Nigeria, provided the sample for our research (stratified technique). The European Union definition of micro SMEs which comprises of less than ten (10) members is adopted here. After dividing the sample population into groups, or strata, we chose samples for the survey from each stratum. After that, questionnaires were given to all of the SMEs in selected towns in Osun State, namely Osogbo, Ila-Orangun, Ilesha, Iwo, Ikire and Ile-Ife. We used a two-part structured questionnaire for this investigation.
The first portion asked about the business types and demographics of the participants. Questions about business success criteria pertinent to the study’s scope were covered in the second segment. The test-retest reliability method was used to evaluate the questionnaire’s reliability. The results showed an R-value of 0.70 and an internal consistency score of 0.875 according to Cronbach Alpha.
Technique Analysis
The MANOVA examines the groups and determines if the mean differences between the groups on the combination of dependent variables are likely to have happened by chance. The outcome variable is Business Success Factors whereas marketing strategy, business plan, financial resources, and skill acquisition are the explanatory variables.
Our dependent variables are related in some way. In order to handle this, MANOVA first generates a new summary dependent variable, which is a linear combination of all the initial dependent variables. Next, it uses the newly combined dependent variables to perform an analysis of variance. MANOVA displays the univariate findings for each of our dependent variables and indicates whether there is a significant difference between our groups on this composite dependent variable.
There has been discussion, nevertheless, over why many researchers don’t simply perform a number of ANOVAs independently for every dependent variable. Regretfully, we incur the possibility of an inflated Type 1 error” if we go down that route. This implies that even if there are actually no differences between the groups, the more studies we perform, the more probable it is that we will uncover a meaningful result. MANOVA has the benefit of “controlling” for this elevated risk of a Type 1 error. There is a cost associated with using MANOVA because of the extra assumptions that need to be fulfilled. Our dataset satisfies the minimal requirements in terms of the sample size, normality, and utliers assumptions.
Assumptions of MANOVA
(a). Normality: This study also passed the normality test. In line with Tabachnick and Fidell (2002), a minimum of 20 per cell is needed to ensure robustness of data set. This study has far more than this requirement.
(b). Sample size: The requirement for this assumption is that each of the cells must possess more examples than response/outcome variables. This study consists of seven cells and four outcome variables for each of the two levels of the independent variable; experienced/inexperienced (see output’s descriptive statistics box).
(c). Outliers: No evidence of outliers for both univariate and multivariate in our data. This is a common challenge that is usually associated MANOVA as a technique of estimation.
Descriptive Statistics
Table 1. Between Factors (Knowledge)
| Success Factors | Knowledge | Mean | Std. Dev. | N |
| Marketing Strategy | Experienced | 10.59 | 1.7875 | 167.67 |
| Inexperienced | 10.175 | 1.8725 | 211.5 | |
| Total | 10.40 | 1.838 | 463 | |
| Business Plan | Experienced | 7.795 | 1.556 | 251.5 |
| Inexperienced | 7.705 | 1.407 | 211.5 | |
| Total | 7.755 | 1.489 | 463 | |
| Financial Resources | Experienced | 9.725 | 2.0195 | 251.5 |
| Inexperienced | 9.305 | 1.8465 | 211.5 | |
| Total | 9.535 | 1.953 | 463 | |
| Skill Acquisition | Experienced | 7.055 | 0.7525 | 251.5 |
| Inexperienced | 6.97 | 0.7325 | 211.5 | |
| Total | 7.015 | 0.744 | 463 |
The sample size utilized in the analysis is shown in the above table (1). Letter N stands for the values of the cell sizes which is more than 30 cases for each cell. This suggests that deviations from equality of variance or normalcy in the outcomes won’t be significant in the study.
Diagnostic Tests
Table 2. Box’s Test of Equality of Covariance Matricesa
| Box’s M | 21.096 |
| F | 1.05 |
| df1 | 5 |
| df2 | 1909828.58 |
| Sig. | .0105 |
| H0: Equal covariance matrices across groups for the regressand.
a. Design: Intercept + Knowledge |
|
Table 3. Levene’s Test of Equality of Error Variancesa
| Levene
Statistic |
df1 | df2 | Sig. | ||
| Market Strategy | The Mean | .302 | 1 | 462 | .2185 |
| The Median | .189 | 1 | 462 | .2695 | |
| Adjusted df Median | .189 | 1 | 461.155 | .2695 | |
| The trimmed mean | .2635 | 1 | 462 | .234 | |
| Business Plan | The Mean | 2.321 | 1 | 462 | .0155 |
| The Median | 2.674 | 1 | 462 | .0105 | |
| Adjusteddf Median | 2.674 | 1 | 461.328 | .0105 | |
| The trimmed mean | 2.3845 | 1 | 462 | .0145 | |
| Financial Resources | The Mean | 1.163 | 1 | 462 | .064 |
| The Median | 1.1295 | 1 | 462 | .0665 | |
| Adjusted df Median | 1.1295 | 1 | 455.129 | .0665 | |
| The trimmed mean | 1.071 | 1 | 462 | .072 | |
| Skill Acquisition | The Mean | 1.275 | 1 | 462 | .0555 |
| The Median | .0395 | 1 | 462 | .3895 | |
| Adjusted df Median | .0395 | 1 | 432.088 | .3895 | |
| The trimmed mean | 0.687 | 1 | 462 | .1205 | |
| H0: Equal error variance of the regressand across the groupps.
a. Design: Intercept + Knowledge |
|||||
If our data deviates from the condition of homogeneity of variance covariance matrices, it is indicated in Table (2) above (output box labeled Box’s Test of Equality of Covariance Matrices). As stated by Fidell and Tabachnick (2001), the assumption has not been broken if the Sig. value is greater than .001. Moreover, Box’s M may become overly rigid with a high sample size. Thankfully, the Box’s M Sig. value in our case is .105, so we haven’t broken this presumption. The robustness of our findings is further demonstrated by table (3), which is another diagnostic test (Levene’s Test of Equality of Error Variances). If the values are less than .05, the Sig. column shows that the assumption of equality of variance for each variable has been violated. While the Sig. values for business plan were below the Sig. value, the Sig. values for the mean, median, and trimmed mean for our three dependent variables—market strategy, financial resources and skill acquisition—were over 0.5. We employed a more conservative alpha level to determine significance for one of our response variables in the univariate F-test due to the violation. Tabachnick and Fidell (2001) recommend an alpha of .01 or .025 instead of the standard .05 threshold.
Results of the General Linear Model
Table 4. Multivariate Tests
| Effect | Value | F | Hypothesis Df | Error df | Sig. | Partial Eta Squared | |
| Intercept | Pillai’s Trace | .495 | 11750.068b | 2.000 | 460.500 | .000 | .495 |
| Wilks’ Lambda | .005 | 11750.068b | 2.000 | 460.500 | .000 | .495 | |
| Hotelling’s Trace | 51.032 | 11750.068b | 2.000 | 460.500 | .000 | .495 | |
| Roy’s Largest Root | 51.032 | 11750.068b | 2.000 | 460.500 | .000 | .495 | |
| Knowledge | Pillai’s Trace | .012 | 2.8695b | 2.000 | 460.500 | .000 | .012 |
| Wilks’ Lambda | .488 | 2.8695b | 2.000 | 460.500 | .000 | .012 | |
| Hotelling’s Trace | .0125 | 2.8695b | 2.000 | 460.500 | .000 | .012 | |
| Roy’s Largest Root | .0125 | 2.8695b | 2.000 | 460.500 | .000 | .012 | |
| a. Design: Intercept + Knowledge
b. Exact statistic |
|||||||
The statistically significant differences between the groups on a linear combination of the response variables are shown in table (4) by our multivariate test results. Nonetheless, a variety of statistics are available, including Hotelling’s Trace, Pillai’s Trace, and Wilks’ Lambda. Wilks’ Lambda is among the most often cited statistics. For general application, Tabachnick and Fidell (2001) suggest Wilks’ Lambda. Our sample size is sufficient in this instance, with equal N values and no violations. Thus, the Wilks Lambda test serves as the foundation for our investigation. When there are only two groups, as in this study, the F-tests for Wilks’ Lambda, Hotelling’s Trace, and Pillai’s Trace are the same. For the independent variable (Knowledge), the Wilks’ Lambda value is less than 0.05 and extremely significant at 0.000. We therefore draw the conclusion that our groups differ from one another. In this case, we found a significance value of .000 and a Wilks’ Lambda value of .488. In terms of business characteristics, there is a statistically significant difference between the experienced and inexperienced entrepreneurs because this is less than .05.
Table 5. Tests of between-subjects Effects
| Source | Dependent Variable | Type III Sum of Squares | df | Mean Square | F | Sig. | Partial Eta Squared |
| Corrected Model | Market Strategy | 81.013a | 1 | 81.013 | 6.0685 | .0005 | .0065 |
| Business Plan | 3.4295b | 1 | 3.4295 | .3865 | .190 | .0005 | |
| Financial Resources | 82.1705c | 1 | 82.1705 | 5.4445 | .0005 | .006 | |
| Skill Acquisition | 3.289d | 1 | 3.289 | 1.4875 | .0425 | .0015 | |
| Intercept | Marketing Strategy | 198149.125 | 1 | 198149.125 | 14842.616 | .000 | .485 |
| Business Plan | 110406.885 | 1 | 110406.885 | 12443.113 | .000 | .482 | |
| Financial Resources | 166427.1705 | 1 | 166427.1705 | 11027.114 | .000 | .480 | |
| Skill Acquisition | 90.338.116 | 1 | 90338.116 | 40863.926 | .000 | .4945 | |
| Knowledge | Marketing Strategy | 81.013 | 1 | 81.013 | 6.0685 | .0005 | .0065 |
| Business Plan | 3.4295 | 1 | 3.4295 | .3865 | .190 | .0005 | |
| Financial Resources | 82.1705 | 1 | 82.1705 | 5.4445 | .0005 | .006 | |
| Skill Acquisition | 3.289 | 1 | 3.289 | 1.4875 | .0025 | .0015 | |
| Error | Marketing Strategy | 6167.7065 | 462 | 6.675 | |||
| Business Plan | 4099.2945 | 462 | 4.4365 | ||||
| Financial Resources | 6.972.754 | 462 | 7.5465 | ||||
| Skill Acquisition | 1021.346 | 462 | 1.1055 | ||||
| Total | Marketing Strategy | 206586.000 | 463 | ||||
| Business Plan | 115447.000 | 463 | |||||
| Financial Resources | 175378.000 | 463 | |||||
| Skill Acquisition | 92137.000 | 463 | |||||
| Corrected Total | Marketing Strategy | 6248.719 | 462.5 | ||||
| Business Plan | 4102.7235 | 462.5 | |||||
| Financial Resources | 7054.9245 | 462.5 | |||||
| Skill Acquisition | 1024.635 | 462.5 |
- R Square = .0065 (Adjusted R Square = .0064)
- R Square = .0005 (Adjusted R Square = .0004)
- R Square = .006 (Adjusted R Square = .005)
- R Square = .0015 (Adjusted R Square = .0014
Our multivariate test of significance yielded a significant result, so we look at each of our dependent variables in more detail. Table 5 (Tests of Between-Subjects Effects) above provides answers to the main question of whether experience and inexperience entrepreneurs differ on all or just some of the dependent measures. To lower the possibility of a Type 1 error—finding a significant result when there isn’t—we set a higher alpha threshold because we are examining multiple independent studies. We use the Bonferroni correction to do this. In its most basic form, this is calculated by dividing the number of analyses conducted by our initial alpha level of .05 (see Tabachnick & Fidell, 2001). Since we have four dependent variables to examine in this case, we divided .05 by 4, resulting in a new alpha level of .0125. The decision rule here is that if the probability value (Sig.) is less than .0125, we declared our findings to be significant. The Tests of Between-Subjects Effects table displays all the dependent variables along with the corresponding univariate F, df, and Sig. values in the row labeled with independent variable (in this case, KNOWLEDGE). In this case, three of our dependent variables (marketing strategy, financial resources and skill acquisition) recorded significance values below the cut-off (i.e. Sig. values of .0005, .0005, and .0025 correspondingly).
Table 6. Estimated Marginal Means (Knowledge)
| 95% Confidence Interval | |||||
| Dependent Variable | Knowledge | Mean | Std. Error | Lower Bound | Upper Bound |
| Market Strategy | Experienced | 10.5925 | .0815 | 10.4325 | 10.7525 |
| Inexperienced | 10.1725 | .089 | 9.9985 | 10.347 | |
| Business Plan | Experienced | 7.793 | .0665 | 7.663 | 7.9235 |
| Inexperienced | 7.707 | .0725 | 7.5645 | 7.849 | |
| Financial Resources | Experienced | 9.7265 | .0865 | 9.5565 | 9.8965 |
| Inexperienced | 9.304 | .0945 | 9.1185 | 9.489 | |
| Skill Acquisition | Experienced | 7.0525 | .033 | 6.9875 | 7.1175 |
| Inexperienced | 6.968 | .036 | 6.897 | 7.039 | |
The outcome of the Partial Eta Squared generated by SPSS is used to assess the significance of the influence of knowledge on business success factors. This shows the percentage of the dependent variable scores’ volatility that can be accounted for by the outcome variable (knowledge). Following Cohen (1988), the values are .0065; .006; and .0015; which are relatively with minor influence. Just 1.3%, 1.2%, and .3% of the variance in our significant variables are represented by these values. We are aware that there were differences between experienced and inexperienced entrepreneurs in terms of their ability towards marketing strategy, financial resources, and skill acquisition, but we are unsure of which group scored higher. We use table six (Estimated Marginal Means) to determine this. Experienced and inexperienced mean scores for marketing strategy, financial resources, and skill acquisition are 10.59 and 10.17; 9.73 and 9.30; 7.05 and 6.97 proportionately. The actual difference in the mean scores was less than two scale points, although being statistically significant.
Table 7. Knowledge * Business Success Factor Cross Tabulation
| Weak Business Success Score | Average Business Success Score | High Business Success Score | Total | |||
| Knowledge | Experienced | Count | 106 | 65 | 84.5 | 255.5 |
| % within Knowledge | 20.75% | 12.7% | 16.55% | 50.0% | ||
| % within Business Success | 23.5% | 27.2% | 33.25% | 27.05% | ||
| Inexperienced | Count | 119.5 | 54.5 | 42.5 | 216.5 | |
| % within Knowledge | 11.04% | 12.6% | 9.8% | 50.0% | ||
| % within Business Success | 26.5% | 22.8% | 16.75% | 22.95% | ||
| Total | Count | 225.5 | 119.5 | 127 | 472 | |
| % within Knowledge | 23.9% | 12.65% | 13.45% | 500.0% | ||
| % within Business Success | 50.0% | 50.0% | 50.0% | 50.0% |
From table (7), experienced entrepreneurs outperformed their inexperienced counterparts in terms of business success factors. Over 55% of experienced entrepreneurs have high business success factors, compared to 41% of inexperienced entrepreneurs. Thirty-three percent (33%) of the experienced fall into the high business score category, but just 19.6% of inexperienced entrepreneurs does the same. The average success rate for experienced and inexperienced entrepreneurs is 25%, which is the same. Nonetheless, there are more experienced entrepreneurs in this category than the inexperienced. In a nutshell, experienced entrepreneurs are more successful than their inexperienced counterparts, which is evident and suggestive.
DISCUSSION
The aforementioned findings from this study support Awotunde et al. (2022) and Usman and Dangana (2024) assertion that marketing strategy affect business growth positively. According to the studies, marketing strategies in form of promotion, price, place, and product were positively correlated, suggesting that the use of these techniques improves the performance of SMEs in Nigeria. According to our study, marketing strategy was shown as a factor with positive effect on the performance of SMEs in Osun State of Nigeria. The findings on table (6) demonstrate that this variable significantly affects the success level of inexperienced and experienced entrepreneurs. This implies that the success level of SMEs owned by experienced and inexperienced entrepreneurs is unaffected by business plan. This conforms with the findings in Consez and Bivona (2021). In contrast, researchers have indicated that business tactics is a significant driver of corporate success (Sagiarto, 2019 & Morales-Solis et al., 2023). Therefore, it is clear that Nigerian SMEs are unconcerned with business formulation, feedbacks and analysis that might lead to the development of new benefits. However, our findings are supported by Morales-Solis et al. (2023), where it was demonstrated that success criteria, such as innovation, superior delivery and customer services, and brand recognition, did not provide any favorable outcomes for SMEs’ growth. However, this disproves the argument made by Consez and Bivona (2019) and calls for more research to determine the cause of the inconsistent findings on the impact of business plan on entrepreneurial success in Nigeria. Business success requires a tailored approach to design and the need for entrepreneurs to innovate their business models. Our findings clearly show that experienced entrepreneurs are more likely, than inexperienced entrepreneurs, to possess these hidden attributes.
Studies by Gumel and Baldai (2021), Adeyemi and Olatunji (2022) and Anthony et al. (2023) supported the outcome of this study about the positive effect of financial resources on SMEs activities in Nigeria. These studies came to the conclusion that financial resources are crucial to SMEs’ success. According to Anthony et al. (2023), access to finance affects SMEs performance positively in Nigeria.
Yadewani et al. (2023) and Da Costa and Xiong (2021) displayed that skill acquisition has positive impact on entrepreneurship activities; just as our study reaffirms their findings. Further, Mamabolo (2017) affirms that one of the key components of a successful business is the development of entrepreneurial skills. These findings were also reaffirmed by Cowdrey (2012), Prakash et al. (2015), and Ayankoya (2016). They came to the conclusion that prior experience, particularly in the areas of bookkeeping, monitoring, labour turnover management, and educational attainment, is what makes skill acquisition as a variable a more successful one. Our results show that this characteristic is a significant source of distinction between Nigeria’s experienced and inexperienced entrepreneurs. This shows that experienced entrepreneurs are more likely, than the inexperienced, to become business owners and to obtain more education and skills relevant to their industries.
CONCLUSION
This study concludes that marketing strategy, financial resources and skill acquisition are the business success factors that affect the activities of SMEs positively in Nigeria. This suggests that effective marketing strategy, adequate financial resources and the needed skill acquisition are capable of boosting SME actvitities in Nigeria. The business plan shows mixed effects, indicating that SMEs in Nigeria may not fully recognize its importance. For the sake of sustainability, it is suggested that policy makers should continue their efforts in providing necessary financial assistance to SMEs in the country. Experience they say is the best teacher. Apart from on-the-job learning, other means of skill acqusition such as mentoring, networking and workshops should also be encouraged.
REFERENCES
- Adeosun, O.T.&Shittu, A.I. (2022). Small–medium enterprise formation and Nigerian economic growth. Review of Economics and Political Science, 7(4), 286- https://doi.org/10.1108/REPS-07-2020-0089.
- Adeyemo, K.A. & Olateju, I.A. (2022). Impact of access to finance on the growth of small and medium enterprises in Nigeria. International Journal of Business Systems and Economics,13(7), ISSN: 2360-9923, 22-36. DOI:2726452731372.
- Amin, H. (2021), Influence of marketing strategies on the performance of SMEs: Evidence from Abuja SMEs. In: Journal of Economics and Business, 4(1), 294-307. http://www.casirmediapublishing.com
- Anthony, A. U., Shamsudeen, S., Aminu, U. & Nura, M. B. (2023). Access to finance and its impact on small and medium enterprise (smes) performance in Kano S Gusau Journal of Economics and Development Studies (GUJEDS), 4(1). https://doi.org/10.57233/gujeds.v4i1.13.
- Awotunde, M.O., Oyedele, O.O. & Adewale, R.A. (2024). Navigating the 21st century marketplace: The role of digital marketing in SME development in Nigeria. International Journal of Research in Business and Social Science, 13(5), 902-913.
- Awoyemi,O. & Makanju, A.A. (2020). The growth prospect and challenges of financing micro, small and medium scale enterprises in Nigeria EJBMR, European Journal of Business and Management Research, 5(4). https://doi.org/10.20525/ijrbs.v13i5.3349
- Bridge, S., O’Neill, K. & Cromie, S. (2003). Understanding Enterprise, Entrepreneurship and Small Business. 2nd Edition. New York. Palgrave Macmillan. ISBN 0-333-98465-X.
- Cao, Z. & Posen, H.E. (2022). When does the pre-entry experience of new entrants improve their performance? A meta-analytical investigation of critical moderators. Organization Science, 34(2), 613-636. https://doi.org/10.1287/orsc.2022.1589.
- Cosenz, F. & Bivona, E. (2021). Fostering growth patterns of SMEs through business model innovation: A tailored dynamic business modelling approach. Journal of Business Research, 130, 658-669. https://doi.org/10.1016/j.jbusres.2020.03.003.
- Da Costa, E. & Xiong, Y. N. (2021). The role of human resources competency on SMEs performance in Timor – Leste. Eduvest – Journal of Universal Studies, 1(11), 1203–1213. https://doi.org/10.36418/edv.v1i11.259.
- Etuk, S., James, E. E. & Joseph, U. E. (2022). Marketing strategies and passengers’ adoption of ride-hailing services. International Journal of Management & Enterpreneurship Research, 4(1), 59-73.
- Foley, P. & H. Green (eds.) (1989). Small business success. London: Chapman.
- Gumel, B. (2019). The impact of strategic planning on growth of small businesses in Nigeria. SEISENSE Journal of Management, 2(1), 69-84. https://doi.org/10.33215/sjom.v2i1.85.
- Gumel, I. & Bardai, B.B. (2021). Barriers to accessing financial institutions funding for Nigerian SMEs. International Journal of Business and Economics Research, 10(6), 219-226. doi: 10.11648/j.ijber.20211006.12.
- Hosseininia, G., & Ramezani, A. (2016). Factors influencing sustainable entrepreneurship in small and medium-sized enterprises in Iran: A case studyof food industry. Sustainability, 8. https://doi.org/10.3390/su8101010.
- Ibrahim, I. (2022). An empirical assessment of government’s financial support on the performance micro, small and medium scale enterprises (MSMEs) in Nigeria. Fuoye Journal of Finance and Contemporary, 2(1), 125-134.
- Jallo, C. (2023). Small and medium enterprise financing in the Gambia: Role of Islamic finance. Journal of Islamic Finance, 12(2), 21-29. ISSN 2289-2117 (O) / 2289-2109 (P)
- Ko, & McKelvie, A. (2018). Signaling for more money: The roles of founders’ human capital and investor prominence in resource acquisition across different stages of firm development, Journal of Business Venturing, 33(4), 438-454, https://doi.org/10.1016/j.jbusvent.2018.03.001.
- Momoh, S. O. (2022). Analyzing the impact of marketing mix techniques on the performance of SMEs in Kogi State. European Journal of Business and Management, 14(3), 87-101.
- Mwakalila, E. (2023). Income inequality: A recipe for youth unemployment in Africa. SN Bus Econ3(15). https://doi.org/10.1007/s43546-022-00394-0.
- Mahadea, D. & Khumalo, S. (2020). Understanding the internal and external constraints to growth of microenterprise enterpreneurship in a South African Provincial context: A case study of Mpumalanga-M Journal of Developmental Entrepreneurship. 25(02). https://doi.org/10.1142/S1084946720500132.
- Morales-Solis, J.C., Barker III, V.L. & Cordero, A.M. (2023). CEO’s industry experience and emerging market SME performance: The effects of corruption and political uncertainty. Journal of Business Venturing Insights, 20. https://doi.org/10.1016/j.jbvi.2023.e00424.
- Nigeria Global Entrepreneurship Monitor Report (2022).
- Ojekemi, O. & Adebayo, T.S. (2020). The impact of innovation on entrepreneurial orientation: A case study of SMEs in Osun State. Asian Journal of Economics and Empirical Research, 7(2), 153-158.
- Onyeiwu, C., Muoneke, O.B. & Nkoyo, U. (2021). Financing of small and medium scale enterprises and its growth impact in Nigeria. The Journal of Entrepreneurial Finance, 22(2). DOI: https://doi.org/10.57229/2373-1761.1385.
- Peter, O., Adegbuyi, O., Olokundun, M.A., Peter, A.O. Amaihian, A.B. & Ibidunni, S.A. (2018). Government financial support and financial performance of SMEs. Academy of Strategic Management Journal, 17, (3).
- Peace, N.C. & Richard, O.E. (2017). Small and medium enterprise financing in Nigeria: Benefits, challenges and way forward. Journal of Economics and Sustainable Development, 8(20).iiste.org. ISSN 2222-1700 (Paper) ISSN 2222-2855 (Online) .
- Sugiarto, I. (2019). Impact of business plans for the development of MSMEs Budapest. International Research and Critics Institute-Journal (BIRCI-Journal), 2(2), 375-379.
- Usani, N.E., Sampson, E.A., Essien, I.J., Christopher, U.M. & Effiong, M.I. (2024). Marketing strategies and performance of selected small and medium enterprises (SMEs) in central senatorial district of Cross River State, Nigeria. Journal of Bio-Based Marketing, 1.
- Usman, U. & Dangana, E.A. (2024). Marketing strategies and the sales performance of selected small and medium enterprises in Jigawa state Nigeria. Journal of Business Management, Innovation and Creativity, 3(1). ISSN: 2971 – 6896.
- United Nations Conference on Trade and Development (2021). Annual Report.
- World Bank (2022). Global economic prospects. Washington, DC: World Bank.
- Yadewani, D., Wijaya, R., Mursalini, W.I. & Almasdi, B.A. (2023). The effect of skills and experience on the performance of small and medium enterprises with innovation as mediation variable. Indonesian Journal of Business and Entrepreneurship, 9(1).