
A Study of Customer Satisfaction Toward Service Quality of Hotels in Langkawi
- Noraslinda Mohd Said
- Nursyafiqah A Raman
- Johanudin Lahap
- Fadhlina Mahat
- Teku Zariff Zaeimoedin
- Mas Affandy Mashuri
- 2819-2827
- Mar 12, 2025
- Education
A Study of Customer Satisfaction toward Service Quality of Hotels in Langkawi
Noraslinda Mohd Said, Nursyafiqah A Raman, Johanudin Lahap, Fadhlina Mahat, Teku Zariff Zaeimoedin, Mas Affandy Mashuri
Faculty of Hotel and Tourism Management, Universiti Teknologi MARA (UiTM), Cawangan Pulau Pinang, Pulau Pinang, Malaysia
DOI: https://dx.doi.org/10.47772/IJRISS.2025.9020217
Received: 30 January 2025; Accepted: 04 February 2025; Published: 12 March 2025
ABSTRACT
The hospitality industry is growing, and the main factors contributing to its success are service quality and customer satisfaction. The main aim of this study is to examine factors that influence customer satisfaction towards the service quality offered by hotels in Langkawi. Langkawi is an Island located in the northern part of Peninsular Malaysia, the island attracts many visitors domestically and internationally making it among the most popular tourist destinations in Malaysia. For the methodology, this research adopts descriptive analysis to analyze the relationship between the quality of service toward customer satisfaction provided by hotels that exist in Langkawi. The data was then analyzed by SPSS by using spearmen correlation analysis. The findings reveal that the five dimensions (tangible, dependability, responsiveness, assurance, and empathy) were known to have a positive relationship with customer satisfaction. Based on the results, it was discovered that assurance scored the highest level of importance towards customer satisfaction. Hence, it can be concluded that despite many factors influencing customer satisfaction, it was found that customer assurance plays a vital role in service quality, particularly in Langkawi hotels.
Keywords— Service Quality, Customer Satisfaction, Dimension of Service Quality (SERVQUAL)
INTRODUCTION
The hotel industry has become one of the most important industries that make up the vast tourism business environment. The hotel industry is extremely competitive, today the hotel industry is among one of the most lucrative businesses in Malaysia because this country is a host to millions of international tourists. One of the most well-known islands that receives millions of tourists each year is the island of Langkawi (Kedah). Most hotel managers are aware that fierce competition between hotels exists, therefore, hotel managers now are focusing their efforts on improving the quality of services to remain competitive in the market (Anwar & Abd Zebari, 2015). One of the factors that distinguish the uniqueness of a particular hotel is the quality of service rendered. Additionally, they postulated five aspects of service, empathy, assurance, reliability, responsiveness, and tangible are deemed to be important. These five dimensions play a major role in customer evaluation in service. Customer loyalty is the result of customer satisfaction, which contributes to repeat purchases and leads to a recommendation of the product or services to family and friends. Many scholars have agreed that there is a strong correlation between service quality and guest satisfaction (Ali & Anwar, 2021). Sharma and Srivasta (2018) further explained that customer satisfaction was formed by the quality of services offered by a service organization. According to Zeithaml, Bitner, and Gremler (2006), service quality is a measure of how well a particular service meets or exceeds customer needs. To summarize, this study is conducted primarily to examine factors that contribute to customer satisfaction in Langkawi Malaysia.
Service Quality
Service quality is an important core concept and a critical success factor in the hospitality industry. Saleh and Ryan (1991) confirm that ‘…service quality is an important success factor in attracting repeat customers to hotels…’. Likewise, Amin et al (2013) state that the prime concerns of any hotel organization are superior service quality and formidable customer satisfaction. Therefore, the hotel must continuously improve its service to satisfy the customers and in return, repeat visitation will occur. The first encounter of a customer with a service organization was seen to be pivotal, as this will create either a positive or negative impression on a customer, and this will last and be embedded in the customer’s mind. Fida, Ahmed, Al-Balushi, and Singh (2020), define the quality of services as a key function of a particular company or industry to meet the desired expectations of customers. In research by Shah, Jan, and Baloch (2018), service quality attributes, i.e., tangibility, reliability, responsiveness, assurance, and empathy have a significant effect on the level of customer satisfaction and this in return increases customer loyalty which ultimately creates repeat visitation. In Tabaku and Cerri (2016) studies show that there is a significant relationship between customer perceptions and customer satisfaction for hotel guests and describe ‘…service quality as the type of appraisal used to represent long-term appraisal…’. Al-Ababneh (2017), concluded that ‘…service quality can be seen as the gap between the expected service and the actual perceived service…’. Ali and Anwar (2021) maintained that service quality is the difference between customers’ expectations and service performance. Besides that, Danish, Humayon, Iqbal, Raza, and Shahid (2018) describe service quality as a relative function that connects customer expectations for the services provided. The definition and understanding of quality and customer satisfaction are a bit enigmatic because different researchers have different reasons to explain what is customer satisfaction (Roslan, Wahab & Abdullah, 2015).
Customer Satisfaction
Customer Satisfaction is the feeling of pleasure or disappointment after product performance or results meet expectations (Kotler and Keller 2009). They further confirmed that customer satisfaction is defined by customer perceptions and expectations themselves. If the level of satisfaction is lower than expected, the buyer is dissatisfied vice versa. Customers are satisfied when expectations are acceptable, but if customers are highly satisfied, in return they will be delighted. The measure of customer satisfaction with a product/service is based on a comparison between how they feel about the product/service versus their expectations of the service. Since each person has different views and values, the degree of satisfaction is also different. Hence, Priyo et al. (2019) suggest that customer satisfaction is a measure of one’s feelings and customer desire (actual performance. Oliver (1996), states that satisfaction is the consumer’s judgment towards a service feature, product, or service itself, provides a satisfactory level of satisfaction related to contentment, including a level of under or over-fulfillment.
Dimension of Service Quality (SERVQUAL)
The SERVQUAL framework is used by many researchers to measure the gaps between customer expectations and perceptions and is used to improve service quality (Minh et al., 2015, Carrillat et al, 2007, Boonitt & Rompho, 2012). Expectation is defined as a mental state of mind that drives someone to make assumptions about a subject or an object (Fakfare, Manosuthi, Jin, Han, & Jin, 2025). Perception on the other hand can be explained as a state of mind in which people think about something or a subject that might be impacting or influencing their mental cognition (Ghazi, Kattara, Salem, & Shaaban, 2025). Parasuraman et al. (1988) proposed the ‘SERVQUAL model’ to measure the five dimensions of service quality, namely tangible (physical facilities, equipment, appearance of employees), reliability (ability to reliably and accurately perform promised services), responsiveness (willingness to help customers and provide prompt service), assurance (knowledge and courtesy and the ability to inspire trust and confidence in employees), empathy (a meticulous and personalized way the company feels customer orientation). For this reason, the SERVQUAL approach remains the best benchmark for cross-sectional studies and industry benchmarking (Grönroos, 2000). Similarly, Gencer & Akkucuk, (2017) state that, the SERVQUAL model is the most established model to measure service quality in the service industry. Hence, it is reliable, valid, and widely used in all service sectors. Most importantly, SERVQUAL is widely used in hospitality and tourism research (Pizam, Shapoval & Ellis, 2016).
Tangibles indicate the appearance of physical factors such as equipment, communication materials facilities used by a service company as well as the appearance of service, infrastructure, and employees. Furthermore, aspects of the tangibles factor are such as modern equipment, physical objects, and visually appealing materials. According to the customers, tangible matched customer expectations, and therefore, needs to be maintained tangible (Al Khattab & Aldehayyat, 2011; Suciptawati et al., 2019). Also, many previous studies found Tangible as one of the significant factors affecting customer satisfaction such as Jaber Hossain and Islam (2012), Mei et al. (1999), and Juwaheer (2004).
Reliability is defined as the ability to perform promised services reliably and accurately including service provision, problem solving, pricing, and delivery. In the hotel industry, reliability refers to a hotel’s ability to provide accurate and impartial service the very first time. Based on the research study by Isa and Ahmad (2021) shows a positive relationship between reliability and customer satisfaction. Similar to the researcher Juwaheer (2004), the research result also illustrated the reliability factors as an important service dimension affecting hotel customers’ satisfaction. While, the previous research by Ahmad et al., (2019) and Ali et al., (2021), found that ‘reliability’ had a negative impact on guest satisfaction.
Responsiveness is the willingness to help customers and provide prompt service. This dimension focuses on and includes attitude and accuracy in dealing with requests, punctuality, questions, complaints, customer problems, commitment, and attendance to employees or staff. Responsive value can be enhanced through an attitude and delivery of service by employees to customers. Based on the Saeed, Xizheng, Abdulwase, and Al-Methali (2021) work, shows that responsiveness has a positive relationship with customer satisfaction and was supported by various researchers (Umesh, 2014; Abebe Tessera et al., 2016; Noor & Ali, 2018; Omar Ali et al., 2021).
Assurance can be defined as the knowledge, friendliness, and ability of the company and its employees to instill trust and confidence in their customers. The research findings by Saeed, Xizheng, Abdulwase, and Al-Methali (2021) and Wei (2019) indicate that assurance has a positive relationship with customer satisfaction and predicted assurance as the highest factor outcome of service quality evaluation by customers (Abebe Tessera et al., 2016; Ahmad et al., 2019; Ali et al., 2021; Minh et al., 2015). Unlike, previous studies (Umesh, 2014; Shah, Kakakhel, & Baloch, 2018) show a negative relationship between assurance and customer satisfaction.
Empathy is defined as the caring; individualized attention provided to the customers by their service firms. Based on the research study by Isa et al., (2021) shows a positive relation between Reliability and customer satisfaction. According previous study by Habidin, Fuzi, Ong, Chik, and Muhamad (2019), proved that empathy is the most important factor necessary emphasized and practiced in public organizations located in UTC Kuala Lumpur.
This study used Parasuraman’s (1988) theoretical framework, SERVQUAL. As a service provider, consider two important aspects of service quality and Research services through five criteria: empathy, tangibles, responsiveness, assurance, and reliability.
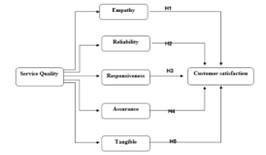
Figure 1: Adopted from Parasuraman’s (1988) theoretical framework, SERVQUAL
RESEARCH METHODOLOGY: DESIGN AND SAMPLING
In this study, quantitative research and descriptive research design was adopted to this study. The quantitative method is used with constructed research questions in gathering the data so that the research goals can be achieved. This research method was chosen primarily because it aims to identify the existing correlations between the study variables (service quality and customer satisfaction). The researcher used a questionnaire to collect the valuable data. Customers in Langkawi were chosen as a sample population, where in 2021 report from the Department of Statistics Malaysia stated that 2.1 million domestic and international tourists have visited Langkawi. By using the Raosft sampling application, it was estimated a total of 383 respondents were selected in this study by employing simple random sampling, as anyone who visited and stayed in the hotel between three to five-star hotels is eligible to be the respondent in this study. The questionnaire was divided into three sections, the first section consisted of a demographic profile and background information. The second part consists of a questionnaire on the factors that influence customer satisfaction based on five dimensions of service quality consisting of 20 questions where each dimension has 4 questions. The researcher used a convenience sampling method. The number of respondents who answered this question will also be done until it reaches the set number of 383 respondents.
Sekaran and Bougie (2016) stated that a questionnaire is a series of written questions in which respondents use multiple-choice alternatives to document their responses. The questionnaire was drawn up and conducted based on a review of the relevant literature according to the research topic. The 1st section contained questions involving participants’ demographic data. The 2nd section was premeditated to evaluate factors that influence customer satisfaction on service quality offered by the hotel industry. The measurement was based on a 5-point Likert scale (1 = strongly disagree, 3 = neutral, 5 = strongly agree). The questionnaire was drawn up and conducted based on a review of the relevant literature according to the research theme.
Data Collection Procedures and Data Analysis
Data will be collected using an online survey using Google Forms. The use of this online survey is for data collection on satisfaction factors and the level of tourist satisfaction with the quality service provided by the hotel industry in Langkawi. The questionnaire will be distributed using an online survey platform through links for Google forms on social media platforms such as WhatsApp, Instagram, Twitter, and Facebook. Data collection will be conducted for approximately two to three months. The data obtained were analyzed using the Statistical Package for Social Science (SPSS) software. To verify the validity and reliability of the scale used to measure customer satisfaction and Service Quality. Descriptive statistics are used to analyze customer satisfaction factors regarding the quality of service provided by the Langkawi hotel sector. Respondents will be determined according to the mean score according to tendencies such as low (1.00-2.33), medium (2.34-3.67), and high (3.68-5.00). Reliability testing is required to measure the stability and accuracy of the questionnaire to measure and evaluate whether the questionnaire is good or not (Sekaran & Bougie, 2016). To investigate the relationship between service quality dimensions and customer satisfaction will use inferential analysis. It is used for the five variables based on the hypothesis that has been built. A Cronbach Alpha value less than 0.6 is identified as weak, while a value of 0.6 and above is acceptable, and if the value is 0.8 and above it means very good. In the normality test, two methods can be used: methods in the form of statistics and graphs. The statistical methods used are the Kolmogorov-Smirnov test and the Shapiro-Wilk test. If the data distribution is normal, then the research data can be analyzed using parametric analysis such as Pearson’s correlation. Whereas if the data distribution is not normal, then non-parametric analysis such as Spearman’s correlation is used (Pallant 2011). The r value for correlation analysis ranges from -1 to 1. A value of +1 indicates that the relationship is normal while 0 indicates no relationship and -1 indicates that the relationship is negative.
FINDINGS
This study involved 390 respondents who have visited hotels in Langkawi. The demographics of the respondents consist of 5 items namely Gender, Age Group, Marital Status, Nationality, and Number of Visits to the Hotel. Table 2 shows there are more female respondents than male respondents involved in this study which is 228 people (58.5%) female respondents and 162 people (41.5%) male respondents. The largest number of respondents who participated in this study were 199 respondents aged 21 to 30 (51.0%) followed by respondents aged 31 to 40 (26.7%), 48 (48%) respondents aged under 20 years, and only 31 people (7.9%) of the respondents aged 41 to 50 years. The least number of respondents involved in this study consisted of respondents who were 51 years old and above, which was 8 people (2.1%) only. The marital status of respondents who are married shows the largest number of 207 people (53.1%) compared to single respondents which is only 183 people (46.9%). The majority of respondents involved in this study consisted of 388 nationals (99.5%) and only 2 foreigners (0.5%). Based on the number of visits to hotels, respondents who have visited hotels in Langkawi 2 to 5 times show the highest number of 167 people (42.8%) followed by those who have visited hotels in Langkawi for the first time, which are 128 people (32.8%) and 10 times or more which is a total of 49 people (12.6%). Meanwhile, the smallest number consists of respondents who visited 6 to 10 times, which is a total of 46 people (11.8%) only.
Table 01 Factor That Influences Customer Satisfaction
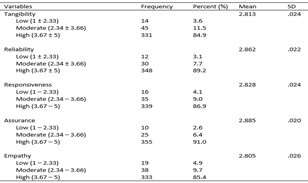
Based on Table 1, the results of the study show that tangibility is on a high scale (3.67 ± 5) with a frequency of 331 with a percentage of 84.9% and reliability shows a high frequency of 348 with a percentage of 89.3% on a high scale (3.67 ± 5). Responsiveness is also on a high scale (3.67 ± 5) with a frequency of 348 with a percentage of 89.2% and assurance also shows a high frequency (3.67 ± 5) with a total frequency of 355 and a percentage of 91.0%. Similarly, empathy shows a high frequency (3.67 ± 5) with a frequency of 333 and a percentage of 85.4%. This shows that tangibility, reliability, responsiveness, assurance, and empathy are factors influencing customer satisfaction on service quality offered by the hotel industry in Langkawi because the majority of respondents answered between a high scale (3.67 ± 5) that they were ‘satisfied’ and ‘very satisfied’. Through the results of the analysis of this study, it can be concluded that all factors affect customer satisfaction on service quality offered by the hotel industry in Langkawi.
Table 02 Level of Customer Satisfaction on Service Quality
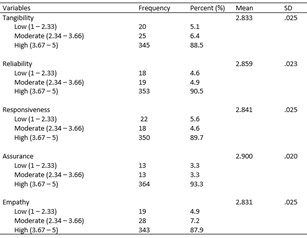
Based on Table II, the study of the level of customer satisfaction on service quality offered by the hotel industry in Langkawi, tangibility shows that the highest frequency is 345 with a percentage of 88.5% in the high part (3.67 ± 5). This indicates that the level of customer satisfaction on service quality offered by the hotel industry in Langkawi for tangibility is at a high level that is they are ‘satisfied’ and ‘very satisfied’. Reliability also shows the highest frequency (3.67 ± 5) with a total frequency of 353 with a percentage of 90.5%. Next, the results of the study for Responsiveness also showed the highest frequency on the high side (3.67 ± 5) with a total frequency of 350 and a percentage of 89.7%. Finally, Empathy also showed the study’s results with the highest frequency being on the highest scale (3.67 ± 5) with a frequency of 343 with a percentage of 87.9%. Assurance also showed the highest frequency on a high scale (3.67 ± 5) with a frequency of 364 and a percentage of 93.3%.
The relationship between tangible, reliability, responsiveness, assurance, and empathy was analyzed using Spearman’s Correlation. The outcomes of the analysis contribute to achieving the research objectives.
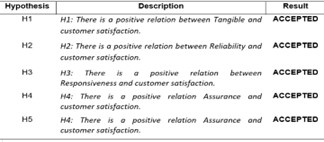
The relationship between tangibles and customer satisfaction was studied using Spearman correlation analysis. There is a positive (large) correlation between the two variables, rho = .614, n = 390, p < .0005. This shows that tangibles have a strong relationship with customer satisfaction. Therefore, H1 is supported.
The relationship between reliability and customer satisfaction was studied using Spearman correlation analysis. There is a positive (large) correlation between the two variables, rho = .552, n = 390, p < .0005. This shows that reliability has a strong relationship with customer satisfaction. Therefore, H2 is supported.
The relationship between responsiveness and customer satisfaction was studied using Spearman correlation analysis. There is a positive (large) correlation between the two variables, rho = .664, n = 390, p < .0005. This shows that responsiveness has a strong relationship with customer satisfaction. Therefore, H3 is supported.
The relationship between assurance and customer satisfaction was studied using Spearman correlation analysis. There is a positive (large) correlation between the two variables, rho = .651, n = 390, p < .0005. This shows that assurance has a strong relationship with customer satisfaction. Therefore, H4 is supported.
The relationship between empathy and customer satisfaction was studied using Spearman correlation analysis. There is a positive (large) correlation between the two variables, rho = .647, n = 390, p < .0005. This shows that empathy has a strong relationship with customer satisfaction. Therefore, H5 is supported.
Table 03 Summary of Hypothesis
DISCUSSION
The SERVQUAL model was chosen for this study because it is one of the most widely used models in research, especially in the hospitality industry. The SERVQUAL approach remains the best benchmark for cross-sectional studies and industry benchmarking (Grönroos, 2000). Similarly, Gencer and Akkucuk, (2017) state that, the SERVQUAL model is the most well-known model for measuring service quality and customer satisfaction in the service industry. To ensure an acceptable instrument for analyzing research, Cronbach’s alpha is used. The reliability test for five service quality dimensions was as follows; Reliability Statistics Cronbach’s Alpha for tangibility was Cronbach’s Alpha ∂=.857, for reliability Cronbach’s Alpha ∂=.921, for responsiveness, Cronbach’s Alpha was ∂=.930, for assurance Cronbach’s Alpha ∂=.916 and empathy Cronbach’s Alpha was ∂=. 925. The reliability test for the Five service quality dimensions is accepted for future analysis because it exceeds 0.6. According to the findings, all SERVQUAL dimensions are factors that affect customer satisfaction in Langkawi. This shows that hotel guests will be satisfied if the SERVQUAL dimension is used in all hotels in Langkawi and other hotels.
CONCLUSIONS
In conclusion, according to the findings of this study, using this SERVQUAL dimension is the best way that can be used in the hospitality industry to measure hotel service quality. Hotel managers in Langkawi can mainly use this method to evaluate hotel quality and can also be used by other hotels. In this way, the service quality can be improved and can maintain guest satisfaction while also being able to raise the name, and image of the hotel and increase profits. The 5-dimensions of service quality that have been highlighted in this study are found to be strong and important factors to be given the main attention in improving the level of service quality provided and at the same time can increase the level of customer satisfaction. Based on the results of the study, shows that assurance is one of the most critical factors that influence customer satisfaction and shows the highest level of satisfaction at hotels in Langkawi. So, recommended to all hotel operators in Langkawi to always strive to provide the best quality service to customers since the main source of income in Langkawi is from the hospitality and tourism sectors. To ensure that the quality of service is at a satisfactory level for a long period, hotel managers need to conduct training for staff so that the quality of service delivered to customers can be improved in various aspects.
ACKNOWLEDGMENT
Technical and financial assistance from Universiti Teknologi MARA, Cawangan Pulau Pinang is gratefully acknowledged.
REFERENCES
- Al Khattab, S. A., & Aldehayyat, J. S. (2011). Perceptions of service quality in Jordanian hotels. International Journal of Business and Management, 6(7), 226.
- Al-Ababneh, M. M. (2017). Service quality in the hospitality industry. Available at SSRN 3633089.
- Alauddin, M., Ahsan, S. H., Mowla, M. M., Islam, M. M., & Hossain, M. M. (2019). Investigating the relationship between service quality, customer satisfaction, and customer loyalty in the hotel industry: Bangladesh perspective. Global Journal of Management and Business Research, 19(1), 1-8.
- Ali, BJ, & Anwar, G. (2021). Work Engagement: How Does Employee Work Engagement Influence Employee Satisfaction, 10-21. International Journal of Advanced Engineering, Management and Science. 7(6), 10-21.
- Ali, B. J., Gardi, B., Othman, B. J., Ahmed, S. A., Ismael, N. B., Hamza, P. A., Aziz, H. M., Sabir, B. Y., Anwar, G. (2021). Hotel Service Quality: The Impact of Service Quality on Customer Satisfaction in Hospitality. International Journal of Engineering, Business and Management, 5(3), 14–28.
- Ali, BJ, & Anwar, G. (2021). An Empirical Study of Employees’ Motivation and Its Influence on Job Satisfaction. International Journal of Engineering, Business and Management, 5(2), 21-30.
- Ali, S. R. O., Norizan, S. N., Said, N. S. M., Mat, K. A., & Jislan, F. (2021). Assessing Customer Satisfaction Towards Service Quality in the Hospitality Industry. Jurnal Intelek, 16(1), 67-73.
- Amin, M., Yahya, Z., Ismayatim, W. F. A., Nasharuddin, S. Z., & Kassim, E. (2013). Service quality dimension and customer satisfaction: An empirical study in the Malaysian hotel industry. Services Marketing Quarterly, 34(2), 115-125.
- Anwar, G., & Abd Zebari, B. (2015). The Relationship between Employee Engagement and Corporate Social Responsibility: A Case Study of Car Dealership in Erbil, Kurdistan. International Journal of Social Sciences & Educational Studies, 2(2), 45.
- Boon-Itt, S., & Rompho, N. (2012). Measuring service quality dimensions: An empirical analysis of Thai hotel industry. International Journal of Business Administration, 3(5), 52.
- Carrillat, F. A., Jaramillo, F., & Mulki, J. P. (2007). The validity of the SERVQUAL and SERVPERF scales: A meta‐analytic view of 17 years of research across five continents. International Journal of Service Industry Management.
- Fakfare, P., Manosuthi, N., Jin, S.l., Han, H., and Jin, M, (2025). Customer word-of-mouth for generative AI: Innovation and adoption in hospitality and tourism. International Journal of Hospitality and Tourism, 126 (2025), 1-12.
- Fida, B. A., Ahmed, U., Al-Balushi, Y., & Singh, D. (2020). Impact of service quality on customer loyalty and customer satisfaction in Islamic banks in the Sultanate of Oman. Sage Open, 10(2), 2158244020919517.
- Gencer, Y. G., & Akkucuk, U. (2017). Measuring quality in automobile aftersales: Auto SERVQUAL Scale. Amfiteatru Economic Journal, 19(44), 110-123.
- Getty, J. M., & Thompson, K. N. (1995). The relationship between quality, satisfaction, and recommending behavior in lodging decisions. Journal of Hospitality & Leisure Marketing, 2(3), 3-22.
- Ghazi, K., Kattara, H., Salem, I. E., & Shaaban, M. N. (2025). Benefit-triggered or trust-guided? Investigation of customers’ perceptions towards AI-adopting hotels amid and post-COVID-19 pandemic. Tourism and Hospitality Research, 25(1), 38-56.
- Grönroos, C. (1984). A service quality model and its marketing implications. European Journal of Marketing, 18(4), 36-44.
- Habidin, N. F., Fuzi, N. M., Ong, S. Y. Y., Chik, T. W. T., & Muhamad, U. A. (2019). Pembangunan Belia Cinta Tanggungjawab Sosial Korporat dalam Menjana Integriti dan Sosio-Eknomi Negara. Pembangunan Pengetahuan Dalam Pengurusan, Pendidikan Dan Sains Sosial: Idea Dan Penyelidikan Awal. Kaizentrenovation Sdn Bhd.
- Isa, N. N. F. M., & Ahmad, N. (2021). Kepuasan Pelanggan Terhadap Kualiti Perkhidmatan Pos Malaysia dan Gdex di Skudai. Research in Management of Technology and Business, 2(1), 137-152.
- Jaber Hossain, M., & Islam, A. (2012). Understanding perceived service quality and satisfaction: A study of Dhaka University Library, Bangladesh. Performance Measurement and Metrics, 13(3), 169-182.
- Juwaheer, T.D. (2004) Exploring International Tourist’s Perceptions of Hotel Operations by Using a Modified SERVQUAL Approach—A Case Study of Mauritius. Managing Service Quality, 14, 350-364.
- Kotler, P. and Keller, K. (2009) Marketing Management. Global Edition, Pearson Education Inc., Upper Saddle River.
- Mei, A. W. O., Dean, A. M., & White, C. J. (1999). Analyzing service quality in the hospitality industry. Managing Service Quality: An International Journal, 9(2), 136-143.
- Minh, N. H., Ha, N. T., Anh, P. C., & Matsui, Y. (2015). Service quality and customer satisfaction: A case study of hotel industry in Vietnam. Asian Social Science, 11(10), 73-83.
- Oliver, R. L. (1996). Varieties of value in the consumption satisfaction response. ACR North American Advances.
- Parasuraman, A., Zeithaml, V.A., and Berry, L.L. (1988) SERVQUAL: A Multiple-Item Scale for Measuring Consumer Perceptions of Service Quality. Journal of Retailing, 64, 12-40.
- Pizam, A., Shapoval, V., & Ellis, T. (2016). Customer satisfaction and its measurement in hospitality enterprises: a revisit and update. International Journal of Contemporary Hospitality Management, 28(1), 2-35.
- Priyo, J. S., Mohamad, B., & Adetunji, R. R. (2019). An examination of the effects of service quality and customer satisfaction on customer loyalty in the hotel industry. International Journal of Supply Chain Management, 8(1), 653-663.
- Qaiser Danish, R., Afzal Humayon, A., Javaid Iqbal, H., Raza, S., & Shahid, J. (2018). The impact of service quality and service value on customer satisfaction through customer bonding: evidence from the telecommunication sector. European Online Journal of Natural and Social Sciences: Proceedings, 7(1 (s)), pp-40.
- Roslan, N. A. A., Wahab, E., & Abdullah, N. H. (2015). Service quality: A case study of the logistics sector in Iskandar Malaysia using SERVQUAL model. Procedia-Social and Behavioral Sciences, 172, 457-462.
- Saeed, M. M. Q., Xizheng, Z., Abdulwase, R., & AL-Methali, M. A. (2021) Measuring the Relationship Between Service Quality and Customer Satisfaction in the Hotel Industry. International Journal of Scientific and Research Publications, 11(8), 336-347
- Saleh, F., & Ryan, C. (1991). Analyzing service quality in the hospitality industry using the SERVQUAL model. Service Industries Journal, 11(3), 324-345.
- Sekaran, U., & Bougie, R. (2016). Research methods for business: A skill building approach. John Wiley & sons.
- Shah, S. N. U., Kakakhel, S. N. & Baloch, Q. B. (2018). Role of service quality and customer satisfaction in firm’s performance: Evidence from Pakistan hotel industry. Pakistan Journal of Commerce and Social Sciences (PJCSS), 12(1), 167-182.
- Sharma, S., & Srivastava, S. (2018). Relationship between service quality and customer satisfaction in the hotel industry. TRJ Tourism Research Journal, 2(1), 42-49.
- Suciptawati, N. L. P., Paramita, N. L. P. S. P., & Aristayasa, I. P. (2019, October). Customer satisfaction analysis based on service quality: the case of a local credit provider in Bali. Journal of Physics: Conference Series, 321(2), 22-55.
- Tabaku, E., & Cerri, S. (2016). An assessment of service quality and customer satisfaction in the hotel sector. In Faculty of Tourism and Hospitality Management in Opatija. Biennial International Congress. Tourism & Hospitality Industry (p. 480). University of Rijeka, Faculty of Tourism & Hospitality Management.
- Tessera, F. A., Hussain, I. A., & Ahmad, N. (2016). Service quality and hotel’s customer satisfaction: Empirical Evidence from Ethiopia. Electronic Journal of Business and Management, 1(1), 24-32.
- Umesh, G. (2014). Relationship between service quality and customer satisfaction in Sri Lankan hotel industry. International Journal of Scientific and Research Publications, 4(11), 2250-3153.
- Wei, Y. K. (2019). The impact of service quality on customer satisfaction of a hotel at Johor Bahru, Malaysia. Journal of Arts & Social Sciences, 3(1), 34-46.
- Zeithaml, V. A., Bitner, M. J., & Gremler, D. D. (2006). Services marketing: Integrating customer focus across the firm. McGraw-Hill/Irwin.