
A study of the factors Affecting the Profitability of Zambian Commercial Banks. A Case of Zanaco
- Prudence Mumba
- Dr Euston Kapotwe
- 3160-3182
- May 25, 2024
- Banking
A study of the factors Affecting the Profitability of Zambian Commercial Banks. A Case of Zanaco
Prudence Mumba1, Dr Euston Kapotwe2
1Graduate School of business, University of Zambia.
2Lecturer, University of Zambia, Great East Road Campus, P.O Box 32379, Lusaka, Zambia
DOI: https://dx.doi.org/10.47772/IJRISS.2024.804294
Received: 24 March 2024; Revised: 18 April 2024; Accepted: 23 April 2024; Published: 25 May 2024
ABSTRACT
All businesses regardless of the nature require profitability for them to progress. Therefore, this thesis is aimed at assessing Zanaco’s profitability using ratio analysis, through three major objectives (i) To ascertain Zambia National Commercial Bank’s ability to generate return to its shareholders during the period 2016-2021. (ii) To determine Zambia National Commercial Bank’s ability to convert sales into profit during the period 2016-2021. (iii) To identify internal factors influencing Zambia National Commercial Bank’s ability to generate profit and returns to its shareholders during the period 2016-2021. The study used both primary and secondary information. Primary information was collected through structured questionnaires. Data analysis was done through SPSS V26 for primary data and excel for secondary data for the period 2016 – 2021, the response rate of primary data collection which was physically administered to Zanaco employees was 35 respondents indicating a 65%. Secondary data was collected through the analysis of Zanaco’s financial statements for the period 2016-2021. The findings review that the profitability ratios show that the bank has a stable ROA, and ROE, but low EPS and ROCE. The Low NPM below 30% for the years under review thus implying that Zanaco is minimally profitable, because of Zanaco’s high Expense operational ratios EOR. Zanaco bank is liquid as it is able to convert its assets to cash easily, but does not have enough cash flow. Additionally, the bank is affected, by inflation and macro-economic factors, however due to the bank size, capital, asset quality, credit rating and effective cost management strategies the bank is able to withstand turbulent economic impacts.
Keywords: Financial Ratios, Financial Statements, Financial Ratio Analysis, macroeconomic, inflation, profitability.
INTRODUCTION
Profitability is the fundamental reason for all businesses. Entrepreneurs, shareholders and companies take up the risk of investment in business with a reason of profit maximization. Profit is the financial gain realized when revenue generated from a business activity exceeds the expenses, costs and taxes involved in sustaining company operations, Profitability acts as an indicator of the progress of the company. It is however, unclear if many companies conduct profitability analysis or not, consequently, profitability ratios are a measure of the profit earning ability of the business (Schmidlin, 2012).
Currently, the Bank of Zambia (2021,16) indicates that the banking industry has been recording Return on Equity (ROE) ratios that are relatively lower than the set benchmark and generally exhibiting a downward trend over the past decade. This implies that the banks’ efficiency in generating net income from shareholder’s equity has been generally declining over the past decade. Knowing the significance of profitability in realising sustainable growth and stability, it is imperative to extensively research on the internal intricacies surrounding the perceived declining efficiency in profit generation of the banking sector. Most importantly, there is need to ascertain the profitability-oriented performance measurement of commercial banks in Zambia so as to develop an in-depth understanding of their profit generating potential. Zambia National Commercial Bank (ZANACO) Plc. is currently the largest commercial bank in Zambia by customer base, financial intermediation and distribution networks. In 2021, it had 60 branches with over 200 ATMs, and about 8000 Xpress agents distributed nationwide (ZANACO, 2021).
Notable prior studies on accessing commercial Banks’s profitability has been conducted both in developed and developing countries which include; (Gržeta, et al., 2023) Europe, (Meriläinen & Junttila, 2020) in west Europe (Iacobelli, 2017) in turkey, (Jigger & Korolova, 2023), in China (Sufian & Chong, 2013) in the Philippians and (Khizer, et al., 2013) in Pakistan. Which mainly studied profitability using Basel III framework, comparative empirical evidence, macro-economic factors affecting profitability, and accelerants of bank profitability in stable growing economies. In Africa studies by (Almaskati, 2022) was conducted in Nigeria, (Gwahula, 2013) in East Africa, and (Zawadi, 2014) in Tanzania, who studied, Efficiency of commercial banks, determinants of banks’ profitability, In Zambia a studies by (Momba, 2019) studied determinant of bank profitability in Zambia was conducted . Only one study that accesses Zanaco bank’s profitability by (Chishiba, 2019 ) has been conducted but with a shorter review period from 2013-2016, before the economic turn down and COVID-19, Moreover, no study has been done that addresses external factors (macro-economic factors) impacts Zanaco’s profitability. Additionally, (Bank of Zambia, 2021) reported that the banking industry in Zambia has recorded low profitability ratios than the set benchmark, with some banks unable to declare dividends. However, little is known if Zanaco being one of the largest commercial banks in Zambia, is part of the banks with low profitability benchmark set by the bank of Zambia. Therefore, through the use of financial ratios and analysis of Zanaco from (2016-2021). The study will access Zanaco’s profitability potential and the external factors that have affected Zanaco’s profitability.
The parts of the study are as follows: Section two covers literature review while section three covers the theoretical and conceptual framework. Section four cover the research methods. Sections five and six presents the results and discussion of the research findings. Lastly, section eight concludes and suggests recommendations of the study.
LITERATURE REVIEW
Overview of the banking system in Zambia
Before independence, only three Commercial Banks existed in Zambia, namely Barclays bank formed in 1918, Standard Chartered bank formed in 1906 and the Grindlays Bank formed in 1956. The objectives of these commercial banks was to propel the mining sector and the success of foreign citizens. After independence, a first economic reform in 1968 decided that all foreign banks be publicly owned with the objectives of serving the local population. Which was not a success as they were threats by the banks of withdrawing expatriate management which Zambia didn’t have. In this view the government established the Zambia National Commercial Bank (ZANACO) publicly owned so as to serve local needs. A follow up act was enacted in 1965 repelling the 1959 Act, which did do change the contents of the previous act but rather reflected a new government perspective. In 1972, another Banking Act was enacted to replace the 1965 Act. This new Act reflected the new nationalism policy adopted by the government at the time. The Act allowed for increased government influence in commercial banks’ activities and regulation. Following this act several other institutions were established such as the cooperative Bank, Zambia National Building Society, Lima Bank, National Savings and Credit Bank etc. leading to reduced monopoly in the market (Mushota, 2002). The act was however amended in 2000 to cater for future financial institutions, such as Microfinance institutions.
In 1992 after liberalisation there was, a new Banking Act allowed for more independence and proper regulation of commercial banks. The Act called for the banks to have adequate capital, proficient management, run a profitable business, judicious financial history and serve the local needs. The act also stipulated the roles and activities of commercial banks in respect to fraud and mismanagement and curb any of such. Most significantly, the Act enhanced the bank of Zambia to issue prudential directives which includes, monetary regulation capital adequacy giving BOZ the overall regulatory authority over all commercial banks different to the previous act which gave the government control. Therefore, the 1996 BOZ Act also changed the Central Banks’ decree to formulating and implementing monetary policy that ensures price stability and financial systems stability. This essentially changed BOZs position from merely ensuring compliance to regulation of financial sector (Mushota, 2002). However, it is unfortunate that after the act many banks collapsed mainly because an increase of commercial banks after 1991 -2000 due to liberalization. By 1994, the country had 18 commercial banks from 10 in 1990. Due to economic changes some banks were unable to continue operating due to various reasons some were liquidated as shown in the table below:
Table 1: Bank Liquidation dates and causes
| Name of Bank | Liquidation Date | Few causes of Liquidation |
| Meridien BAIO Bank | 19 May, 1995 | Insider trading, poor credit management, high expenses, failure to recapitalize |
| Africa Commercial Bank | 13th November, 1995 | Non-performing loans, low liquidity, failure to recapitalize, insider trading, no depositor insurance. |
| Commerce Bank | 29th November, 1995 | High default on loans, failure to recapitalize, non-performing loans. |
| Zambia Export and Import Exim | 19th February, 1997 | Failure to recapitalize. |
| Prudence | 18th October, 1997 | Failure to recapitalize, heavy external borrowing, poor management, |
| Credit Africa Bank | 28th November, 1997 | High number of outstanding loans, low depositor security, fraudulent transactions. |
| Manifold Investment Bank | 4th December, 1997 | Liquidity problems, failure to meet capital requirements, low deposit security. |
| First Merchant Bank | 2nd February, 1998 | Poor depositor security, Adverse Press reports, failure to meet obligations. |
| Union Bank | 13th February, 2001 | Non-performing loans, insider trading, failure to meet capital obligations. |
| United Bank of Zambia | 24th May, 2006 | Failure to recapitalize. |
| Intermarket Banking Corporation | 29th November, 2016 | Repossessed by the BOZ due to financing problems. |
Source: (Momba, 2019)
The table shows that most banks were liquidated for almost the same reason, profitability and poor restrictions fraudulent activities. Undoubtable the unfavourable economic environment contributed to the liquidation of most banks. Consequently, the situation has since improved currently as many commercial banks now adhering to the regulations set by bank of Zambia (Sandi, 2010)
Zambian banking sector structure
The Banking Sector is administered by the Banking and Financial Services Act (BFSA) of 1994 which gives the authority to BOZ to regulate commercial banks and other financial services. All licensed banks in Zambia are represented by Bankers Association of Zambia (BAZ). Currently Zambia has 17 commercial banks with eight been subsidiaries of foreign banks, seven are locally owned private banks and two partially government owned. Subsidiaries of foreign banks imply banks that are locally incorporated but are subsidiaries of foreign banks whilst locally owned private banks imply banks with at least 51% equity shares are owned by a Zambian citizen or entities incorporated in Zambia. Whereas banks formed by an act of parliament are two these include: Development Bank of Zambia (DBZ) and National Savings and Credit Bank (NATSAVE) (Bank of Zambia, 2021). However Foreign subsidiaries have a high market share in terms of total assets, loans, deposits and profitability. Followed by partially government owned banks. By the end of 2016, foreign subsidiaries had 70.8% of assets, 68.1 of loans, 70.4% of deposits and a profit share of 97.2% with government owned banks taking 8.9% and local banks, -6.1%. a clear indication that foreign owned banks performed better than local banks thus having more customer base (Mushota, 2002).
Models of Financial Ratios Analysis
According to Myers (2003), ratio analysis of financial statements is a study of relationship among various financial factors in a business as disclosed by a single set of statements and a study of trend of these factors as shown in a series of statements. Financial ratio analysis groups the ratios into categories that tell us about the different facets of a company’s financial state of affairs (Westerfield, 2002). Some of the common categories of financial ratios are Profitability ratios, Liquidity ratios, Asset utilization ratios etc. Since the purposes of this study is to conduct a profitability ratio analysis, it will only focus on profitability ratios.
Profitability ratios are financial metrics used by various financial players such as analysts and investors to evaluate the corporation’s ability to utilizes its assets to generate profit and value to shareholders (Myers, 2003). Generally, these ratios represent the final results of business operations and they are generalized into two broad categories:
Margin ratios: These ratios show the company’s ability to convert sales into profits at various degrees of measurement (Tulsian, 2014). They show the relationship between profit and sales of a corporation. The following are some of the widely utilised margin ratios in literature:
EBITDA Margin: EBITDA stands for Earnings before Interest, Taxes, Depreciation, and Amortization. EBITDA margin is a profitability ratio that measures how much in earnings a company is generating before interest, taxes, depreciation, and amortization, as a percentage of revenue (CFI, 2022).
Operating Profit Margin: This establishes the relation between operating profits and net sales. The main objective of computing this ratio is to determine the operational efficiency of the management.
Net Profit Margin: This is obtained when all operating expenses, interest and taxes are subtracted from the gross profit. This ratio indicates the management’s efficiency in producing, administering and selling of its goods and services.
Cash Flow Margin: This expresses the relationship between cash flows from operating activities and sales generated by the business. It measures the ability of the company to convert sales into cash, managing cash flow is critical to a company’s success because always having adequate cash flow both minimizes expenses (e.g., avoid late payment fees and extra interest expense) and enables a company to take advantage of any extra profit or growth opportunities that may arise (CFI, 2022).
Return ratios: These ratios represent the company’s ability to generate returns to its shareholders.
Return on Equity (ROE): This ratio expresses the percentage of net income relative to stockholders’ equity, or the rate of return on the money that equity investors have put into the business Companies with a high return on equity are usually more capable of generating cash internally, and therefore less dependent on debt financing.
Return on Assets (ROA): Managers often measure the performance of the firm by the ratio of income to total assets (income is usually defined as earnings before interest but after taxes).
Return on Capital Employed (ROCE): is a profitability or performance measure of the return earned by those who provide capital, namely the firm’s bondholders and stockholders.
Internal factors influencing bank profitability
Factors that affect banks profitability can be streamlined in twofold: namely internal and external factors. External factors are normally beyond the control of the bank whereas internal factors are those which are within the power of the bank. The paper will discuss the following internal factors operating efficiency, bank size, credit risk, capital adequacy, liquidity risk and market concentration.
Operating efficiency
Operating efficiency is the ability of the company to lower costs in its pursuit to achieving its objectives, which is achieved through a blend of right people, process and technology. With right mixture of resources, business operation of any company will enrich productivity of services or goods offered, (Lotto & Papavasillion, 2019), (Mohanty & Sanker, 2020).
Notably many scholars such as (Mohanty & Sanker, 2020), (Lotto & Papavasillion, 2019), mainly recognises capital adequacy as the major determining factor of bank operating efficiency. (Lotto & Papavasillion, 2019), in their study found that the liquidity of banks and capital adequacy is significantly correlated to bank operating efficiency. Showing that capital adequacy and liquidity do not only improve banks’ financial stability by giving a larger capital cushion and rising bank liquidity level, but also increase bank operating efficiency by lowering moral hazard between bank shareholders and debt-holders, thus creating value for commercial banks. A similar study by (Mohanty & Sanker, 2020) found that companies with more capital operate more professionally comparative to companies with less capital. The two studies therefore show the importance of capital adequacy in financial institutes and or banks.
Prior studies showed that, large banks are anticipated to be so efficient in relation to small banks, the attributing factor is that banks big in size are capable to mobilize resources, like technology, material and human resource to improve operating efficiency reveal that larger banks are less efficient in conversion economies (Sanchez & Barkus, 2013), whereas , (Gwahula, 2013).
Credit risk if were handled has the capability of enhancing bank efficiency, (Lotto & Papavasillion, 2019), argues that that quality of assets of the banks and cost efficiency are significantly associated meaning that the management of non-performing loans has the effect of reducing costs associated with loans portfolio.
All types of banks require liquid assets to cater for operational costs and meets customer’s withdrawals. The risk of liquidity often arises when the banks fail to accommodate decreases in liabilities (Momba, 2019) found a strong negative relationship between liquidity and bank profitability meaning that increased liquidity has a bearing on interest earning asset.
A study by (Gwahula, 2013) found that one of the determinants of a bank’s profitability is market concentration, which impacts a bank’s performance and is measured by the return on assets and return on equity. (Almaskati, 2022) also found that internal factors such as market concentration has a positive association with the bank’s performance.
The study represents those empirical studies on bank profitability in both developing and developed countries. The studies focus, on both internal and external factors on bank profitability.
(Almaskati, 2022), conducted a study in New Zealand a developed country, which analysed the comparative importance, of determinants of bank and profitability using random forest’s relative value importance measure. The results found that bank’s profitability is mainly determined by bank-specific factors, while a bank’s risk is predominantly impacted by country-level factors. The study also inclines that the proxies for market power and size have significant influence in impacting both the bank’s profitability and its risk profile. Additionally, the study outlines the importance of the presence of a major role for a country’s financial development together with status and regulatory quality, which impacts the bank’s risk. In conclusion the analysis also confirmed the presence of a small number of dominant determinants of a bank’s profitability in contrast to the absence of clear dominant determinants of a bank’s riskiness.
(Iacobelli, 2017) investigated the factors determining bank profitability mainly in 16 global banks the study used a panel study over the period 1980-2015. This study focused on the effect of bank characteristics, industry structure and macroeconomic variables on profitability and using Fixed Effects and Generalised Method of Moments (GMM), in which all factors were discovered to be instrumental in explaining bank profitability. The study found that Bank specific factors had the most influence on bank profitability. The study also reveal that Bank capital has a positive impact on profit, measured using ROA and ROE, whilst credit risk and operating efficiency have a negative impact.
A similar study by (Mirzaei, et al., 2013) in developed markets found that developed markets have higher profitability, on the other hand the study policies targeted towards promoting competition may lead to threatening the individual banks. The study also reveals that higher interest-margin revenues in developing markets cause higher profitability and even banks since banks use the higher margins to shelter probable credit losses.
(Lotto & Papavasillion, 2019) in Tanzania, investigated the operating efficiency of 36 commercial banks in Tanzania in a period of 2000 and 2017. The results of the study show that bank liquidity and capital adequacy have a significant relationship with operating efficiency. The study also suggests that there is a relationship between bank profitability and operating efficiency, indicating that banks should emphasis on the improvement of bank earnings, to improve operational efficiency.
(Mohammad, 2013) investigated management controllable factors that determine bank profitability in Jordan on banks listed under the Amman Stock Exchange ASE from the period of 2005-2011, the study found that the profitability of the Jordanian commercial banks has a significant influence to operational efficiency, whereas liquidity risk, credit risk, credit composition (net credit to total assets), capital adequacy (equity to assets) and bank size did not show any statistical effect on profitability.
A similar study by (Khizer, et al., 2013) examined the profitability of the banking sector in Pakistan between the period of 2006 to 2009. The study revealed that profitability was positively correlated to bank size, operating efficiency, portfolio composition, asset management, the study also showed that capital negatively correlated with credit risk in the case where profitability is measured by ROA. When profitability was measured by ROE, profit was found to be positively affected by capital, portfolio composition and asset management whilst size, operating efficiency and credit risk had a negative impact on profit.
(Gwahula, 2013), in east Africa reveals that bank efficiency improved after financial restructuring. The attributed factor is the improvement in the risk management process in bank operation. The study also revealed that financial restructuring has enhanced competition thus improving efficiency.
(Zawadi, 2014), examines the effects of internal bank specific factors and macroeconomic factors on banks’ profitability in Tanzania, using panel data constituting of 23 banks in period 2009-2013. The results indicated that larger banks have improved bank capital, assets quality, efficient management of banks expenses as well as liquidity management has impacted to larger profits in Tanzanian banks.
A study by (Momba, 2019) in Zambia which explores the determinants of the profitability of banks in Zambia during the period January 2010 to December 2016. The study investigated 17 commercial banks registered by the Bank of Zambia. The empirical study showed that bank size, the ratio of loan loss provision to total assets and total loans to assets significantly affect bank profitability regardless of the profitability measure employed. Furthermore, the study found that banks pay more to depositors than they receive from loans.
A more specific study by (Chishiba, 2019 ), was conducted in Zambia to review the financial performance of ZANACO in the period between 2013-2015, using profitability ratio analysis, the results reveal that Zanaco was liquid, noted through the easiness to convert assets to cash, and that the bank was profitable from its services, in additional the bank was also able to meet its long-term obligations except the debt to equity. Indicating that the bank is financially sound with stable profitability.
THEORETICAL FRAMEWORK
The study will be guided by uncertainty bearing Theory of Profits, Frictional Theory of Profits, Monopoly Theory of Profits, Innovations Theory of Profits and Managerial Efficiency Theory of Profits,
The Uncertainty Bearing Theory of Profits
This ideology is anchored on the “Uncertainty Bearing Theory of Profits was propounded by an American economist Prof. Frank. H. Knight (Hosen, 2022). The theory states that, pure profits are directly linked with uncertainty and non-insurable risk bearing, the theory states that they are internal risk factors that greatly affects the profitability of all commercial banks as such, bearing these risks with an effective management system in place intended to keep them in desirable levels will ensure that banks generate profits and sustain their competitiveness in the industry
This theory states that there exists a normal rate of profit which is a return on capital that must be paid to the owners of capital as a reward for saving and investment of their funds rather than to consume all their income or hoard them, (Almaskati, 2022).
This theory explains that above-normal profits is attributed to monopolise influence power enjoyed by firms (Makadok, 2011). It is inevitable that firms with monopoly power restrict output and charge higher prices than under perfect competition. This causes above-normal profits to be earned by the monopolistic firms (Murphy & Walsh, 2022).
This theory of profits explains that economic profits arise because of successful innovations introduced by the entrepreneurs, to their business (Makadok, 2011).The main purpose of the entrepreneur is to familiarize innovations in the economy and profits are reward for his performing this function. Therefore, innovation is basically a new measure or policy adopted by an entrepreneur to reduce their cost of production or to increase the demand for.
Managerial Efficiency Theory of Profits:
Managerial efficiency theory of profits recognizes that some firms are more efficient than others in terms of management of productive operations and successfully meeting the needs of consumers. The theory further states that companies with average level of efficiency mostly earns average rate of return
Conceptual Framework
Based on the reviewed theories and prior empirical studies, the formulated conceptual framework shows that the profitability of commercial banks is directly linked internal factors, such as profitability, return to Shareholders, Sales related factors, and external factors.
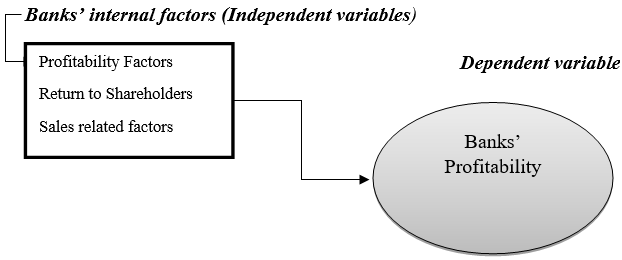
Source: Author(s)
Figure 1
RESEARCH METHODS.
The researcher adopted a mixed research approach. That is, both qualitative research approach and quantitative research approach was used by the researcher so as to provide an in-depth understanding of the research questions.
Data collection
The data collected i.e.; financial reports were attained through secondary research on the bank’s website, between the period 2016 to 2021. only audited financial statements were considered.
Research instruments for primary data collection
The instruments that were used to collect this type of data was semi-structured questionnaire, the questions contained both open and closed ended questions
The research used the following profitability ratios to ascertain profitability: Liquidity, solvency, and profitability, all financial information was collected from 2016-2021. Quantitative data was analysed using SPSS, (Descriptive, and inferential) and MS Excel, where different tests were run.
The secondary data of the study was realisable because most information used was collected from audited financial statements from the period of 2016-2021, additionally, the formulas for calculating profitability used were also from one main source, which increases the reliability and validity of the research and also brings consistency
Zambia National Commercial Bank’s ability to generate return to its shareholders during the period 2016-2021
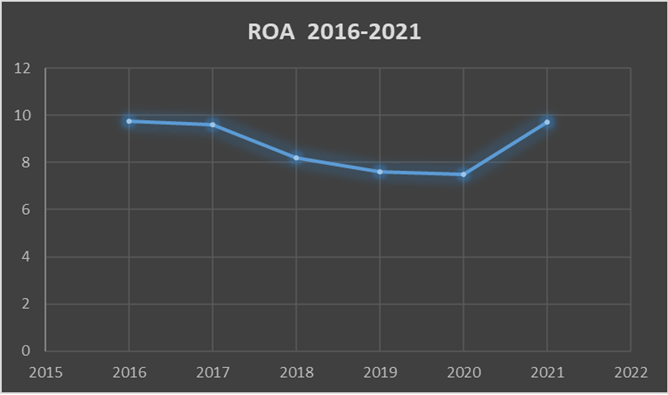
Table 6, shows the calculated 2016-9.74%, 2017-9.6%, 2018-8.2%, 2019-7.6% 2020-7.5% and 2021-9.71. It can be seen that the ROA of Zanaco was high from 2016-2017, there was a decline from 2018-2020, then the ROA improved in 2021, the fluctuation can be show in figure 2.
| Return on Assets (2016-2021) | |||||
| Year | Net Income | Total Assets | ROA | % | Acceptable Rate |
| 2016 | 796709 | 8175485 | 0.097451 | 9.74 | 5% |
| 2017 | 918025 | 9543088 | 0.096198 | 9.6 | 5% |
| 2018 | 879590 | 10614067 | 0.08287 | 8.2 | 5% |
| 2019 | 904638 | 11885289 | 0.076114 | 7.6 | 5% |
| 2020 | 1449696 | 19340292 | 0.074957 | 7.5 | 5% |
| 2021 | 2538687 | 26104104 | 0.097252 | 9.71 | 5% |
| Mean | 7.5 | ||||
Table 3
Figure 2 shows the trend of the ROA through a graph from period 2016-2021, it can clearly be seen that Zanaco’s ROA has flaucated over the period under review
Return on Equity
Table 4 shows that the ROE has been inconsistent over the years, with 2016-0.73, 2017-0.89, 2018-1.07, 2019-0.96 and 2020-1.23. It can be seen that the ROE has been low from 2018-19 and with consistent improvement from 2020-21
| Return on Equity 2016-2021 | ||||
| Year | Net Income | SHW | ROE | Acceptable Rate |
| 2016 | 796709 | 1081063 | 0.736968 | 0.20 |
| 2017 | 918025 | 1024052 | 0.896463 | 0.20 |
| 2018 | 879590 | 820908 | 1.071484 | 0.20 |
| 2019 | 904638 | 940879 | 0.961482 | 0.20 |
| 2020 | 1449869 | 1171798 | 1.237303 | 0.20 |
| 2021 | 2538687 | 2053652 | 1.236182 | 0.20 |
| Mean | 0.328818 | |||
Table 4
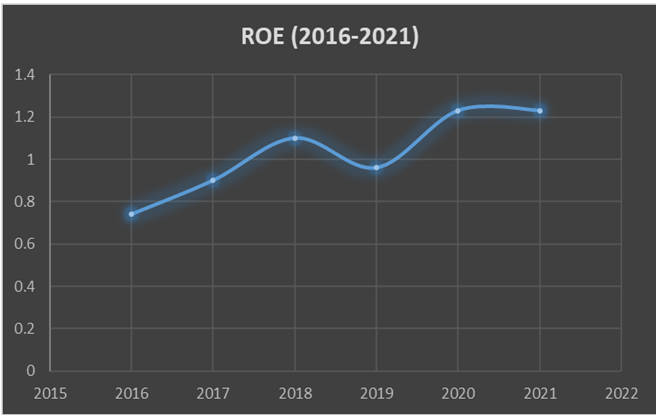
Figure 3
Return on Capital Employed (ROCE)
Table 5 and figure 3 show that the ROCE has been poor over the years under review despite the ratio improving from 2019 -2021 regardless of the improvement all ratios are below 1 presenting a poor return on investment for Zanaco.
| Return on Capital Employed | ||||
| Year | Net Profit | Invested Capital | ROCE | Acceptable Rate |
| 2016 | 30106 | 1081063 | 0.027849 | 0.10 |
| 2017 | 114119 | 1024052 | 0.111439 | 0.10 |
| 2018 | 183733 | 10614067 | 0.01731 | 0.10 |
| 2019 | 214654 | 940879 | 0.228142 | 0.10 |
| 2020 | 234508 | 1214247 | 0.19313 | 0.10 |
| 2021 | 1039820 | 2145638 | 0.48462 | |
Table 5
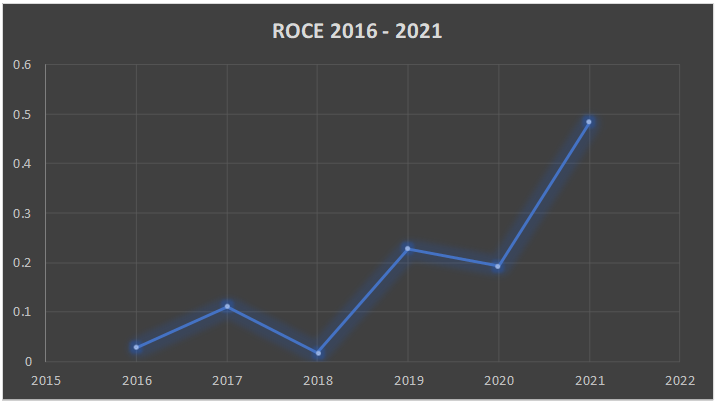
Figure 4
Table 6 shows the EPS trend of Zanaco, 2016-0.021, 2017-0.097, 2018-0.127, 2019-0.139, 2020-0.143, and 2021-0.68. It can be seen the EPS was low from 2016-2017 but improved in 2018 with 2021 having the highest regardless of the improvement Zanaco has a very low EPS, the trend is shown in figure 4
| EPS (2016-2021) | |
| Year | EPS |
| 2016 | 0.021 |
| 2017 | 0.097 |
| 2018 | 0.127 |
| 2019 | 0.139 |
| 2020 | 0.143 |
| 2021 | 0.686 |
| Mean | 0.016 |
Table 6
Figure 5 shows the Enaring per Share (EPS) uisng a graph from period 2016-2021, it can clearly be seen from the graph that Zanaco’s EPS was slow in growth from 2016-2020 but drastically improved in 2021.
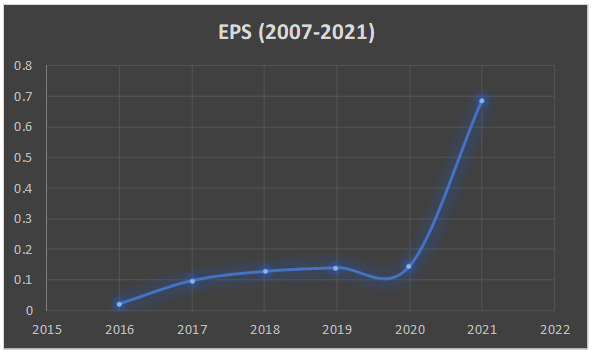
Figure 5
Debt –Asset and Capital –Asset Ratio
Debt to Asset Ratio is a form of solvency or leverage ratio that measures the cumulative of assets funded by creditors rather than investors. All in all, it highlights the level of assets that are supported by borrowing compared to the level of assets that are supported by the investors. All the debt asset ratio for Zanaco are above 1 this shows that Zanaco’s assets are supported more by debt.
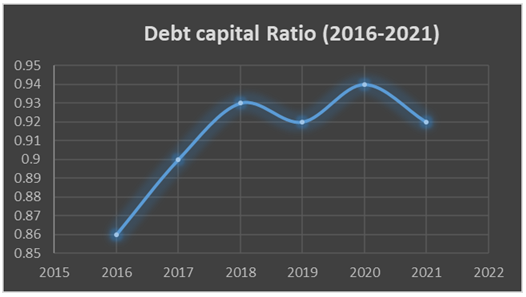
Capital to debt ratio is a ratio that shows the financing structure of the company it is normally an indication or a snapshot of the capital composition of the firm it shows how much capital constitutes of equity and how much constitutes of debt (Schmidlin, 2012), All the debt to assets ratio is below 1 showing that Zanaco’s capital structure is composed more from debt.
| Debt to asset (2007-2021) and Debt to Capital Ratio | |||||||||
| Year | Debt | Equity | Debt equity Ratio | Debt + Equity | Debt Capital Ratio | Accepted Ratio | |||
| 2016 | 7094422 | 1081063 | 6.56245 | 8175485 | 0.867768 | 1 | |||
| 2017 | 9543088 | 1024052 | 9.318949 | 10567140 | 0.903091 | 1 | |||
| 2018 | 10614067 | 820908 | 12.92967 | 11434975 | 0.928211 | 1 | |||
| 2019 | 10959009 | 940879 | 11.64763 | 11899888 | 0.920934 | 1 | |||
| 2020 | 18168494 | 1171798 | 15.5048 | 19340292 | 0.939412 | 1 | |||
| 2021 | 24050453 | 2053652 | 11.71107 | 26104105 | 0.921328 | 1 | |||
| Mean | 3.559009 | 0.780654 | 1 | ||||||
Figure 11 shows the trend of the Debt to equity Ratio through a graph from period 2007-2021, it can clearly be seen that Zanaco’s DTE has flaucated over the period under review, with 2015 recording the lowest.
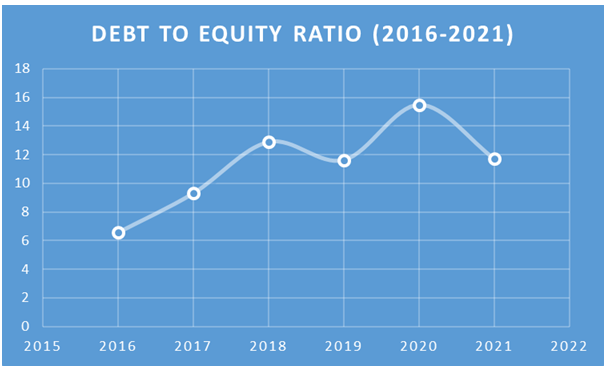
Figure 11 shows the trend of the Debt to Capital Ratio through a graph from period 2007-2021, it can clearly be seen that Zanaco’s DTC has flaucated over the period under review, with 2015 recording the lowest
Current Ratio
The table below shows the current ratio of Zanaco from 2016-2021, as seen all ratios are above 1 implying that Zanaco is able to meet its current liabilities with its current ratios.
| Current Ratio= Current assets/Current Liabilities | Accepted Ratio | |||
| Year | Current Assets | Current Liabilities | Quick Ratio | |
| 2016 | 8175485 | 7094422 | 1.152382111 | 1 |
| 2017 | 9543088 | 8519036 | 1.120207498 | 1 |
| 2018 | 9793159 | 8519036 | 1.149561875 | 1 |
| 2019 | 11885289 | 10959009 | 1.084522241 | 1 |
| 2020 | 19340292 | 18168494 | 1.064496155 | 1 |
| 2021 | 26104104 | 24050433 | 1.085390188 | 1 |
| Mean | 1.01 | |||
The figure below shows the trend of the current ratio of Zanaco as seen the ratio has been consistent for the period under review.
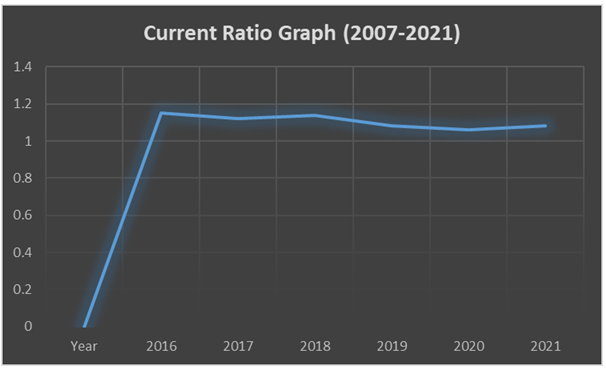
Figure 4 shows the trend of the quick ratio through a graph from period 2007-2021, it can clearly be seen that Zanaco’s Queick Ratio has been consistent despite in the year 2008 and 2019 where the ratio was low.
Zambia National Commercial Bank’s ability to convert sales into profit during the period 2016-2021.
Table 7 shows that Zanaco was less profitable in 2016, but improved in 2017-2019, however declined in 2020 and improved in 2021, as shown in the table, the ratios are below 50%. Therefore, Zanaco has not been maximizing profits in the period under review
| Net Profit Margin Ratio | |||||
| Year | Net Profit | Net Sales | NPM | % | Accepted Rate |
| 2016 | 30106 | 1024236 | 0.029394 | 2.93% | 10% |
| 2017 | 290329 | 1225995 | 0.236811 | 23.6% | 10% |
| 2018 | 183733 | 1225995 | 0.149864 | 14.9% | 10% |
| 2019 | 325809 | 1351018 | 0.241158 | 24.1% | 10% |
| 2020 | 206658 | 2144984 | 0.096345 | 9.6% | 10% |
| 2021 | 990283 | 3537273 | 0.279957 | 27% | 10% |
| Mean | 0.029394 | 2.9% | |||
Table 7
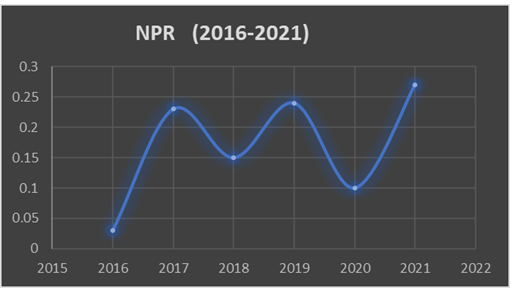
Figure 6
Table 11 shows the cash ratio for the years 2016- 0.60, 2017- 0.67, 2018 0.58, 2019- 0.52, 2020- 0.58, and 2021. It can be seen in figure 7 that Zanaco cash ratio started reducing from 2018-2021, all the cash ratios are below 1 therefore implying that Zanaco does not have enough cash to sort out its short-term liabilities.
| Cash Ratio= Cash+ Equivalents/Short term liabilities | ||||
| Year | Cash equivalents | Short term Liabilities | Cash Ratio | Accepted Rate |
| 2016 | 4149884 | 6819871 | 0.6084989 | 1 |
| 2017 | 5502889 | 8139617 | 0.6760624 | 1 |
| 2018 | 5537276 | 9441647 | 0.5864735 | 1 |
| 2019 | 5477181 | 10351305 | 0.5291295 | 1 |
| 2020 | 10193216 | 17546776 | 0.5809167 | 1 |
| 2021 | 12201840 | 22784764 | 0.5355263 | |
Table 8
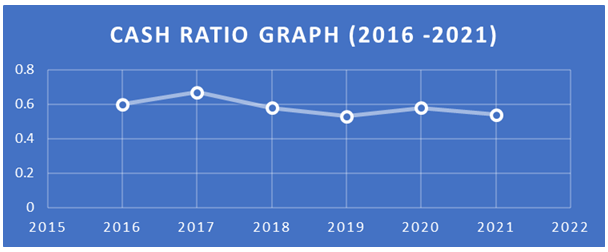
Figure 7
Table 9 shows the Pre-tax margin for Zanaco between 2016-2021 which reveal that 2016-0.89, 2017-0.69, 2018- 0.92 2019-1.07 2020 0.60 and 2021- 0.75 as shown in figure 8 it can be noted that Zanaco’s pre-tax ratio has been low despite an improvement in 2019.
| Pre-tax Margin | ||||||
| Year | Gross Profit | Interest Expense | Pretax Earnings | Sales | Pretax Ratio | Accepted Rate |
| 2016 | 1143535 | 227527 | 916008 | 1024236 | 0.89433295 | 0.10 |
| 2017 | 1189330 | 346405 | 842925 | 1225995 | 0.68754359 | 0.10 |
| 2018 | 1453303 | 313526 | 1139777 | 1231551 | 0.92548096 | 0.10 |
| 2019 | 1864697 | 446380 | 1418317 | 1321250 | 1.07346604 | 0.10 |
| 2020 | 2000421 | 696508 | 1303913 | 2149207 | 0.60669493 | 0.10 |
| 2021 | 3570491 | 998586 | 2571905 | 3542594 | 0.72599485 | 0.10 |
Table 9
Figure 8 shows the trend of the pre-tax ratio through a graph from period 2016-2021, it can clearly be seen that the current ratio for Zanaco has been consistent for the period under review.
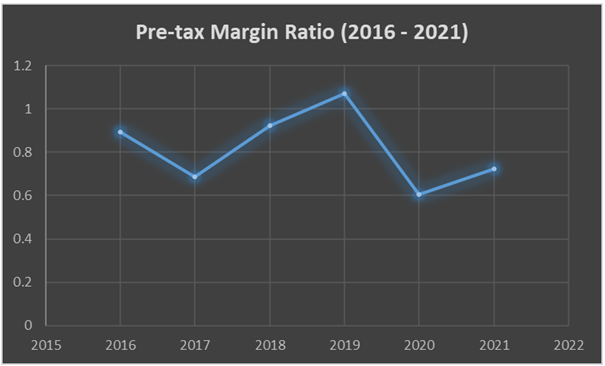
Figure 8
Table 10 shows the trend of the operating Cash flow margin from the period 2016-2021 the results reveal that 2016-0.15, 2017, 0.239, 2018-0.40, 2019-0.38, 2020- 0.203 and 2021 was 0.608. It can be said that Zanaco has poor cash flow margin in the period under review.
| Year | Net Revenue | Cash from Operations | Cash flow Margin | Accepted rate |
| 2016 | 30100 | 197623 | 0.152310207 | 0.60 |
| 2017 | 114119 | 476015 | 0.239738244 | 0.60 |
| 2018 | 183733 | 450404 | 0.407929326 | 0.60 |
| 2019 | 214654 | 551216 | 0.38941903 | 0.60 |
| 2020 | 234508 | 1150652 | 0.203804452 | 0.60 |
| 2021 | 1039820 | 1707864 | 0.60884239 | 0.60 |
Table 10
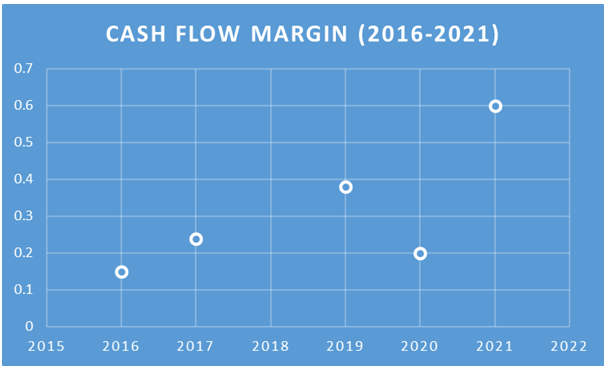
Figure 9
Table 11 consequently shows the trend in operational expenses, 2016-1.32, 2017-1.07, 2018-1.23, 2019-1.27, 2020-1.26, and 2021-1.01. It can be seen that Zanaco in figure 10 that Zanaco has high consistent OER in the period under review.
| Operating expenses Ratio | ||||
| Year | Expenses | Sales | OER | Accepted Rate |
| 2016 | 1353666 | 1024236 | 1.321635 | 1 |
| 2017 | 1323271 | 1231559 | 1.074468 | 1 |
| 2018 | 1509379 | 1225995 | 1.231146 | 1 |
| 2019 | 1718372 | 1351018 | 1.271909 | 1 |
| 2020 | 2709744 | 2144984 | 1.263293 | 1 |
| 2021 | 3582113 | 3537273 | 1.012676 | 1 |
| Mean | 1.012676 | |||
Table 11
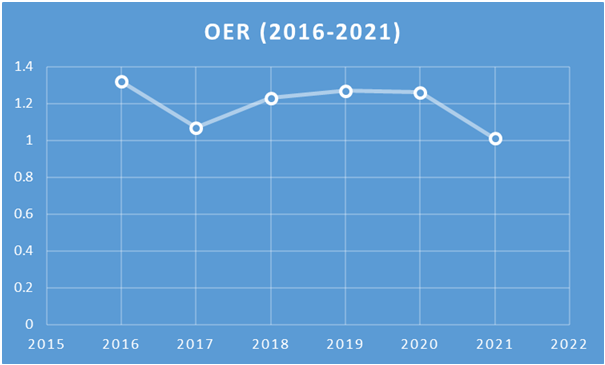
Figure 10
Table 12 consequently shows that the OIR for Zanaco was 2016-1.4, 2017-1.2, 2018-1.6, 2019-1.7 2020, 1.37 and 2021-1.4, as shown in figure 11 Zanaco’s OIR has been increasing in the years under review.
| Year | Operating Income | Net sales | OIR | Accepted Rate |
| 2016 | 1143535 | 796709 | 1.435323 | 1 |
| 2017 | 1143535 | 918025 | 1.245647 | 1 |
| 2018 | 1453303 | 879590 | 1.65225 | 1 |
| 2019 | 1564697 | 904638 | 1.729639 | 1 |
| 2020 | 2000421 | 1453639 | 1.376147 | 1 |
| 2021 | 3570441 | 2544008 | 1.403471 | 1 |
Table 12
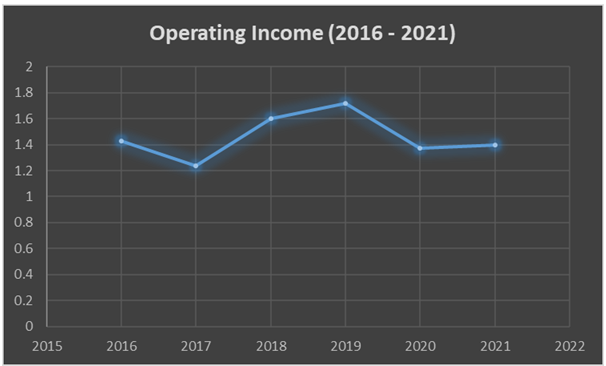
Figure 11
DISCUSSION
Zambia National Commercial Bank’s ability to generate return to its shareholders during the period 2016-2021
The results have revealed a high ROA in the first two years of the period under review however there was a decline from 2018-2020, this implies that the company was not utilising its assets to efficiently to generate returns these findings are in line with the findings of (Chishiba, 2019 ). The reduction of the ROA from 2018 can be contributed to adverse economic impact and the emergence of COVID-19 which hampered the bank from effectively utilizing its assets. On the other hand all calculated ROA for the years under review are above 5% consistent with the (Chishiba, 2019 ). A ROA ratio of greater than 5% is considered good, implying that at some extent the bank is attractive to investors, implying that Zanaco has good management of its fixed assets consistent with the managerial efficiency theory of profits which recognizes that some firms are more efficient than others in terms of management of productive operations and successfully meeting the needs of consumers (Makadok, 2011),
The findings have revealed that Zanaco has a stable ROE in the years under review as its grantees a return on shareholder’s investment, these results are consistent with the uncertainty bearing theory of profit which states that profit is a reward of risk that an entrepreneur receives after taking a risk, applicable in the banking sector financial risks are the major factors influencing profit generating potential of commercial banks. (Gwahula, 2013). The stable ROE ratio that Zanaco has also means that the bank has been upholding incomes and ROE consistently, showing that the company is generating revenues from the retained earnings, showing that Zanaco does not keep its retained earnings in the reserves but instead invests the retained earning heavily (Buffett, 2015).
Additionally, the high mean ROE calculated also talks that Zanaco has a huge economic moat. Meaning that Zanaco has the ability to retain competitive advantages over its competitors through protecting their long-term profits and market share in the market.
The findings reveal that Zanaco has a low EPS, in the period under review, showing the EPS is a true depiction of what the company really earned. The EPS is mostly tied to dividend payout it is therefore plausible that Zanaco has not been paying consistent dividend to its shareholders owing because of its low EPS, this is in conflict with the fractional theory of profitability which holds that there exists a normal rate of profit which is a return on capital that must be paid to the owners of capital as a reward for saving and investment of their funds rather than to consume all their income or hoard them (Makadok, 2011). The low EPS of Zanaco may have been influenced by Zanaco’s net income, this is so because EPS is normally tied to a company’s net income (Fridson & Alvaraz, 2013). EPS can decrease when earnings are spread over a larger number of shares, (Mirzaei, et al., 2013) which should be the case with Zanaco. One possible solution to increase EPS in this case is for Zanaco to increase its income while reducing its operational expenses, the bank can also repurchase its own shares, which has the ability to increase EPS by concentrating earnings among fewer shares.
The results have shown that over the years under review Zanaco has low return on investments ratios basically a higher ROCE implies that the returns are higher than the cost of the investment on the other hand Zanaco has a low ROCE the results are similar to the findings of (Mushota, 2002) who confirm a low ROCE was a reason why many Zambian banks collapsed. One of the plausible explanation to Zanaco’ has low ROCE is economic factors manly economic prosperity of banks is knotted to equities and debt instruments, and other forms of investments, as such if the economy changes, the investments are too affected over the past yeas Zambia has experienced a deteriorating economic situation coupled with COVID-19 (Zulu & Kabwe, 2023), Zanaco’s ROCE can also be affected because of regulatory and political factors such as government budget cuts which can cause higher borrowing costs for businesses, therefore impacting interest rates. The ROE may have also been affected by Investment costs such as fees and taxes, which are the major cost of decreased ROCE due to its consistency and its ability to compound over portfolio growth. Tax may have also affected the ROCE of Zanaco.
Debt to asset Ratio
The debt to asset ratio show that Zanaco has a debt asset ratio that is above 1, These findings are consistent with the findings (Chishiba, 2019 ). The findings show that the assets of Zanaco is more that the debt, it therefore shows that most of the company ‘s cumulative of assets funded by investors and creditors other than returned earning. The findings also show that the bank has more assets than liabilities meaning that it has the capacity to meets its obligations of buying and selling off assets (Gwahula, 2013).
Debt to capital Ratio
The findings of the study find that Zanaco has the debt to equity ratio which is below 1 this signifies that the bank has more capital than debt, therefore Zanaco bank is more manageable and more attractive to investors to invest in and for creditors to loan the bank (Fridson & Alvaraz, 2013). This is so because a lower percentage means that a company is using less leverage and has Current assets
The findings of the study, revealed Zanaco has a current ratio of above consistent with the findings of (Momba, 2019), (Zawadi, 2014) and (Chishiba, 2019 ). These results imply that Zanaco has more assets than liabilities reflecting that that Zanaco has a strong ability to service short-term obligations. Short term obligations can be defined as those that are due in one year or less. This also shows that Zanaco has favourable borrowing capacity (Albrecht & D, 2010). The mean of 1 current ratio shows that Zanaco has enough cash and using the cash the company is capable of paying off their debt, since as supported by (Fridson & Alvaraz, 2013) who notes that, the higher the ratio is, the more capability the company has in paying off its debts. Additionally, the company is able to effectively convert sales to profit, through an increase of current assets.
In a situation where the current ratio is low it implies that the company would face difficulties in paying off instantaneous debts and liabilities. It is also imperative that the current ratio changes from time as it has been for Zanaco in the period between 2016-2021 because having a consistent high current ratio would mean that the company’s the company’s account receivables AR and may include old open invoices, and Accounts Payable are low, and the company is using their cash to pay off expenses, but they are not good with collections. It can also mean that the company has a high value of old/unsellable inventory in stock, but the bills are paid off. (Gwahula, 2013), a closer look of a high current ratio signals that that a company may have enough cash to pay off all their current obligations; but a closer look will indicate that they may be unable to pay then off with the current cash on hand.
Zambia National Commercial Bank’s ability to convert sales into profit during the period 2016-2021.
The study reveals that Zanaco of the years under review has never had a NPM of over 50%, the findings are consistent with the findings of (Chishiba, 2019 ). The low profitability of Zanaco in the years under review proves that Zanaco is operating in a competitive non monopolistic business environment in line with the monopoly theory of profits which explains that above-normal profits is attributed to monopolise influence power enjoyed by firms (Makadok, 2011). It is inevitable that firms with monopoly power restrict output and charge higher prices than under perfect competition. As such the weakening NPM can be attributed to an increase in competition in the banking industry, together with other non-banking competitors such as mobile money companies, surprising during the COVID-19 pandemic NPM increased, the plausible explanation is that the work from home measures, reduced the operational expenses of Zanaco such as stationary, travel expenses, and other operational costs, the reduction in such expenses increases profitability consequently increasing NPM ratio. On the other hand the low NPM indicates an ineffective cost structure and/or poor pricing strategies, coupled with high expenses/costs and extremely poor pricing strategies of its products or services (Gwahula, 2013). The results also suggest that the bank is not fully in control of its operational and overhead costs. As such controversy now arise on how efficient Zanaco converts its sales into profits, this is so as a lower NPM indicates that Zanaco, revenue through costs and expenses that are associated with the running of the bank (Almaskati, 2022), also implying that at some extent the bank lacks effective innovation to attract more customers which is in conflict with the innovation theory of profit which explains that economic profits arise because of successful innovations introduced by the entrepreneurs, to their business (Makadok, 2011).
Zanaco has a low cash ratio implying that the bank does not have enough cash and cash equivalents to meet its financial obligations these findings are consistent with the findings of (Chishiba, 2019 ) but inconsistent with the findings of (Zawadi, 2014). The implication of the findings is that if the bank’s cash ratio is less than 1, then the bank has more current liabilities than cash and cash equivalents. Detonating that the company has insufficient cash on hand to write off short-term debts (Almaskati, 2022). Initially a low cash ratio of less than 1 signals that Zanaco could be experiencing financial trouble.
The findings have revealed that Zanaco has a low cash ratio meaning that the operating cash ratio for Zanaco for the period 2016-2021 was below 1 consistent with the findings of (Momba, 2019), (Zawadi, 2014) and (Chishiba, 2019 ). These results imply that Zanaco does not have enough operating cash flow to service short-term obligations, as such the cash that Zanaco has is not sufficient to pay off their debts, the plausible explanation to this low ratio is that Zanaco may have old open invoices and high accounts payable, and the company is using their cash to pay off expenses and debt, but they are not good with debt collections.
The findings have revealed that the bank has a low pre-tax margin besides in 2019 where the pre-tax was high, meaning that in 2019 Zanaco was able to generating significant pre-tax profits relative to its revenue. Since during COVID-19, there was reduced operational expenses due to work from home measures (Zulu & Kabwe, 2023), as such the company had proficient cost management, strong revenue generation, and possibly higher profitability after accounting for taxes the opposite with the consequent years which revealed a low pre-tax margin.
Zanaco’s calculated operational expense is slightly higher but a lower expense ratio is desired, these findings are similar to the findings of (Chishiba, 2019 ). One of the reasons for an increased expense ratio are ineffective rental income collection, because failure to collect rental income or poorly managed property is more evidently to have higher vacancy rates, which will be reflected in the OER, other costs which may have increased.
The findings revel that Zanaco’s operating income ratio is above 1 for the years under review. The high operating income of Zanaco signifies that Zanaco is efficient and has good productivity with huge potential of generating income, these findings are consistent with the findings of (Lotto & Papavasillion, 2019) and (Momba, 2019).
CONCLUSION AND RECOMMENDATION
The major aim of the study was to review the financial performance of ZANACO from the period of 2016-2021, using both primary and secondary data. The study incorporated the use of ratio analysis of profitability, liquidity and solvency, therefore from the study the following inferences can be drawn.
The liquid ratios showed that during the period of 2016-2021 Zanaco bank was capable of meetings its short-term obligations, notable through the solvency ratios which were above 1, However despite the bank meeting its short-term liabilities, the bank was unable to meet these short-term liabilities using cash since the cash ratios where below 1. Profitability ratios from the period 2016-2021 have shown that the bank was effectively using its assets to generate wealth, similarly the bank was also able to retain profits from the stockholder’s investments. However, the inconsistency of profits implies that from 2016 to 2021, the bank was adversely affected by macro-economic factors, business interruption such as that of COVID-19 and also an increased factor of competition in the banking sector notably the increase of mobile banking mobile communication companies attributed to the decline in profitability.
It is noted that macro-economic factors had an adverse impact on Zanaco’s profitability, one of the most prominent impact is the impact of the COVID-19 pandemic which truly had an adverse impact on bank profitability, however because of the bank size, liquidity and robustness the bank was able to still remain competitive even in turbulent economic environments, coupled with the effectiveness of the bank in transforming non-performing loans (NPL). This has ensured that the bank survives the macroeconomic factors.
Recommendations
The results have shown a low EPS; therefore, it is recommended that the bank should purchase more of its stock with a view of increasing the bank’s EPS ratio.
The bank should also consider having a business realignment, where the bank should exit business lines that have low margins and move strategically to lines that are more cost-effective.
The bank should have improved goal of channel optimization by coming up with different ways that the customers can interact with the bank so as to create of cost-effective combination that is adapted to each bank’s specific customer base.
The bank should also enhance a reduced process cost, by improving the bank’s efficiency ratio by reducing the unit cost-to-value ratio of each activity or transaction this can compromise the cost of opening an account, creating a loan document package, or handling a specific type of transaction.
For continuity of profit maximization, it is recommended that Zanaco adopts quality staff productivity, which can be enhanced through automation of tools which can enable the bank to handle more transactions and greater volumes of activity with the same number of personnel.
To enhance productivity, the bank should enhance good vendor relationship to enhance profitability, with the emphasis of deriving the greatest possible value from the vendor through choosing vendors that meticulously support to the bank’s business objectives.
REFERENCES
- Almaqtari, F. A., Farhan, N. H. S. & M. I. T., 2018. Bank-specific and macro-economic determinants of profitability of Indian commercial banks: A panel data approach. Cogent Economics & Finance , 6(1).
- Almaskati, N., 2022. The determinants of bank profitability and risk: A random forest approach. Cogent Economics & Finance.
- Bank of Zambia, 2021. Annual Report , Lusaka zambia : Bank of Zambia .
- Chishiba, W. M., 2019 . Financial Ratio Analysis -Reviewing the Financial Performance of ZANACO Bank (2013-2015. Texila International Journal of Management, 1-8.
- Fridson, M. & Alvaraz, F., 2013. Financial Statement Analysis. Britain : Wiley Fianace.
- Gržeta, I., Žiković, S. & Žiković, I. T., 2023. Size matters: analyzing bank profitability and efficiency under the Basel III framework. Financial Innovation , Volume 43.
- Gwahula, R., 2013. Efficiency of commercial banks in East Africa: A non-parametric approach. International Journal of Business and Management;, 8(4), p. 1833–3850..
- Iacobelli, A., 2017. Determinants of Profitability; Empirical Evidence from the Largest Global Banks. Journal of Banking and fianance.
- B, M. & Steven, C., 2021. Finanacial Analysis. Coprate Finance and Accounts , 20 Feburary , pp. 3-10.
- Jigger, S. & Korolova, E., 2023. The Determinants of Profitability in the City Commercial Banks: Case of China. raduate School of Industrial Economics, Peter the Great St. Petersburg Polytechnic University, 195251 St. Petersburg, Russia.
- J, M. E., 2014. Accounting and Finance. Briminham: Pearson Publisers.
- Khizer, A., Muhammad, F. A. & Ahmed, H. Z., 2013. Bank-Specific and Macroeconomic Indicators of Profitability – Empirical Evidence from the Commercial Banks of pakistan. International Journal of Business and Social Science, 2(6).
- Lotto, J. & Papavasillion, V., 2019. Evaluation of factors influencing bank operating efficiency in Tanzanian banking sector. Coject Econonimis and Fianance .
- Meriläinen, J.-M. & Junttila, J., 2020. The relationship between credit ratings and asset liquidity: Evidence from Western European banks. Journal of International Money and Finance.
- Mirzaei, A., Moore, T. & Liu, G., 2013. Does market struchure matter on bank profitability and stability. Emerginng vs Advanced Economics. Journal of Banking and Fianance , 37(8), pp. 2920-2937..
- Mohanty, B. & Sanker, S., 2020. Impact of Bank-Specific and External Factors on Profitability: An Empirical Study of PSU Banks in India. Journal of Asia Pacific Business .
- Momba, N., 2019. THE DETERMINANTS OF BANK PROFITABILITY IN ZAMBIA, Lusaka Zambia: University of Zambia Published disertation .
- Murphy, D. & Walsh, K. J., 2022. Government spending and interest rates. Journal of International Money and Finance, Volume 123.
- Mushota, M., 2002. Cause of Collapse of Banks in Zambia; A Legal Perspective. Lusaka: The university of Zambia.
- Niu, J., 2023. Bank size and liquidity creation. Applied Economics Letters , 30(2).
- Sanchez, M. K. H. J. R. & Barkus, 2013. Efficency determinants and dynamic efficiency changes in latin America banking industries. The Business economic research Journal, 6(1), pp. 27-52..
- Sufian, F. & Chong, R. R., 2013. Determinants of Bank Profitability in a Developing Economy; Empirical Evidence from the Phillipines. Asian Academy of Management. Journal of Accounting and Finance, 4(2).
- whithead, R. Y. J., 2020. Fianacial Analysis. Financial anaysis and Coprate Reporting, 6 March , pp. 4-12.
- Wilber, R. M. J., 2019. Financial ratio Analysis. Finanacial Ratio Analysis, 1-35.
- Zawadi, A., 2014. Determinants of Banks’ Profitability in a Developing Economy: Empirical Evidence from Tanzania. European Journal of Business and Management,, 3(3), pp. 363-375.
- Zawadi, A., 2014. Determinants of Banks’ Profitability in a Developing Economy: mpirical Evidence from Tanzania. European Journal of Business and Management, , 3(3), pp. 363-375.
- Zulu, T. & Kabwe, D. M., 2023. The Impact of Covid-19 on the Accounting Profession: Evidence from Accounting Professionals in A Developing Country. International Journal of Research and Innovation in Social Science (IJRISS), vii(vi), pp. 1704-1727.