
An Investigation into the Impact of Orientation on the Thermal Performance and Occupant’s Productivity in Curtain Wall High-Rise Office Working Spaces During the Dry Season: A Case Study of Abuja, Nigeria.
- Christopher Ileanwa Abdul
- Roshida Binti Abdul Majid
- David B. Dalumo
- Adejoh Andrew Ekule
- Usman Abdulazeez Adeiza
- Isah Obenege Suleiman
- Idachaba Kareen Mamenoma
- 208-224
- Sep 26, 2024
- Engineering
An Investigation into the Impact of Orientation on the Thermal Performance and Occupant’s Productivity in Curtain Wall High-Rise Office Working Spaces During the Dry Season: A Case Study of Abuja, Nigeria.
Christopher Ileanwa Abdul1,2*, Roshida Binti Abdul Majid1, David B. Dalumo1, Adejoh Andrew Ekule2, Usman Abdulazeez Adeiza2, Isah Obenege Suleiman2 & Idachaba Kareen Mamenoma2.
1Faculty of Built Environment and Surveying, Universiti Teknologi Malaysia, Johor, Malaysia.
2Department of Architectural Technology, Kogi State Polytechnic, Lokoja, Kogi State, Nigeria.
*Corresponding Author
DOI: https://dx.doi.org/10.47772/IJRISS.2024.809018
Received: 12 August 2024; Accepted: 31 August 2024; Published: 26 September 2024
ABSTRACT
This study evaluates the thermal performance and its effect on occupant productivity in high-rise curtain wall office spaces in Abuja during summer. The heat gain from the east and west facades causes increased indoor temperatures resulting in discomfort conditions in the offices thereby reducing productivity. Due to the significant heat gains from east and west-facing facades, optimizing building orientation is crucial for reducing cooling loads. The primary sources of data are real time readings obtained from hobo loggers and simulation while the secondary data. The research utilized Design Builder and EnergyPlus simulations to analyze the impact of different orientations on indoor temperatures and daylight levels in a typical Abuja office. Results indicate that all orientations exceeded international standards for thermal comfort, with variations in illumination that could affect occupant comfort. These findings underscore the importance of façade orientation in achieving energy-efficient office designs in tropical climates, aligning with Sustainable Development Goals.
Keywords: Illuminance, Temperature, Indoor environment, Daylighting, Glass facades.
INTRODUCTION
The energy dissipation via the building envelope is intrinsically connected to the interaction between exterior surfaces and the surrounding environment (Aguilar et al., 2019). The thermal performance of a building’s external envelope significantly impacts the internal conditions, particularly in temperature and energy consumption. This is primarily due to the substantial heat losses that occur through the façade, which is the primary contact between the building and its external environment (Tao et al., 2021). Several elements have been identified as influential in determining the performance of ventilation. These factors include topography, the orientation of the building, the direction of the wind, the dimensions of the openings, and the positioning of these openings (Aini & Nadia, 2019). A positive correlation exists between the thermal conductivity of building materials and the amount of heat gained and lost through the wall. Conversely, there is an inverse relationship between the thermal resistance of building materials and the heat gain and loss via the wall (Balaji et al., 2019). In recent years, significant structures intended for non-residential use, especially office high-rise buildings, feature glass curtain walls as their envelopes, and this modern style of architecture has come to symbolize many global cities as a trend (Aguilera-Benito et al., 2021). When designing buildings, designers need to consider a range of construction parameters, such as the glass system, orientation, and other building aspects. This consideration is necessary to effectively optimize day lighting and balance the visual needs of occupants and energy usage (Soudbaksh et al., 2022).
Impact of Building Materials on Thermal Performance
The choice of building materials affects energy use, especially in HVAC systems (Homod et al., 2021). Low-solar-factor building facades are essential in Mediterranean conditions with abundant solar radiation and high temperatures. To successfully regulate air conditioning, this is crucial (Planas et al., 2018). Thermal insulation can reduce building energy losses by improving thermal efficiency (Ustaoglu et al., 2020). Climate change significantly affects building global warming potential and cost estimates during their lives (Tamer et al., 2022). Environmental circumstances, design, material qualities, and usage patterns affect thermal performance (Jha, 2020). Achieving climate targets requires energy-efficient buildings to reduce cooling and heating loads and stop energy demand from rising unsustainably (Renuka et al., 2022). Changing glass type, facade orientation, and opening ratios can optimize building energy consumption (Nabil & Mahri, 2022). The use of curtain walls on the study building envelope affects the indoor thermal performance of the office. This is as a result of direct interface between the envelope material and the weather.
Effects of Orientation on Thermal Performance
Building orientation strategies can reduce urban heat in Ireland and optimize indoor thermal conditions (Farhadi et al., 2019). South-oriented windows gain the most heat, followed by east, west, and north-oriented windows, which affect tropical building energy consumption (Alhuwayil et al., 2019). Room orientation changes and external shade components can reduce heat and visual discomfort (Abdulkareem et al., 2018). Optimizing orientation improves comfort and saves energy (Albatayneh et al., 2018). Thermal inertia, orientation, and insulation reduce energy use and improve thermal comfort (Bekkouche et al., 2013). Changing building features like orientation, form, or shading can improve internal thermal conditions, heat acquisition and loss, and energy efficiency (Gaitov et al., 2021). The positioning of buildings on site in relation to the direction of sun set (west) usually have high impact on the thermal performance of interior spaces in the building as much of the sun radiation on the envelope will cause heat gains resulting in thermal discomfort.
Effects of Glass on Thermal Performance
Using glass facades to separate the interior and exterior of buildings, especially in Europe, is linked to scholarly research into glass’s physical properties and their effects on indoor environments as it protects against temperature, wind, and sound (Gaitov et al., 2021; Mehaoued & Lartigue, 2019; Sayed & Fikry, 2019; Shahin, 2019). Some emerging nations, like Abuja, have installed glass facades without considering local climate or glass disadvantages but focused on joining the glass-building trend. This causes solar radiation to enter interior areas, thereby increasing glare, which can cause occupant discomfort (Alwetaishi, 2019; Hwang & Chen, 2022). Before delivering glass materials to the building sector, consideration must be given to analyzing the material’s performance in the local context and evaluating the area’s architecture (Sayed & Fikry, 2019). Climate, glazing type, and quantity affect building energy consumption and heating and cooling capacity (Al-Masrani et al., 2018). The glass used as envelope on the study building allows for direct sun radiation into the interior spaces and this significantly affects the thermal performance of the office working spaces.
High-rise Buildings
Many efforts have been made to define high-rise buildings using other nations’ construction regulations. High-rise buildings are 23–30 meters tall or have more than seven levels. An average of 30 stories is considered a high-rise in the UAE. High-rise buildings are 7–10-story constructions over 23 meters tall. Office, hotel, residential, and mixed-use high-rise buildings are classed by purpose (Ezeh et al., 2022). Space availability and urbanization stimulate high-rise building construction worldwide. Developers choose vertical development to meet population growth in metropolitan regions with limited land. This decision is influenced by the requirement to maintain a specific physical structure, the ability to concentrate activity in a small space, the closeness to critical services for a large population, and the potential for sustainable development (Huang et al., 2020).
Nigeria Development and Abuja Climatic Conditions
Nigeria boasts the highest population on the African continent, surpassing 186 million individuals, of whom around 47.8% reside in urbanized regions. The nation has been undergoing a notable increase in population growth and urbanization, with estimates of 2.7% and 4.7% respectively (Abdulkareem et al., 2018). The country comprises 36 states and six geopolitical zones, with Abuja as the Federal Capital Territory since 1991. Abuja was constructed during the 1980s before its formal designation as the capital city of Nigeria in 1991. In the 2006 census data, Abuja’s population was 776,298 individuals, positioning it as one of Nigeria’s most highly populated cities (Adeyeri et al., 2017). Abuja is the most affected by population growth and urbanization, which has resulted in limited access to electricity supply. This issue can be attributed to the significant population rise without a proportional increase in electricity generation that can sustain the city’s population surge (Evuti et al., 2020).
Located in the tropics, the Federal Capital Territory, Abuja has a tropical wet and dry climate with three seasons, according to the Koppen climate classification. In the dry season, daytime temperatures range from 28°C to 38°C, while nocturnal temperatures can drop to 22°C (Mashi et al., 2022). The rainy season runs from April through October. The northeast trade wind, which brings dust haze and aridity, caused a brief harmattan phase. This time runs from November to January or February. Topography, elevated heights, and undulating terrain modify local weather conditions in the FCT. Abuja’s positioning on the windward side of the Jos Plateau and classification as an air mass ascender affect its precipitation patterns. Annual precipitation is 1100–1600 mm (Mahmoud, 2016).
Abuja is included in the global trend of glass architecture, which has become the most applied building envelope material in offices in cities around the world (Homod et al., 2021). With its urbanization and the use of glass in office buildings, which require high energy for cooling (Aguilera-Benito et al., 2021). This paper investigates the impact of orientation on the thermal performance and occupant productivity of high-rise curtain wall offices in Abuja, Nigeria through simulation of the various orientations of the study office and found that all the orientations experience temperatures above comfort standard by ASHRAE 55. The paper concludes that designing high-rise curtain wall offices with openable windows and shading devices will optimize the thermal performance of working spaces in the studied office.
MATERIALS AND METHODS
To accomplish the study, a comprehensive literature review on the effects of orientation on the thermal performance of buildings was carried out to ascertain factors that contribute to the thermal performance of buildings and the impact of orientation on thermal performance. The current envelope and office parameters were used for simulations by Design Builder and Energy Plus, starting from 0 representing North and rotating in 90 for subsequent orientations. The weather data of the study area was obtained from DesignBuilder through the Longitude and Latitude of the area sent to DesignBuilder requesting the weather report. Design Builder has the latest ASHRAE (American Society of Heating Refrigerating and Airconditioning Engineer) world meteorological data and observation location data and can use hourly meteorological files of Energy Plus available in the program or retrieved from the website. DesignBuilder uses the easy-to-operate OpenGL solid modeler; the user can also import CAD files to construct the 3D building and use weather files in EPS format (Bayarhand et al., 2013). DesignBuilder and EnergyPlus tools were chosen because time intervals of the running period can be divided from annual/monthly down to daily, hourly, or sub-hourly frames.
Study Area Selection
Abuja was selected for the study because of its strategic location in one of the zones with high temperatures. It becomes necessary to study this location in this research due to continuous human growth and infrastructural development being Nigeria’s capital city. Abuja City is located in the middle of Nigeria at a latitude of 9.07°N and a longitude of 7.48°E. It lies 840 m (2760 ft) above sea level and is north of the meeting point of the Niger and Benue Rivers. The Federal Capital Territory has six (6) area councils: Abaji, Abuja, Bwari, Gwagwalada, Kuje, and Kwali, as shown in Figure 1. The Abuja Municipal Area Council (AMAC) is the most developed of all the Area Councils; it houses most of the government institutions, embassies, multi-nationals, and businesses, including the Presidential Villa, the National Assembly, and the Supreme Court of Nigeria (AGIS, 2022). The Federal Capital of Nigeria, Abuja, experiences a hot, humid, wet, and sweltering dry season (Mashi et al., 2022). As Nigeria’s capital, Abuja is currently witnessing the construction of high-rise buildings, most of which are for office purposes.
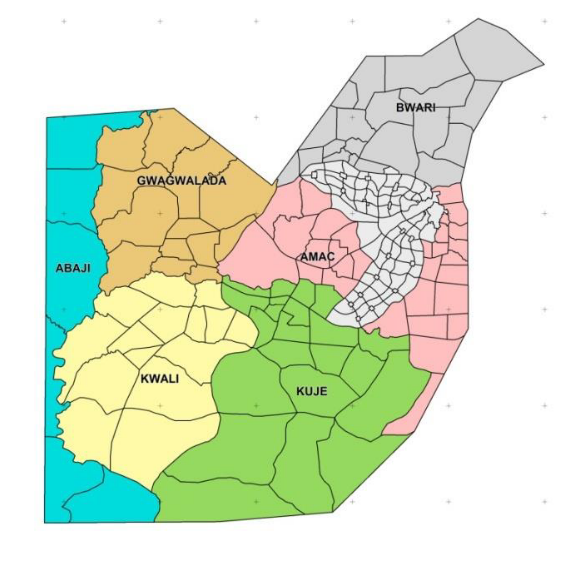
Figure 1. Map of Abuja Municipal Area Councils (Mu’azu, Abbas, 2015).
Study Building Selection
An existing eight-floor high-rise curtain wall office building within the central business district in Abuja was selected for the study. Figure 2 shows the case study building on plot 1387, Cadastral zone A00, Central Business District, Abuja, Nigeria. In selecting the study building, considerations were given to buildings with glass as facades within Abuja, free running mode (no use of air conditioning systems in study rooms) and operating an open-plan office layout. After consideration and comparison, the building used in this study was selected. An open layout design encourages discomfort due to the occupant ratio as a factor (James et al., 2021). Accessibility also significantly contributed to the selection of the building because while other buildings were considered sensitive, government parastatals and entries for research were restricted, the building allowed access to carry out the study (Mehaoued & Lartigue 2019). Any building 23-30m tall or has floors over seven is usually called a high-rise building (Ezeh et al., 2022; Taleb & Antony, 2020). It further stated that high-rise structures are divided into four categories based on their primary use: office, hotel, residential, and mixed-use (Nugroho et al., 2022).
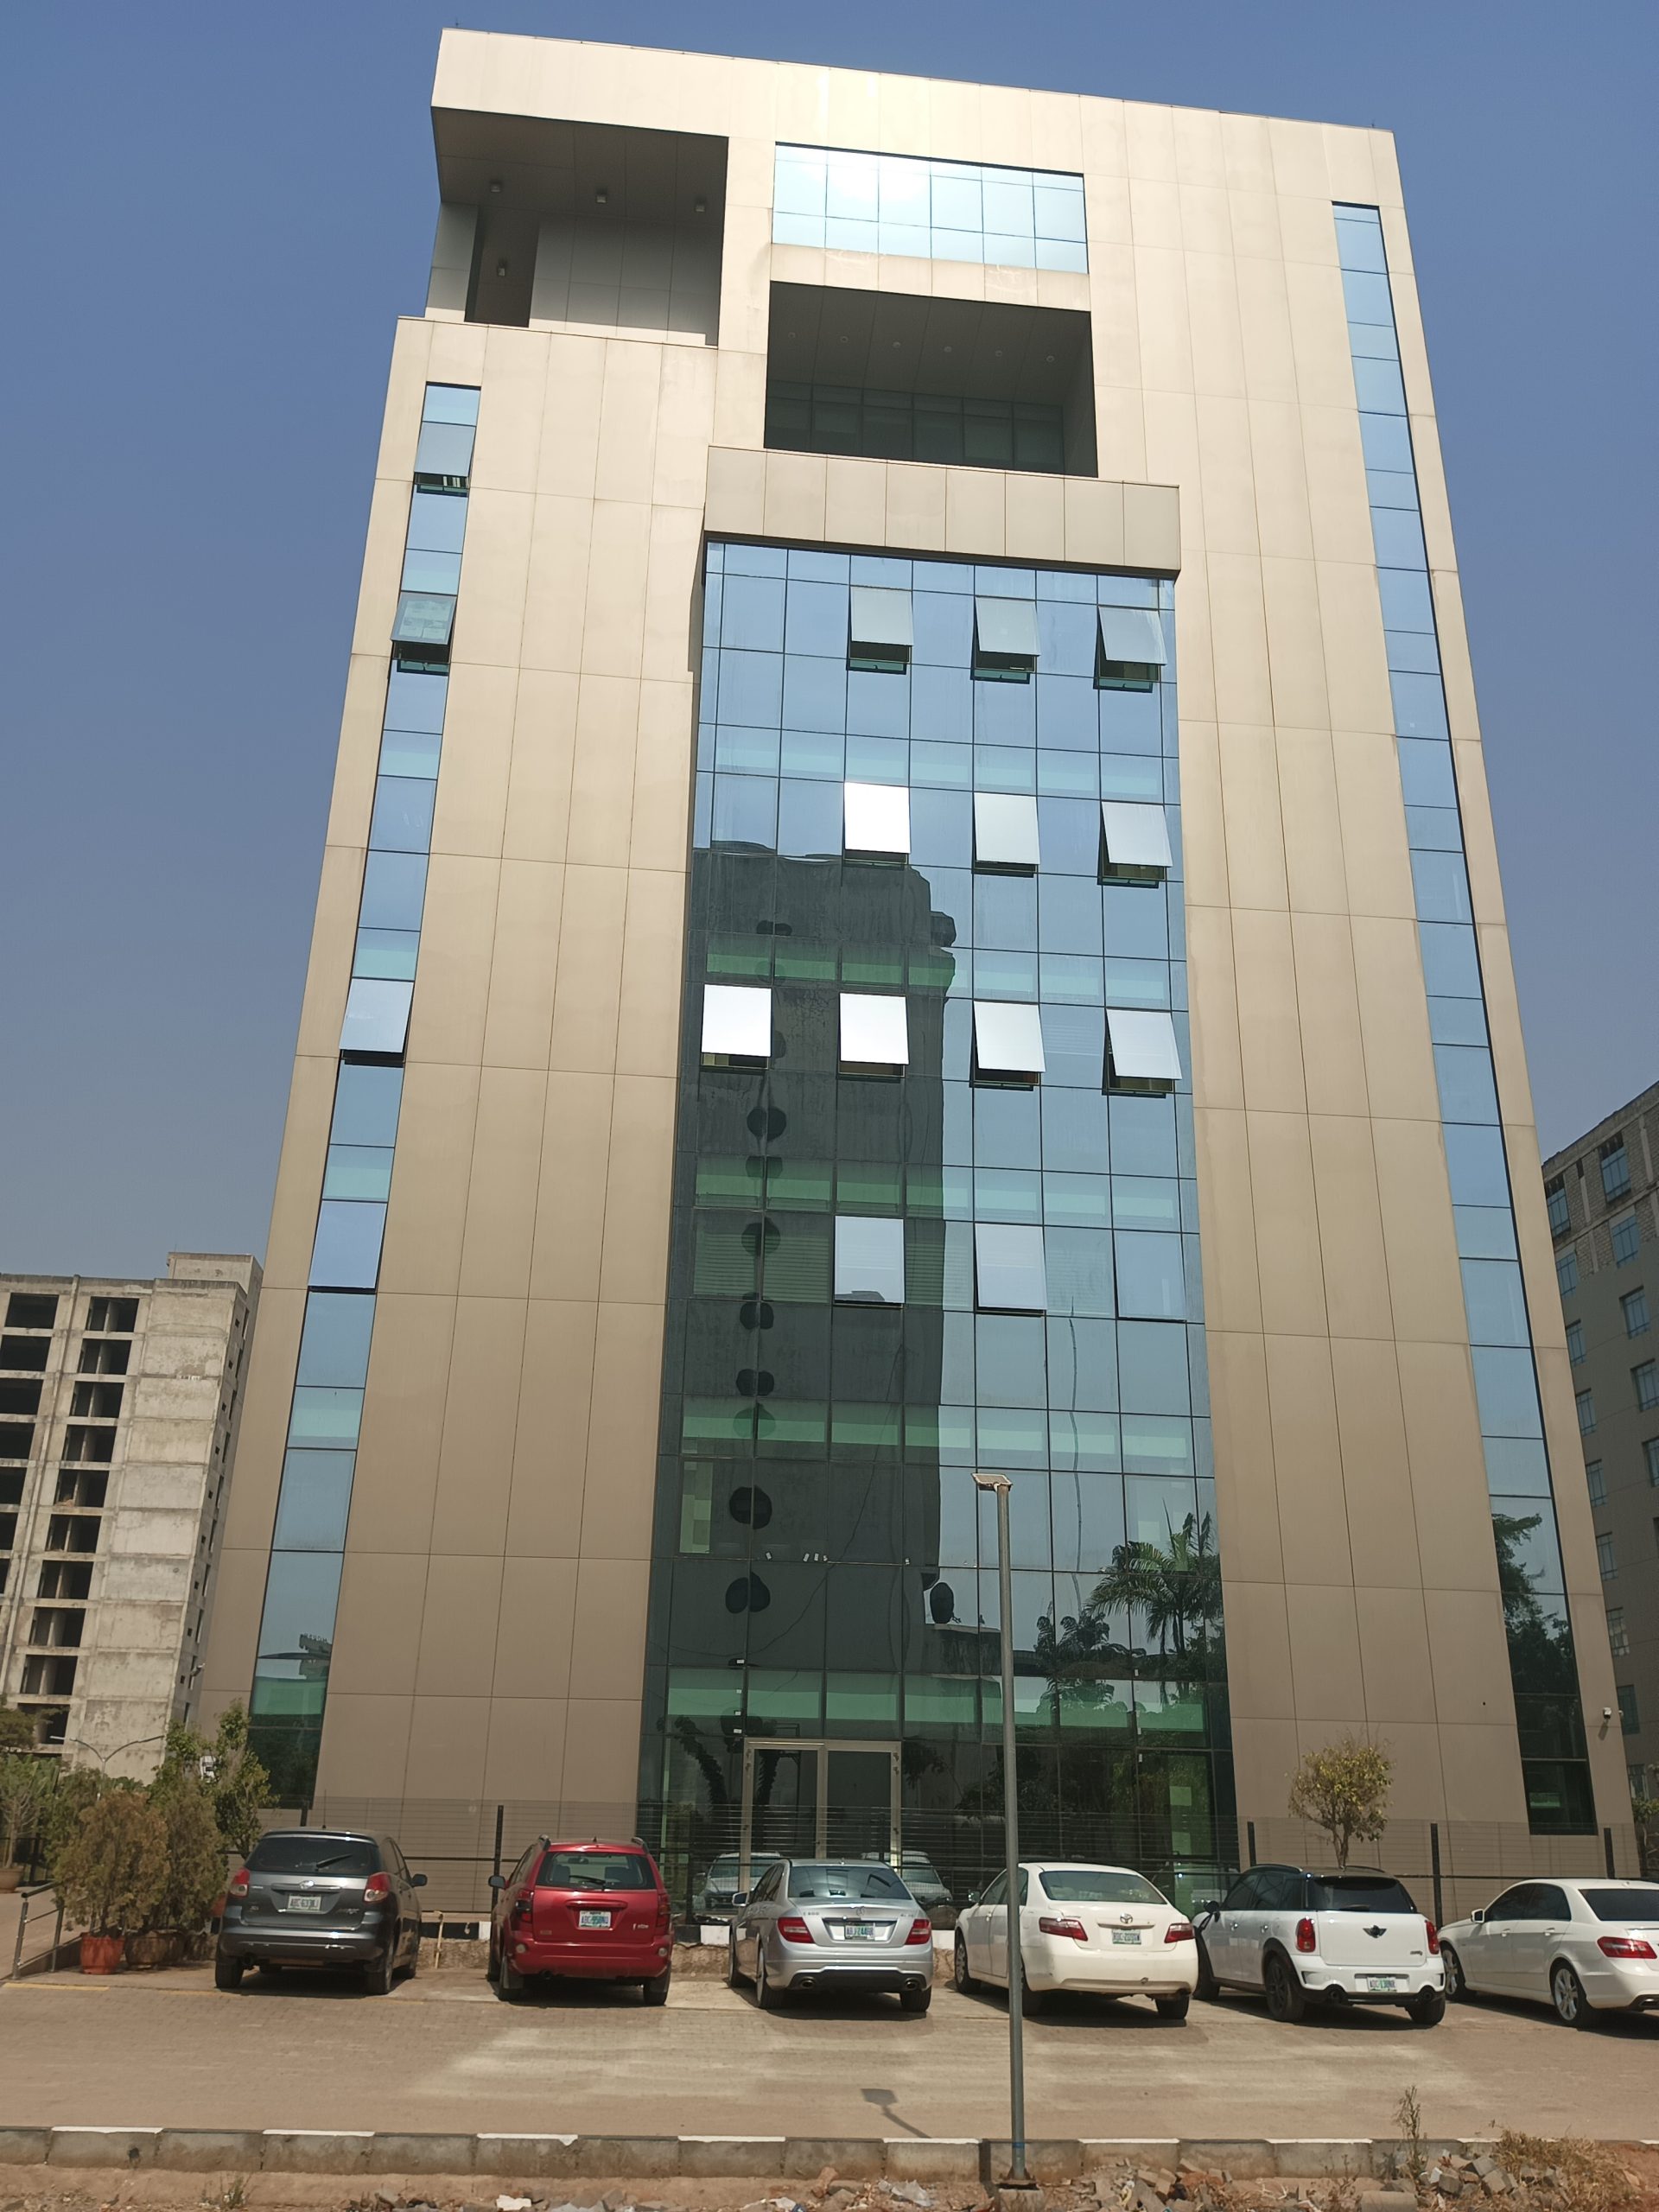
Figure 2. Nigerian Electricity Regulatory Commission. Source: Author’s fieldwork
Instrumentation
BHCnav handheld Global Navigation Satellite System Receiver (GNSS) was used to obtain the Longitude and Latitude of the study area. The instrument helped to obtain the right latitude and longitude of the study area, contributing to the weather report’s accuracy from DesignBuiler. The Longitude and Latitude were sent to the Design-Builder website to obtain the weather report of the building for simulation. The DesignBuilder7.0.2.006 and EnergyPlus interface version 9.4 is a well-known and sophisticated simulation software that executes modelling and simulation processes to estimate performance correctly and offers the quickest accessible workflow (Alkali et al., 2021; Haj Hussein et al., 2022; Zahiri & Altan, 2020). The data obtained were inserted into the software starting from 0o, representing the North and every rotation at 90ogenerated subsequent orientations. The current envelope and the study building characteristics, as shown in Table 1, were used for the simulation to ascertain the office’s thermal performance.
Simulation Process
The reference building model is eight stories with a total height of approximately of 35m above the ground level. CAD drawings were produced from site measuremsents (floor plan sketches) and supplementary layouts provided by the building management. These drawings were subsequently imported into the simulation tool to be reproduced as the study model. The model was created with the same geometrical proportion, length, width, and height as the case study building using envelope properties provided in Table 1. The measurement location in the case study building was also identified on the DesignBuilder model as the simulation zone, and the other sections of the model were aggregated as block groups. The site orientation was the only variable that changed throughout the simulation process. This was done by rotating the site in increments of 45 degrees to depict north, east, south, and west orientations and the corresponding intercardinal directions. The simulation was executed in eight orientations for thermal and daylight performance, totaling 16 runs. Figure 2 shows the model created in DesignBuilder.
This study considered and evaluated two performance variables, thermal and daylight performance, through case study measurements and computer simulation. The effect of curtain wall treatment on the indoor conditions of open-plan office spaces in Abuja relative to occupants’ comfort and work productivity is investigated. Considering Nigeria’s tropical climate, the intermediate sky was selected for the respective simulation runs. The hourly indoor air temperature and workplace illuminance were the adopted performance criteria considered and analysed in the simulation process over 24-hour hours.
The study’s limitations centred around obtaining weather data due to radar’s proximity to the study area. This is the main reason why DesignBuilder was contacted. Secondly, using data from DesignBuilder ensures compatibility with the software in simulations.
Table 1: Performance Simulation Parameters
| Simulation Parameter | Elements | Values |
| Orientation | Office space | NE |
| Location | Longitude | 9.08°N |
| Latitude | 7.40°E | |
| Climate | Sky type | Intermediate sky |
| Office Room Geometry | Perimeter | 3.37m x 5.50m |
| Floor to ceiling | 3.45m | |
| Opening | 1m x 3.45m | |
| Work-plane height | 0.90m above floor | |
| Building Envelope Properties | Reflectance | Floor = 20% |
| Wall = 50% | ||
| Ceiling = 70% | ||
| Roughness | Floor = 0.20 | |
| Wall = 0.03 | ||
| Ceiling = 0.03 | ||
| Specularity | Floor = 0.03 | |
| Ceiling = 0.03 | ||
| Visible light transmittance | 70% reflective glass |
RESULTS AND DISCUSSION
North Orientation
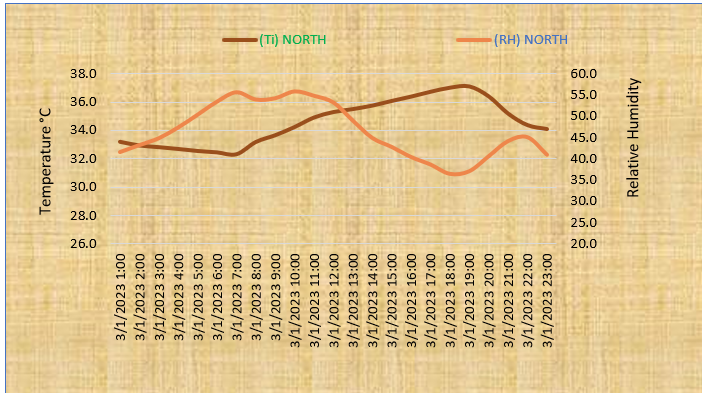
The north orientation is the least affected due to the sun’s position in March. An average of 34oC was recorded, with peaks between 18:00hrs and 19:00hrs, as indicated in Figure 3a. The spaces in this orientation are expected to be relatively more relaxed because the impact of direct solar radiation as the significant contributor to heat gain is through diffuse components. Illumination on this orientation is also less intense than others because the sun’s path is not along the northern direction; thus, the maximum illuminance attained on this orientation is about 682 lux, averaging 155 lux, as depicted in Figure 3b. Available light on the work plane is expected to be limited in the morning and afternoon.
![[b] Simulation illuminance graph for northeast orientation.](https://rsisinternational.org/journals/ijriss/wp-content/uploads/2024/09/a-Simulation-temperature-graph-for-northeast-orientation.png)
Figure 3. [a] Simulation temperature graph for northeast orientation and [b] Simulation illuminance graph for northeast orientation.
East Orientation
The east orientation is the most critical of all the considered orientations in this study due to the proximity of the study location to the equator. The building façade on this orientation is constantly exposed to adverse effects of solar radiation almost yearly. In March, as seen from the results, the impact of the exposure caused an increase in indoor air temperature compared to the other orientations, which gradually rose throughout the day till night. An average of 39oC was recorded during the simulation period, with daily maximum values of over 42oC occurring around mid-day to afternoon, as indicated in Figure 4a; the air temperature on this orientation is usually at its lowest at about 07:00hrs – 08:00hrs daily. Regarding workplace illuminance, the orientation presented the highest amount of daylight availability in the office space, attaining peaks over 2700 lux daily at 09:00hrs, after which a steady decline in lighting conditions is observed for the rest of the time, as shown in Figure 4b.
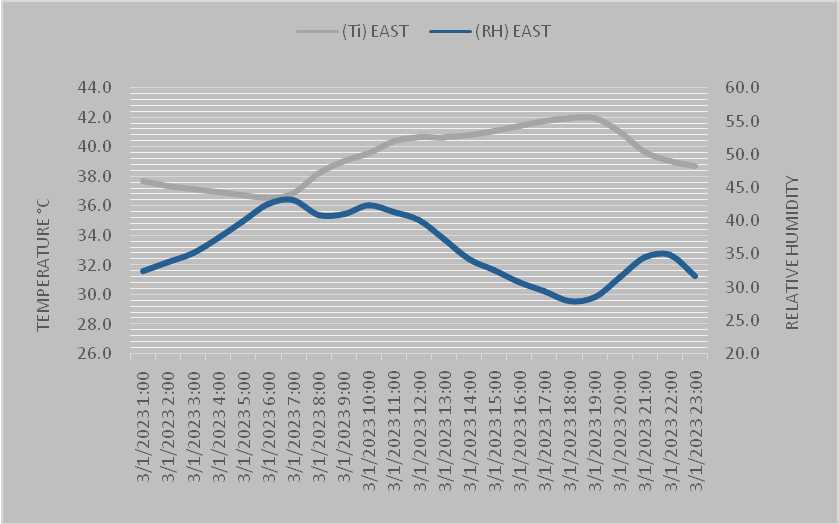
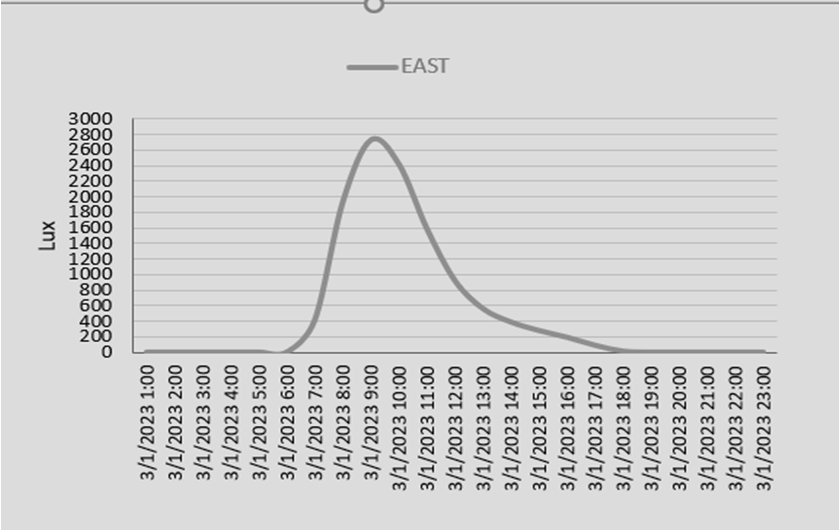
Figure 4. [a] Simulation temperature graph for east orientation and [b] Simulation illuminance graph for east orientation.
South-East Orientation
On the southeast orientation, the solar altitude Is lower than the east in March. Thus, there is a similar trend in the air temperature profile with only minimal reductions. In this case, the test office generated an average and maximum of 38oC and 41oC, respectively, as reflected in Figure 5a. Like the east, the lowest temperature was between 06:00hrs – 08:00hrs and the peaks at 18:00hrs. The sun’s movement through this orientation ensured increased solar radiation, causing high air temperatures and daylight quantity in the indoor environment. Figure 5b shows that the maximum daylight on the work plane was reduced by half relative to the east, with a value of 1500 lux while averaging 334 lux.
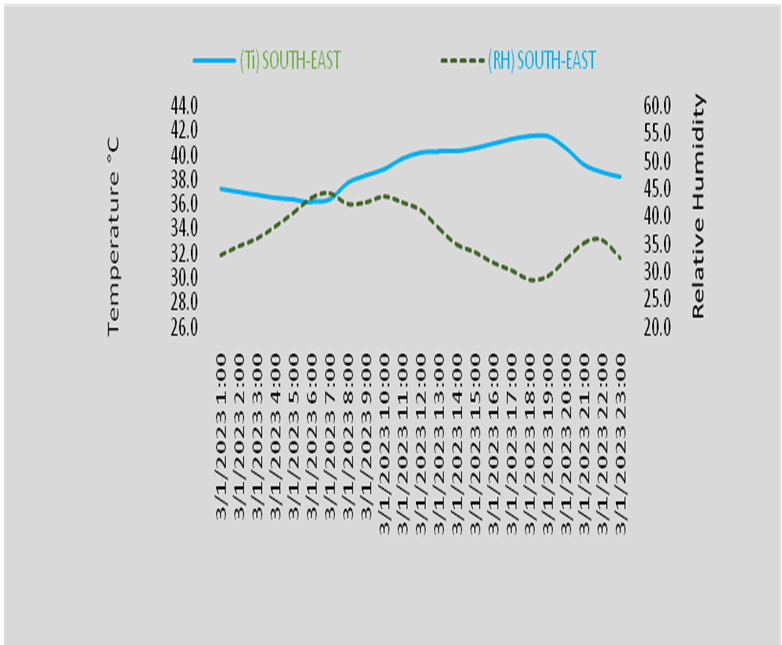
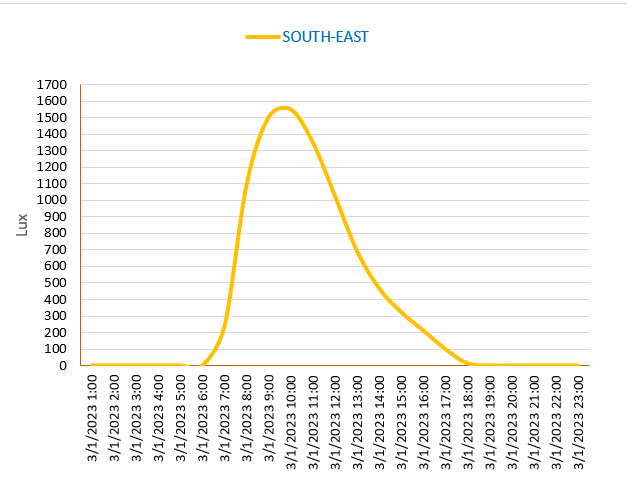
Figure 5. [a] Simulation temperature graph for southeast orientation and [b] Simulation illuminance graph for southeast orientation.
South Orientation
The sun’s position in the south of the study location is directly overhead during the period under study in March. As a result, solar radiation’s intensity is reduced compared to the east and southeast orientations. Lower temperatures were observed in the morning but gradually increased from 11:00hrs until sunset. The maximum indoor temperature derived is 38.7oC with a daily average of 35oC, as depicted in Figure 6a. An average of 210 lux was measured at the workplace, reaching a maximum of 775 lux at 13:00hrs, as shown in Figure 6b.
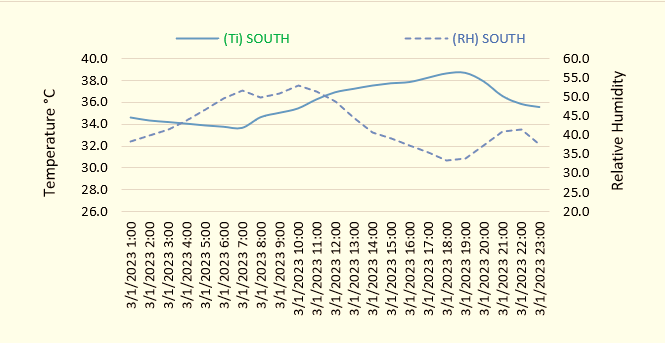
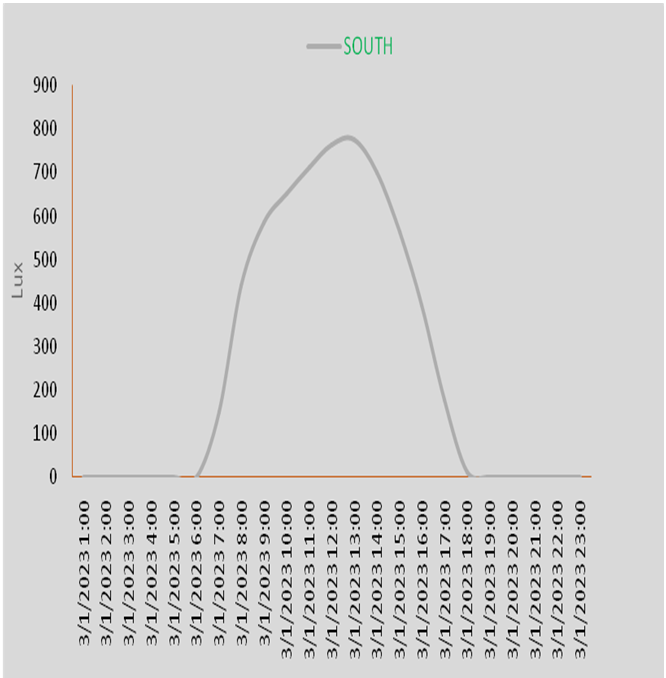
Figure 7. [a] Simulation temperature graph for south orientation and [b] Simulation illuminance graph for south orientation.
South-West Orientation
There is also reduced solar radiation through the envelope on this orientation due to the sun’s position during the study period, translating to lower indoor air temperatures and daylight penetration. This brought about a daily average of 35oC, with a maximum temperature of 38oC at 19:00hrs and a minimum temperature of 33.5oC at 07:00hrs, as indicated in Figure 7a. Work plane illuminance peaked at 1105 lux at 16:00hrs with an average of 248lux during the simulation, as shown in Figure 7b. A remarkable increase in temperature and illuminance occurred on this orientation due to the lower sun altitude being directly given the considered façade.
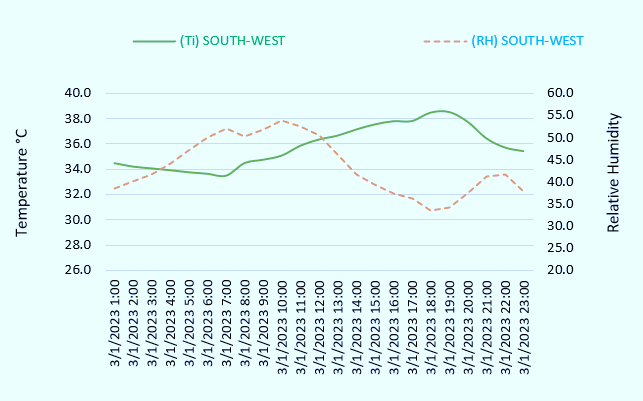
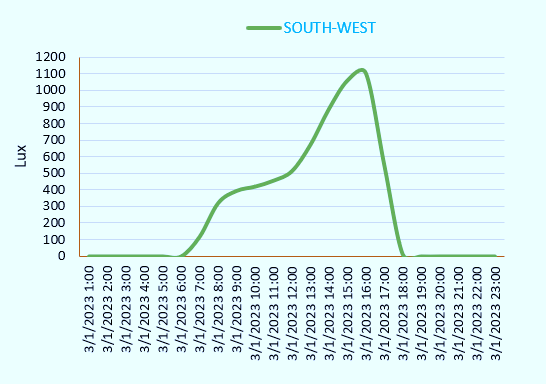
Figure 8. [a] Simulation temperature graph for southwest orientation and [b] Simulation illuminance graph for southwest orientation.
West Orientation
The west orientation has considerably less effect on indoor thermal conditions because the sun is only given the façade direction for a short period of active building use. Direct solar radiation exposure only occurs in the west around 15:00hrs. Thus, the maximum temperature of 38oC, as shown in Figure 8a, is recorded at 18:00hrs with a daily average of about 36oC. Illumination is also relatively low in the morning but peaks at 945lux in the morning, presenting an average of 229lux daily, as depicted in Figure 8b.
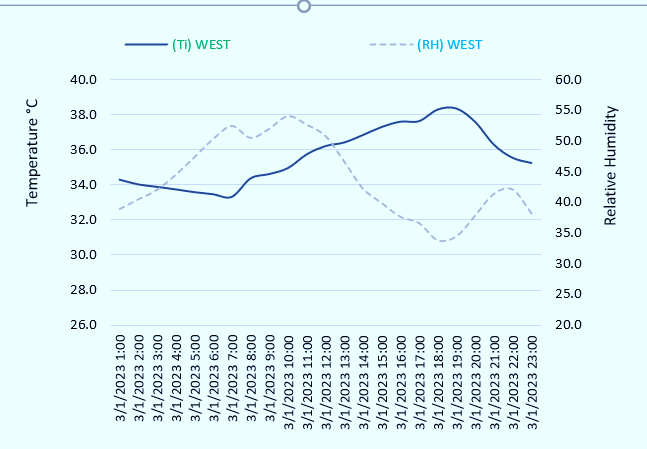
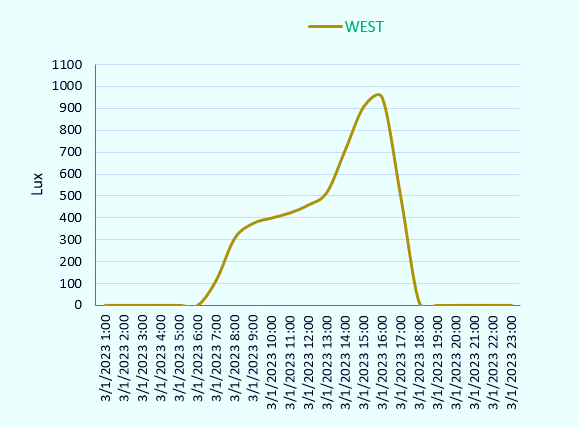
Figure 9. [a] Simulation temperature graph for west orientation and [b] Simulation illuminance graph for west orientation.
North-West orientation
The northwest orientation is shielded from direct solar radiation in March; hence, orientation does not affect indoor thermal conditions. A large percentage of the heat gain through the building envelope is from other heat transfer forms. An average of 34oC is measured in the test space with maximum and minimum air temperatures of 37.4oC and 32.5oC, respectively, as indicated in Figure 9a. Like the north orientation, daylight illumination is lesser than the other six orientations throughout the simulation hours, peaking at 470 lux and an average of approximately 168 lux daily, as shown in Figure 9b.

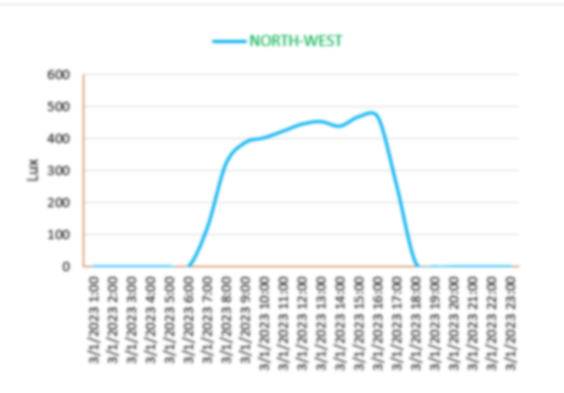
Figure 10. [a] Simulation temperature graph for northwest orientation and [b] Simulation illuminance graph for northwest orientation.
CONCLUSION
The study revealed that each simulated orientation of the studied building suffered excessive temperatures and, in some cases, high illumination. These results in discomfort for the office occupants, directly affecting productivity in curtain wall high-rise offices in Abuja. The research findings align with the objective of analysing the impact of different orientations on temperatures and daylight entering the office. From the findings, building stakeholders and designers in Abuja can design and construct high-rise curtain wall office buildings by introducing shading devices and effects. The local authority can incorporate the recommendations of this research as guidelines for building approval processes in Abuja.
Several factors can affect a building’s performance, including site factors like building orientation and climatic characteristics, material attributes like thermal mass, insulation, and air tightness, and façade design factors like glazing materials, window-to-wall ratio, and shading devices. This article studies the impact of building orientation on the thermal performance of a selected typical curtain wall high-rise office within the central business district (CBD), Abuja, Nigeria. The study helps ascertain the thermal performance of working spaces in the curtain wall office compared with the international standard comfort level for office and indoor occupation. From the results of the simulation analysis, the authors concluded that:
- The North orientation of the studied curtain wall office is the least affected, with average temperature and illuminance at 34o C and 155 lux, respectively. Therefore, subsequent designs can adopt the principle of aligning the open-plan offices towards the North orientation in tropical climates such as Abuja for the reduced effect of outdoor temperatures.
- The east orientation is mainly affected with an average temperature of 42oC and illuminance of 270 lux. Designing open-plan office on the East orientation in tropical climates as Abuja should be avoided
- The south orientation of the office recorded 35oC with the highest sun radiation at an illuminance level of 775 lux. Sun radiation is one of the major causes of discomfort during summer in curtain wall offices in tropical climates, especially in Abuja.
- Average temperature and illuminance of 36oC and 229 lux, respectively, were obtained on the west orientation of the curtain wall office. Most of the recorded illuminance levels can strain the eyes during paper tasks and computer screens.
- All the temperature levels on the various orientations are above internationally accepted levels in line with ISO 7730, ASHRAE Standard 55, or EN 16798-1:2019. The internationally accepted indoor temperature for comfort is 24oC, while the least of the recorded simulated results is 34o
The authors believed that curtain wall offices in the study area should have openable windows and shading devices because of Abuja’s prevailing shortfall in electricity generation.
RECOMMENDATION
Further studies are recommended on the introduction of adequate window openings on curtain wall offices and the effect of floor locations on the thermal performance of office working spaces.
The study strictly evaluated different orientations irrespective of other glass parameters that could determine thermal performance. Research on the effect of type of glass, colour of glass, impact of active shading devices, integration of natural ventilation strategies and thickness of glass in the context of office buildings in Abuja is recommended.
ACKNOWLEDGEMENTS
The authors acknowledge the Tertiary Education Trust Fund (TETFUND) and Kogi State Polytechnic, Lokoja, Nigeria, for providing the needed assistance for this study. We would like also to appreciate the staff and management of the Nigeria Electricity Regulatory Commission (NERC), central business district, Abuja, Nigeria.
REFERENCES
- Abdulkareem, M., Al-Maiyah, S., & Cook, M. (2018). Remodelling façade design for improving daylighting and the thermal environment in Abuja’s low-income housing. Renewable and Sustainable Energy Reviews, 82(October 2017), 2820–2833. https://doi.org/10.1016/j.rser.2017.10.010
- Adeyeri, O. E., Akinsanola, A. A., & Ishola, K. A. (2017). Investigating surface urban heat island characteristics over Abuja, Nigeria: Relationship between land surface temperature and multiple vegetation indices. Remote Sensing Applications: Society and Environment, 7(June), 57–68. https://doi.org/10.1016/j.rsase.2017.06.005
- Abuja geographical information system
- Aguilar-Santana, J. L., Jarimi, H., Velasco-Carrasco, M., & Riffat, S. (2019). Review on window-glazing technologies and future prospects. International Journal of Low-Carbon Technologies, 15(1), 112–120. https://doi.org/10.1093/ijlct/ctz032
- Aguilera-Benito, P., Piña-Ramírez, C., & Varela-Lujan, S. (2021). Experimental analysis of passive strategies in houses with glass façades for the use of natural light. Sustainability (Switzerland), 13(15), 1–15. https://doi.org/10.3390/su13158652
- Aini, Q., & Nadia, N. (2019). The performance of ventilation in internal buildings affected by differences of building orientation. IOP Conference Series: Materials Science and Engineering, 674(1), 1–8. https://doi.org/10.1088/1757-899X/674/1/012001
- Al-Masrani, S. M., Al-Obaidi, K. M., Zalin, N. A., & Aida Isma, M. I. (2018). Design optimisation of solar shading systems for tropical office buildings: Challenges and future trends. Solar Energy, 170(June), 849–872. https://doi.org/10.1016/j.solener.2018.04.047
- Albatayneh, A., Alterman, D., Page, A., & Moghtaderi, B. (2018). The significance of the orientation on the overall buildings thermal performance-case study in Australia. Energy Procedia, 152, 372–377. https://doi.org/10.1016/j.egypro.2018.09.159
- Alhuwayil, W. K., Abdul Mujeebu, M., & Algarny, A. M. M. (2019). Impact of external shading strategy on energy performance of multi-story hotel building in hot-humid climate. Energy, 169, 1166–1174. https://doi.org/10.1016/j.energy.2018.12.069
- Alkali, M. A., Jie, L., Dalibi, S. G., Danja, I. I., Nasir, M. H., Inuwa Labaran, U., Umar, A. M., & Adamu, K. (2021). Optimizing Building Orientation for Reduced Cooling Load in Northeast Nigeria’s Residential Architecture. IOP Conference Series: Earth and Environmental Science, 793(1), 1–8. https://doi.org/10.1088/1755-1315/793/1/012028
- Alwetaishi, M. (2019). Impact of glazing to wall ratio in various climatic regions: A case study. Journal of King Saud University – Engineering Sciences, 31(1), 6–18. https://doi.org/10.1016/j.jksues.2017.03.001
- Balaji, N. C., Mani, M., & Venkatarama Reddy, B. V. (2019). Dynamic thermal performance of conventional and alternative building wall envelopes. Journal of Building Engineering, 21(June 2018), 373–395. https://doi.org/10.1016/j.jobe.2018.11.002
- Bekkouche, S. M. E. A., Benouaz, T., Cherier, M. K., Hamdani, M., Yaiche, R. M., & Khanniche, R. (2013). Influence of building orientation on internal temperature in saharian climates, building located in ghardaia region (Algeria). Thermal Science, 17(2), 349–364. https://doi.org/10.2298/TSCI110121112B
- Evuti, A. M., Baba, Y. M., & Adeyemi, K. (2020). A study of energy demand and consumption in University of Abuja, Nigeria. IOP Conference Series: Earth and Environmental Science, 476(1). https://doi.org/10.1088/1755-1315/476/1/012087
- Ezeh, C. I., Hong, Y., Deng, W., & Zhao, H. (2022). High rise office building makeovers—Exploiting architectural and engineering factors in designing sustainable buildings in different climate zones. Energy Reports, 8, 6396–6410. https://doi.org/10.1016/j.egyr.2022.04.075
- Farhadi, H., Faizi, M., & Sanaieian, H. (2019). Mitigating the urban heat island in a residential area in Tehran: Investigating the role of vegetation, materials, and orientation of buildings. Sustainable Cities and Society, 46(January), 101448. https://doi.org/10.1016/j.scs.2019.101448
- Gaitov, R., Tokbolat, S., Zhong, H., & Mustafa, M. (2021). Investigation of the impacts of design parameters on thermal performance of buildings in cold climate. E3S Web of Conferences, 246. https://doi.org/10.1051/e3sconf/202124607002
- Haj Hussein, M., Monna, S., Abdallah, R., Juaidi, A., & Albatayneh, A. (2022). Improving the Thermal Performance of Building Envelopes: An Approach to Enhancing the Building Energy Efficiency Code. Sustainability (Switzerland), 14(23), 1–20. https://doi.org/10.3390/su142316264
- Homod, R. Z., Almusaed, A., Almssad, A., Jaafar, M. K., Goodarzi, M., & Sahari, K. S. M. (2021). Effect of different building envelope materials on thermal comfort and air-conditioning energy savings: A case study in Basra city, Iraq. Journal of Energy Storage, 34(April 2020), 101975. https://doi.org/10.1016/j.est.2020.101975
- Huang, H., Binti Wan Mohd Nazi, W. I., Yu, Y., & Wang, Y. (2020). Energy performance of a high-rise residential building retrofitted to passive building standard – A case study. Applied Thermal Engineering, 181(August), 115902. https://doi.org/10.1016/j.applthermaleng.2020.115902
- Hwang, R. L., & Chen, W. A. (2022a). Creating glazed facades performance map based on energy and thermal comfort perspective for office building design strategies in Asian hot-humid climate zone. Applied Energy, 311(February), 118689. https://doi.org/10.1016/j.apenergy.2022.118689
- Hwang, R. L., & Chen, W. A. (2022b). Identifying relative importance of solar design determinants on office building façade for cooling loads and thermal comfort in hot-humid climates. Building and Environment, 226(July), 109684. https://doi.org/10.1016/j.buildenv.2022.109684
- James, O., Delfabbro, P., & King, D. L. (2021). A Comparison of Psychological and Work Outcomes in Open-Plan and Cellular Office Designs: A Systematic Review. SAGE Open, 11(1), 1–13. https://doi.org/10.1177/2158244020988869
- Jha, B. (2020). Amity School of Architecture & Planning B . Arch , Semester V Intelligent Buildings Thermal Performance of Buildings Dr . Bandana Jha. 2(7), 1–34. https://doi.org/10.13140/RG.2.2.21710.48968
- Mahmoud, M. I. (2016). Integrating Geoinformation and Socioeconomic Data for Assessing Urban Land-use Vulnerability to Potential Climate-change Impacts of Abuja. May, 1–256.
- Mashi, S. A., Inkani, A. I., & Obaro, D. O. (2022). Determinants of awareness levels of climate smart agricultural technologies and practices of urban farmers in Kuje, Abuja, Nigeria. Technology in Society, 70(March), 102030. https://doi.org/10.1016/j.techsoc.2022.102030
- Mehaoued, K., & Lartigue, B. (2019). Influence of a reflective glass façade on surrounding microclimate and building cooling load: Case of an office building in Algiers. Sustainable Cities and Society, 46(May 2018), 101443. https://doi.org/10.1016/j.scs.2019.101443
- Mu’azu, Abbas, I. (2015). Sustainable Design Strategy: Assessment of the Impact of Design Variables on Energy Consumption of Office Buildings in Abuja, Nigeria.
- Nabil, M., & Mahri, Z. labidine. (2022). Assessment of the 2016 Thermal Regulation for an Algerian Building. Case Study: Impact of Window Type, Orientation and Opening Ratio on Energy Load Using Trnsys. Russian Journal of Building Construction and Architecture, 4(4(56)), 7–17. https://doi.org/10.36622/vstu.2022.56.4.001
- Nugroho, N. Y., Triyadi, S., & Wonorahardjo, S. (2022). Effect of high-rise buildings on the surrounding thermal environment. Building and Environment, 207(PA), 108393. https://doi.org/10.1016/j.buildenv.2021.108393
- Planas, C., Cuerva, E., & Alavedra, P. (2018). Effects of the type of facade on the energy performance of office buildings representative of the city of Barcelona. Ain Shams Engineering Journal, 9(4), 3325–3334. https://doi.org/10.1016/j.asej.2017.04.009
- Renuka, S. M., Maharani, C. M., Nagasudha, S., & Raveena Priya, R. (2022). Optimization of energy consumption based on orientation and location of the building. Materials Today: Proceedings, 65, 527–536. https://doi.org/10.1016/j.matpr.2022.03.081
- Sayed, M. A. A. E. D. A., & Fikry, M. A. (2019). Impact of glass facades on internal environment of buildings in hot arid zone. Alexandria Engineering Journal, 58(3), 1063–1075. https://doi.org/10.1016/j.aej.2019.09.009
- Shahin, H. S. M. (2019). Adaptive building envelopes of multistory buildings as an example of high performance building skins. Alexandria Engineering Journal, 58(1), 345–352. https://doi.org/10.1016/j.aej.2018.11.013
- Soudbaksh, K., Etminan, M., Hakimazari, M., & Salavatian, S. (2022). Impacts of Window Factors and Building Orientation on Energy Consumption in Residential Buildings of Humid Temperate Climatic Zone in Iran. Journal of Construction in Developing Countries, 27(2), 235–262. https://doi.org/10.21315/jcdc-04-21-0061
- Taleb, H. M., & Antony, A. G. (2020). Assessing different glazing to achieve better lighting performance of office buildings in the United Arab Emirates (UAE). Journal of Building Engineering, 28(October 2019), 101034. https://doi.org/10.1016/j.jobe.2019.101034
- Tamer, T., Gürsel Dino, I., & Meral Akgül, C. (2022). Data-driven, long-term prediction of building performance under climate change: Building energy demand and BIPV energy generation analysis across Turkey. Renewable and Sustainable Energy Reviews, 162(March), 112396. https://doi.org/10.1016/j.rser.2022.112396
- Tao, Y., Fang, X., Setunge, S., Tu, J., Liu, J., & Shi, L. (2021). Naturally ventilated double-skin façade with adjustable louvers. Solar Energy, 225(July), 33–43. https://doi.org/10.1016/j.solener.2021.07.013
- Ustaoglu, A., Kurtoglu, K., & Yaras, A. (2020). A comparative study of thermal and fuel performance of an energy-efficient building in different climate regions of Turkey. Sustainable Cities and Society, 59(March), 102163. https://doi.org/10.1016/j.scs.2020.102163
- Zahiri, S., & Altan, H. (2020). Improving energy efficiency of school buildings during winter season using passive design strategies. Sustainable Buildings, 5, 1. https://doi.org/10.1051/sbuild/2019005