
Analysis of the Impact of Attitudes, Knowledge, and Skills of Riders on the Safety of Go-Ride Riders in Depok City
- Ardhi Evan
- Bernard Hasibuan
- Soehatman Ramli
- Tatan Sukwika
- Kholil
- 1882-1895
- Mar 8, 2025
- Management
Analysis of the Impact of Attitudes, Knowledge, and Skills of Riders on the Safety of Go-Ride Riders in Depok City
Ardhi Evan1, Bernard Hasibuan2, Soehatman Ramli3, Tatan Sukwika4, Kholil5*
1 Master’s Program in Management, Occupational Health and Safety, and Environmental Studies, Graduate School of Sahid University Jakarta
2,3,4 Teaching Staff at the Graduate School of Sahid University Jakarta
5Faculty of Engineering Sahid University, Jakarta
* Corresponding Author
DOI: https://dx.doi.org/10.47772/IJRISS.2025.9020154
Received: 18 January 2025; Accepted: 22 January 2025; Published: 08 March 2025
ABSTRACT
Traffic accidents have become a serious transportation problem, often resulting in injuries or even fatalities. One form of transportation that has become an integral part of life in major cities like Jakarta is Go-Jek Online. The presence of Go-Jek significantly aids people in reaching their workplaces or other destinations quickly and affordably. However, many riders still neglect passenger safety, which increases the risk of accidents that can harm passengers.
The aim of this study is to understand and analyze the impact of variables such as attitudes, knowledge, and riding skills on the safety of motorcycle riders from Go-Jek partners, particularly Go-Ride, in Depok City. This study uses a sample of 106 individuals. The analysis tool used is SEM-PLS. The results of the study indicate that (1) Rider attitudes have no significant impact on riding skills, (2) Attitudes towards safety have a significant impact, (3) Rider knowledge significantly affects riding skills, (4) Skills have a significant impact on safety, and (5) Knowledge does not significantly affect safety.
Keyword: Riding Attitudes, Riding Knowledge, Riding Skills, and Rider Safety.
INTRODUCTION
Currently, the majority of Indonesians (over 80%) are consistent consumers of the Go- Jek app (CNBC, 2021). Dependence on online motorcycle taxis, especially in major cities like Jakarta and its surroundings, is very high and tends to be inseparable, as online motorcycle taxis have become a key support for people in meeting their transportation needs affordably and conveniently. Go-Jek provides a range of services, including passenger transport, as well as goods and food delivery.
Go-Jek was first established in 2010 by Nadiem Makarim with the aim of facilitating motorcycle taxi riders in finding passengers and vice versa. Initially, Go-Jek had only around 20 motorcycle taxi riders working with a call center system. By 2015, Go-Jek officially launched its app, which continued to expand its services to include Go-Clean, Go-Massage, and even ventured into Vietnam and Thailand in 2018. This expansion led to an increase from 3,000 orders per day to 100 million orders per day. In 2021, Go-Jek merged with Tokopedia to form a new company named GoTo Group, making it one of the largest technology entities in Southeast Asia.
The growth of online transportation has opened job opportunities for vehicle owners to become part of this online transportation system. As a result, there has been collaboration between vehicle owners and app developers. It is important to note that Go-Ride riders are not employees of Go-Jek but rather partners of Go-Jek, which means not all Go-Ride riders are covered by BPJS Kesehatan (the Indonesian health insurance system). This situation makes riders vulnerable to risks related to protection for themselves and their families.
The primary factor in ensuring that consumers are confident in using Go-Jek as their main mode of transportation is safety. According to data from the Indonesian National Police (Polri), published by the Ministry of Transportation in 2022, there were 137,851 cases of motor vehicle accidents. The records from the Traffic Corps of the Indonesian National Police
(Korlantas Polari) also indicate that several factors contribute to traffic accidents in Indonesia. Of these, 61% are attributed to human error, including issues related to rider skills and characteristics such as laziness, negligence, recklessness, and carelessness. Additionally, 30% of accidents are caused by issues related to infrastructure and environmental factors, while the remaining 9% are due to vehicle-related factors (related to roadworthiness requirements) (Ministry of Transportation, 2023).
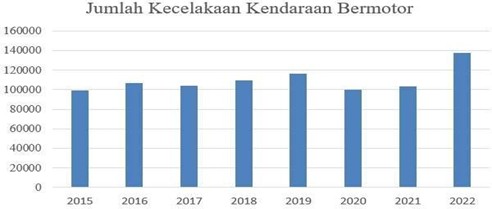
Figure 1.1 Number of accident cases in Indonesia
Source: (Ministry of Transportation, 2024)
Safety plays a crucial role in ensuring that Go-Ride rider partners and consumers are satisfied with their chosen transportation. Every rider desires safety from the start until reaching their destination. Several studies have shown that safety can be influenced by factors such as attitudes, knowledge, and skills (Firmaiansyah & Surjanti, 2014; Muryatma, 2017; Setiani et al., 2019; Hamdan et al., 2024), as well as culture, including how safety culture integrates into daily life (Khasanah et al., 2019; Kurniawan et al., 2019). Safe riding, or safety riding, is a program designed to reduce traffic accidents. Vehicle completeness is a key factor in safety assessments. Essential equipment for every motorcycle rider includes functional turn signals, brake lights, and mirrors (left and right). Additionally, wearing a helmet that meets SNI standards and turning on the headlight during the day are also required (Muryatma, 2017; Puspitasari & Hendrati, 2013).
Perwitaningsih et al. (2013) state that their research, using respondents with an average age of 20 years, shows that respondents’ knowledge is still considered insufficient (e.g., helmet use and turn signal use) at 33.8%. Attitudes of respondents are also found to be lacking (e.g., turn signal use, helmet use, and phone use while riding) at 33.8%, and their compliance with traffic regulations, phone use, and vehicle condition checks before riding is inadequate at 44.6%. A correlation between attitudes and knowledge in safety practices was observed.
Putri et al. (2019) found that knowledge and attitudes among respondents in their study are related to rider safety. On the other hand, positive attitudes among some riders are not always followed by others, who often exhibit negative behaviors or a lack of consideration for other riders. This is evident in practices such as overtaking without yielding or failing to give way to other riders.
According to Ramadhani’s (2021) research, out of a total of 100 riders studied, 20 riders rarely performed initial checks before starting their work or checked/warmed up their motorcycle engines before riding. Additionally, the research findings show that 79% of respondents (79 people) had good knowledge, 12% (12 people) had adequate knowledge, and 9% (9 people) had poor knowledge. Riders with positive attitudes and knowledge tend to perform their activities comfortably, carefully, and responsibly, which promotes safety for both passengers and riders. Conversely, negative attitudes lead to careless, inattentive, and less precise work, increasing the risk of accidents that can endanger both passengers and riders.
Another factor contributing to accidents is rider skill. Riders with limited skills often struggle to adapt quickly to road conditions or frequently engage in actions that can endanger passengers. A rider with good skills in transporting passengers is likely to provide better service, while inadequate riding skills will result in less satisfactory service.
Depok is one of the metropolitan districts close to Jakarta, the capital city of Indonesia. With an area of 200.29 km2 and a population of 2,145,000 million (2024), Depok is a strategic buffer zone for Jakarta. The growth of Depok as a residential area is very high, especially for those who work in Jakarta. Along with the dynamics of the people of Depok to meet their needs, online gojek transportation has become the highest choice for the community. Because this transportation is not only cheap, but also faster to the destination. The increase in online gojek (Go-Ride Riders) users provides an opportunity for most people to work, especially those who cannot be absorbed in formal workplaces, such as government offices or private business institutions. But on the other hand, it also increases competition among online gojek riders, so the safety aspect is less of a concern.
Based of the above condition, it is necessary to conduct research on the relationship between attitudes, knowledge, and skills with safety. This will allow for the formulation of constructive recommendations to foster positive attitudes that enhance safety for both riders and passengers.
1. Research Purposes
The objectives of this study are to:
- Determine the effect of Go-Ride riders’ riding attitudes on Go-Ride rider
- Determine the effect of Go-Ride riders’ riding attitudes on Go-Ride riders’ riding
- Determine the effect of Go-Ride riders’ riding knowledge on Go-Ride riders’ riding
- Determine the effect of Go-Ride riders’ riding knowledge on Go-Ride rider
- Determine the effect of Go-Ride riders’ riding skills on Go-Ride rider
LITERATURE REVIEW
Safety Ride
Safety is defined as a state that is considered secure across various dimensions—spiritual, emotional, physical, psychological, financial, political, social, educational, or occupational—and is free from threats posed by these factors. To achieve this, protection measures can be taken against events that could lead to losses in health or economic terms.
Generally, vehicle safety can be categorized into three types, (1) Normative Safety: this refers to safety concerning the production of products or designs that meet established design standards, (2) Substantive Safety: this pertains to the urgency of a safe condition, even if it may not meet the standards (3) Perceived Safety: this relates to the safety that is perceived by individuals. For example, the presence of traffic signs on the road may create a sense of security but could also lead to accidents if it causes riders to feel anxious.
According to the Republic of Indonesia Law Number 22 of 2009 on Traffic and Road Transport, safety in traffic and road transport is described as the condition where every road user is protected from the risks of accidents while engaged in traffic activities, which can be caused by vehicles, people, roads, or the environment. Manurung et al. (2019) define Safety Riding as an effort to maximize security while riding and minimize the levels of existing hazards.
Riding Knowledge
According to Ruzain et al. (2020), knowledge is information or awareness that a person has. It involves encountering various symptoms and is acquired by humans through sensory observation, also referred to as knowledge. When a person uses their intellect and senses to recognize an object or an event that they have not previously seen or experienced, it becomes knowledge. Ruzain et al. (2020) categorize knowledge into two types based on its form: (1) Direct Knowledge, which is obtained through internal and external perception, and (2) Indirect Knowledge, which is acquired through testimony, authority, and drawing conclusions.
According to Notoatmodjo (2010), knowledge is categorized into six levels: (1) Know: this refers to the ability to recall something or material that has been previously learned. (2) Comprehension: this involves the ability to explain and interpret what one knows correctly. (3) Application: this is the skill or ability to use previously learned material in real-life situations and conditions. (4) Analysis: This refers to the skill or ability to break down an object or material into its various components, while understanding their interrelationships within the same structure. (5) Synthesis: this involves the skill or ability to create new formulations or reorganize existing ones. (6) Evaluation: this is the ability to assess or justify an object or material.
Riding Attitude
Attitude is a crucial concept in social psychology that explores the elements of attitudes, both as groups and individuals (Widyaputra & Dewi, 2017). Attitude can be categorized into three conceptual frameworks. The first framework views attitude as a form of reaction or evaluation of feelings. An individual’s attitude toward an object reflects a favorable or unfavorable feeling toward that particular object.
The second framework considers attitude as a form of readiness or willingness to react to an object in a certain way. In other words, readiness is the tendency to respond in a specific manner when faced with a stimulus that requires a response.
The third framework defines attitude as a representation of the conative, affective, and cognitive components, where these components are interrelated and influence how one behaves, feels, and understands a particular object (Hakim & Nuqul, 2011).
According to Notoatmojo (2003), attitude is divided into several levels: (1) Receiving: this involves the individual’s ability to pay attention to and be receptive to the stimuli provided (object). (2) Responding: this is indicated by the willingness to answer questions, complete tasks, or perform given duties, reflecting the individual’s attitude through the effort made in responding or completing tasks, regardless of whether the work is done well or poorly. (3) Valuing: this involves engaging other individuals or groups in discussion or collaboration on a particular issue, indicating a higher level of attitude. (4) Responsible: this is the highest level of attitude, where an individual is willing to take responsibility for the risks associated with their choices.
Riding Skills
Skill is defined as a person’s ability to use ideas, thoughts, and creativity to create or transform something to add greater value and meaning. How well a person performs specific activities, such as communication or operating equipment, reflects their expertise. Skills also represent the ability or proficiency to carry out certain tasks or jobs, both mentally and physically (Soetjipto, 2002).
Additionally, according to Fauzi (2010), skill can also be demonstrated through specific actions or the nature in which the skill is performed. A person’s level of skill can be illustrated by the number of activities considered skillful, which encompass various degrees of mastery and proficiency. Mujianto (2003) describes skill as the expertise or proficiency linked to specific jobs or tasks that a person possesses and utilizes at a particular time. Skills and abilities play a crucial role in an individual’s performance and behavior. According to Sullivan & Meister (1986) in Nurtanti (2002), riding skills necessary for controlling the direction of the vehicle are one of the key factors determining a person’s ability to ride safely. This is consistent with J. Ohkubo’s (1966) statement in Nurtanti (2002), which indicates that a person’s riding skills can influence their riding ability, alongside other related factors. Nurtanti’s (2002) research found that riders with higher riding skills were more likely to exhibit good behavior, with a percentage of 84.4%. Meanwhile, Muryatma’s (2017) study showed that experience plays a role in shaping knowledge, and experience supported by knowledge tends to be more effective compared to that which is not supported by knowledge, as experience can reinforce understanding.
Conceptual Framework
Based on the theories outlined above, the conceptual framework for this study is as follows:
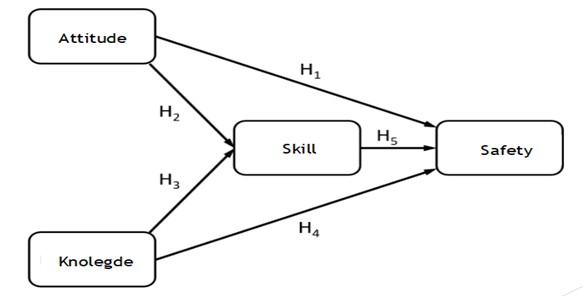
Figure 3.1 Conceptual Framework
Research Hypotheses
Based on the diagram above (Figure 3.1), the hypotheses to be tested are: H1: Riding attitude has an effect on riding safety.
H2: Riding attitude has an effect on riding skills. H3: Riding knowledge has an effect on riding skills. H4: Riding knowledge has an effect on riding safety. H5: Riding skills have an effect on riding safety.
Research Method
This study is classified as quantitative research. Data collection is conducted through questionnaires distributed to Go-Ride rider partners in the Depok City area. The sample size is determined using the Slovin formula with a 5% margin of error. Based on the number of riders in Depok City, a sample size of 106 riders was obtained. Data collection was performed randomly on riders on the road.
Data analysis is conducted using SEM-PLS through three main stages: (1) Outer model testing, (2) Inner model testing, and (3) Hypothesis testing. Outer Model Testing includes: (a) Convergent validity, (b) Construct reliability, (c) Average Variance Extracted (AVE), (d) Discriminant validity, (e) Cross-loading and
(f) Unidimensionality of the model. Inner Model Testing includes: (a) Coefficient of Determination (R²) to determine the extent to which an exogenous variable affects endogenous variables. (b) Effect Size (F²), in addition to examining R² values, Effect Size (F²) by Stone and Geisser is used to evaluate the structural model results.
(c) Goodness of Fit (GoF) to assess the model’s suitability. Hypothesis Testing involves using t- tests to determine the significance of the effect of exogenous variables on endogenous variables, both directly and indirectly (through intervening variables).
Operationalization of Variables
Rider Attitude is also referred to as behavior and represents observable activities that others can notice. It is the result of the integration of internal and external influences on the rider’s understanding. Rider Knowledge refers to the information or awareness that a person has when operating a vehicle. This includes understanding traffic rules, vehicle operation, and safety measures. Riding Skills are the abilities and proficiencies that a rider possesses and uses while riding. This encompasses various aspects of vehicle control, maneuvering, and overall riding competence. Safety riding involves activities aimed at minimizing potential hazards and maximizing safety and security while riding. This entails creating a riding environment that does not endanger other road users, being aware of potential dangers around you, and understanding prevention and handling measures to ensure safe riding conditions.
RESULT AND DISCUSSION
Outer Model Testing
Before hypothesis testing is conducted, it is essential to perform an Outer Model Test. This process involves several evaluation instruments to ensure the measurement model’s validity and reliability. Here are the key instruments for this testing:
Validity dan Reliability
Initially, validity tests were conducted on all indicators. However, the results revealed that some indicators were not valid because their outer loadings were less than 0.70. Consequently, indicators with outer loadings below 0.70 were removed. After eliminating these indicators, a re-test was performed. The results of this retest are shown in the following figure:

Figure 5.1 Model validity test
Figure 5.1 shows the updated validity of indicators after removing those with outer loadings below 0.70. The results are as follows: for the Attitude variable (X1), only 5 indicators are considered valid, for the Knowledge variable (X2), only 10 indicators are considered valid, for the Skills variable (Y), only 11 indicators are considered valid and for Safety (Z), only 7 indicators are considered valid. Indicators that were not valid were removed from the analysis. Further analysis was conducted only on the indicators that were deemed valid.
Gambar 5.1 menunjukkan bahwa pada variable sikap (X1) Hanya tersisa 5 indiokator yang dinyatakan valid, variabel pengetahuan (X2) Hanya 10 variabel yang dinyatakan valid, variabel keterampilan (Y) Hanya 11 indicator yang dinyatakan valid, dan pada keselamatan (Z) Hanya 7 indicator yang dinyatakan valid, sementara lainnya tidak valid dan dihapus. Analisis Sanjuana hanya dilakukan terhadap indicator-indicator yang Telah dinyatakan valid.
Based on the validity of the remaining indicators, reliability testing was performed. The results of the reliability analysis are summarized in the following table:
Table 5.1 Reliability and Validity of Valid Indicators (Stage 2)
| Skills (Y) | Safety (Z) | Knowledge (X2) | Attitude (X1) | |
| X1112 | 0.583 | |||
| X1213 | 0.699 | |||
| X1313 | 0.792 | |||
| X1323 | 0.746 | |||
| X1324 | 0.768 | |||
| X2121 | 0.659 | |||
| X2131 | 0.725 | |||
| X2311 | 0.645 | |||
| X2321 | 0.732 | |||
| X2322 | 0.739 | |||
| X2411 | 0.766 | |||
| X2422 | 0.658 | |||
| X2511 | 0.709 | |||
| X2621 | 0.761 | |||
| X2622 | 0.716 | |||
| Y221 | 0.728 | |||
| Y312 | 0.653 | |||
| Y322 | 0.661 | |||
| Y411 | 0.688 | |||
| Y412 | 0.701 | |||
| Y421 | 0.726 | |||
| Y422 | 0.735 | |||
| Y511 | 0.769 | |||
| Y512 | 0.713 | |||
| Y521 | 0.802 | |||
| Y522 | 0.831 | |||
| Z112 | 0.685 | |||
| Z131 | 0.649 | |||
| Z132 | 0.755 | |||
| Z211 | 0.724 | |||
| Z311 | 0.732 | |||
| Z312 | 0.751 | |||
| Z314 | 0.655 |
Source: Results of PLS Model Processing (2024)
The outer loading values from Table 5.1 show that all indicators or items with a value greater than 0.70 (marked in green) are considered valid. Indicators with values less than 0.70 (marked in red) are deemed invalid. However, indicators or items with outer loading values above 0.60 can still be acceptable if the requirements for construct reliability and validity are met. Based on the values in Table 5.1, the validity of the outer loading values indicates that all items or indicators have good convergent validity.
Multicollinearity
The next step is to test for multicollinearity to determine whether there is a correlation between variables. The multicollinearity test uses the Variance Inflation Factor (VIF). Sekaran and Bougie (2016) explain that multicollinearity occurs when two or more independent variables or exogenous constructs have a very high correlation, which reduces the effectiveness of the model’s predictions. Two variables are considered to have high correlation (indicating multicollinearity) if the VIF is greater than 5 (Sarstedt et al., 2017).
The results of the multicollinearity test, which identify strong intercorrelations among independent variables, can be seen from the VIF values listed in the following table:
Table 5.2. Multicollinearity model test result
| Skills (Y) | Safety (Z) | Knowledge (X2) | Attitude (X1) | |
| Skills (Y) | 2.312 | |||
| Safety (Z) | ||||
| Knowledge (X2) | 1.817 | 3.140 | ||
| Attitude (X1) | 1.817 | 1.817 |
Source: Results of PLS Model Processing (2024)
Based on the VIF values listed in the table above, there are no values exceeding 5, indicating that there are no multicollinearity issues. This means that the variables used in this study (attitude, knowledge, and skills) are deemed appropriate for predicting rider safety.
Construct reliability
Measuring the construct reliability of a latent variable. It is considered reliable if the value is greater than 0.70. Cronbach’s Alpha is also used to assess construct reliability. Based on the calculation results of construct reliability values, as shown in Table 5.3 below:
Tabel 5.3 Nilai construct reliability model
| Cronbach’s Alpha | rho_A | Composite Reliability | Average Variance Extracted – AVE | |
| Skills (Y) | 0.912 | 0.915 | 0.926 | 0.533 |
| Safety (Z) | 0.834 | 0.839 | 0.875 | 0.502 |
| Knowledge (X2) | 0.892 | 0.895 | 0.911 | 0.508 |
| Attitude (X1) | 0.768 | 0.786 | 0.843 | 0.520 |
Source: Results of PLS Model Processing (2024)
Referring to Table 5.3 above, all values are above 0.70, indicating that all indicators in the model are considered reliable.
Average Variance Extracted (AVE)
It is used to assess convergent validity based on the principle that the measurement of a construct should have a high correlation (Ghozali & Latan, 2015). Convergent Validity is evaluated through AVE, where an AVE value above 0.50 indicates that convergent validity is good, and the indicators are considered effective in constructing the model (Wong K.K., 2013; Sarstedt et al., 2017).
Looking at the average variance extracted (AVE) values listed in Table 5.3, all constructs meet the criteria for convergent validity as the AVE values for each construct are above 0.50; therefore, all constructs are considered to have good convergent validity.
Discriminant Validity
Discriminant validity aims to ensure that an indicator truly measures its construct well, based on the principle that each indicator should have a high correlation only with the construct it is intended to measure. Indicators measuring different constructs should not have high correlations with each other (Ghozali & Latan, 2015).
Discriminant validity tests the extent to which latent constructs are indeed distinct from one another. A high level of discriminant validity indicates that the construct is effective and accurately explains the phenomenon being measured. Construct validity is assessed by comparing the square root of the AVE with the correlations among latent variables. The square root of the AVE should be greater than the correlations among latent variables to demonstrate validity. The results of the discriminant validity analysis can be seen in Table 5.4 below:
Table 5.4. Discriminant validity value
| Skills (Y) | Safety (Z) | Knowledge (X2) | Attitude (X1) | |
| Skills (Y) | 0.730 | |||
| Safety (Z) | 0.723 | 0.708 | ||
| Knowledge (X2) | 0.753 | 0.788 | 0.712 | |
| Attitude (X1) | 0.742 | 0.737 | 0.770 | 0.721 |
Source: Results of PLS Model Processing (2024)
The discriminant validity analysis according to the Fornell-Larcker criteria, as shown in the table above, indicates that none of the Fornell-Larcker criteria values or the square root of AVE for any construct are lower than their correlations with other constructs. For example, the Fornell-Larcker criterion value for Y is 0.730. Based on the Fornell-Larcker criteria table above, all square roots of the average variance extracted (AVE) for each construct are higher than their correlations with other variables, thus meeting the requirements for discriminant validity in this model, as detailed in Table 5.4 above.
Cross Loading
The cross-loading values for each construct are assessed to ensure that the correlation between the construct and its measurement items is higher than the correlation with other constructs. An ideal cross-loading value is above 0.70 (Ghozali & Latan, 2015).
Cross-loading is an alternative method for assessing discriminant validity, which involves examining cross-loading values. If the loading values of each item on its respective construct are higher than the cross-loading values on other constructs, then discriminant validity can be considered met. The results of the cross-loading calculations can be seen in the table below:
Tabel 5.5 Cross loading value
| Code | Skills (Y) | Safety (Z) | Knowledge (X2) | Attitude (X1) |
| X1112 | 0.195 | 0.327 | 0.357 | 0.583 |
| X1213 | 0.371 | 0.415 | 0.458 | 0.699 |
| X1313 | 0.383 | 0.545 | 0.522 | 0.792 |
| X1323 | 0.454 | 0.471 | 0.604 | 0.746 |
| X1324 | 0.361 | 0.504 | 0.446 | 0.768 |
| X2121 | 0.453 | 0.523 | 0.659 | 0.524 |
| X2131 | 0.511 | 0.546 | 0.725 | 0.388 |
| X2311 | 0.392 | 0.441 | 0.645 | 0.407 |
| X2321 | 0.505 | 0.449 | 0.732 | 0.524 |
| X2322 | 0.524 | 0.463 | 0.739 | 0.476 |
| X2411 | 0.61 | 0.463 | 0.766 | 0.49 |
| X2422 | 0.535 | 0.42 | 0.658 | 0.564 |
| X2511 | 0.523 | 0.451 | 0.709 | 0.512 |
| X2621 | 0.659 | 0.575 | 0.761 | 0.465 |
| X2622 | 0.598 | 0.543 | 0.716 | 0.447 |
| Y221 | 0.728 | 0.578 | 0.669 | 0.492 |
| Y312 | 0.653 | 0.359 | 0.439 | 0.321 |
| Y322 | 0.661 | 0.402 | 0.421 | 0.348 |
| Y411 | 0.688 | 0.537 | 0.616 | 0.388 |
| Y412 | 0.701 | 0.586 | 0.581 | 0.376 |
| Y421 | 0.726 | 0.437 | 0.522 | 0.239 |
| Y422 | 0.735 | 0.534 | 0.504 | 0.331 |
| Y511 | 0.769 | 0.576 | 0.528 | 0.384 |
| Y512 | 0.713 | 0.614 | 0.574 | 0.371 |
| Y521 | 0.802 | 0.568 | 0.548 | 0.336 |
| Y522 | 0.831 | 0.515 | 0.565 | 0.4 |
| Z112 | 0.491 | 0.685 | 0.484 | 0.532 |
| Z131 | 0.395 | 0.649 | 0.404 | 0.378 |
| Z132 | 0.528 | 0.755 | 0.498 | 0.424 |
| Z211 | 0.447 | 0.724 | 0.371 | 0.45 |
| Z311 | 0.495 | 0.732 | 0.505 | 0.478 |
| Z312 | 0.647 | 0.751 | 0.652 | 0.462 |
| Z314 | 0.535 | 0.655 | 0.447 | 0.422 |
Source: Results of PLS Model Processing (2024)
From Table 5.5 above, it is evident that all indicator loadings on their respective constructs exceed their cross-loading values. Thus, all indicators are deemed to meet the criteria for forming the model and satisfying the requirements for discriminant validity.
Unidimensionality Analysis of the Model
The purpose of unidimensionality testing is to ensure that there are no issues with measurement. This test is conducted by examining composite reliability and Cronbach’s alpha, with a cut-off value of 0.70 for both. Based on Table 5.5, all constructs meet the unidimensionality criteria because their composite reliability values exceed 0.70. For example, the composite reliability for the latent variable Y is 0.926, which is above 0.70, indicating that Y is considered reliable.
Based on the outer model tests for the six indicators—(1) convergent validity, (2) construct reliability, (3) average variance extracted (AVE), (4) discriminant validity, (5) cross- loading, and (6) model unidimensionality—since all items or indicators have met the validity and reliability criteria and there is no evidence of multicollinearity among indicators, the next step is to perform an analysis of the inner model (hypothesis testing).
Inner Model test
After all indicators have been validated and deemed reliable, hypothesis testing is conducted by determining the t-values from the PLS analysis. The obtained t-values are as follows (Figure 5.2):
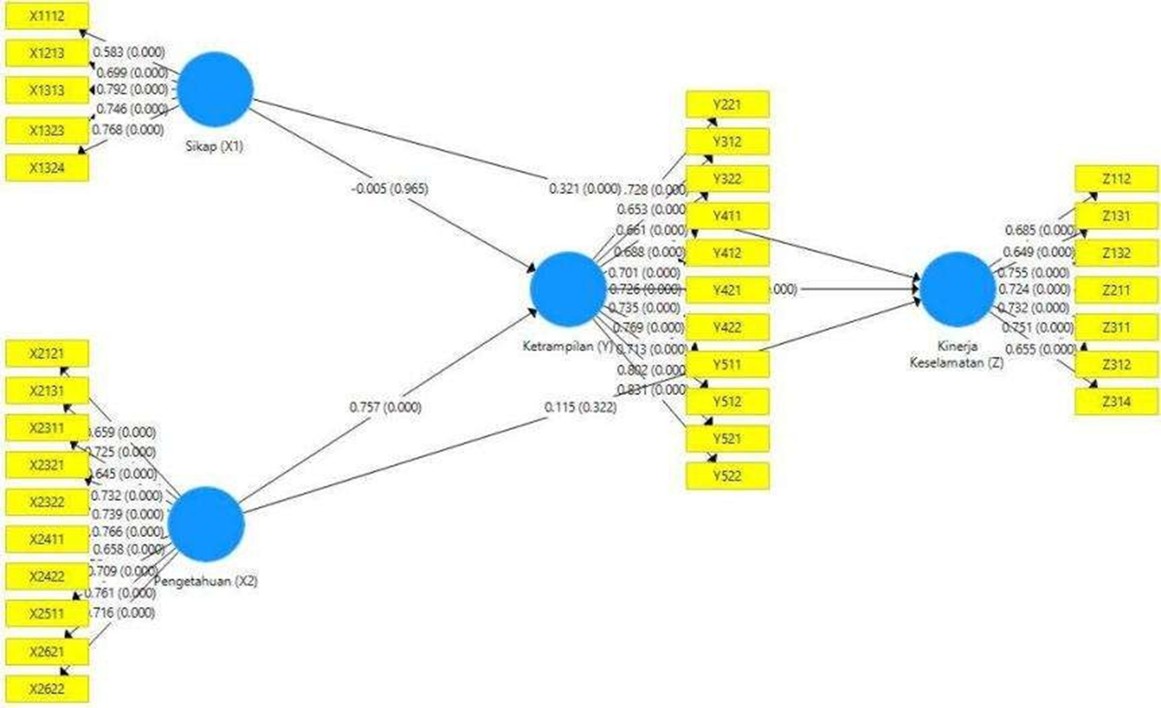
Figure 5.2 Inner Model, results of PLS Model Processing (2024)
Based on the two figures above, Figure 5.2, the details can be summarized as shown in Table 5.6 below:
Table . Results of t-value and p-value calculations for hypothesis testing
| Original Sample (O) | Sample Mean (M) | Standard Deviation (STDEV) | T Statistics (O/STDEV) | P Values | Conclusion | |
| Attitude (X1) -> Skills (Y) | -0.005 | 0.004 | 0.112 | 0.044 | 0.965 | Accept H0 (Not Significant) |
| Attitude (X1) -> Safety (Z) | 0.321 | 0.330 | 0.079 | 4.061 | 0.000 | Accept H1 (Significant) |
| Knowledge (X2) -> Skills (Y) | 0.757 | 0.755 | 0.090 | 8.367 | 0.000 | Accept H1 (Significant) |
| Skills (Y) -> Safety (Z) | 0.475 | 0.473 | 0.105 | 4.516 | 0.000 | Accept H1 (Significant) |
| Knowledge (X2) -> Safety (Z) | 0.115 | 0.113 | 0.116 | 0.992 | 0.322 | Accept H0 (Not Significant) |
Source: Data Processed – Bootstrapping Model.
Based on Table 5.6, the results can be explained as follows:
- The attitude (X1) of riders when riding does not significantly affect skills (Y). This means that attitudes such as patience in riding or awareness of the inherent dangers of riding do not influence riding skills. A rider with less skill will not improve merely by being aware of riding hazards or being patient.
- The attitude of Go-Ride riders (X1) towards safety (Z) is significant. This indicates that the rider’s attitude directly affects safety. A rider who is empathetic towards other road users and avoids reckless riding by being patient and following traffic signs will be safer compared to a rider who is impatient and reckless.
- Knowledge (X2) of riders about skills (Y) is significant. This means that if a rider has sufficient knowledge about traffic signs, vehicle conditions, and road conditions, it will affect their riding skills. A rider will be able to adapt quickly to road conditions, whereas limited knowledge, particularly about traffic signs and safety, will make it difficult to handle challenging or busy roads.
- Skills (Y) significantly affect safety (Z). This means that a rider’s riding skills determine safety. A rider with good skills will easily handle various road conditions and maneuvers, reducing the likelihood of accidents due to road conditions or other factors.
- Knowledge (X2) has a significant effect on skills (Y) but does not directly affect safety (Z). This implies that while rider knowledge about traffic rules and other factors does not directly impact safety, its effect becomes evident through its influence on riding skills.
From these five points, it is evident that skills (Y) are the key determinant of safety, and skills are influenced by the rider’s knowledge of traffic rules and regulations. Essential knowledge for riders to ensure safety and security includes:
- Technical and physical knowledge of the vehicle, such as checking the vehicle condition, changing oil, checking tire pressure, brake condition, etc.
- Traffic rules knowledge, including understanding and complying with traffic signs and road markings, speed limits, overtaking rules, and road signs like stop, no entry, downhill, uphill, etc.
- Knowledge of road conditions: understanding road conditions such as wet, slippery, or winding roads, and knowing how to respond to sudden situations, e.g., dealing with reckless riders, maintaining a safe distance, etc.
- Safety knowledge: understanding the importance of safety for passengers, avoiding using a phone while riding, and staying vigilant to prevent unwanted incidents.
- Knowledge of the effects of prohibited substances: avoiding alcohol or drugs that impair concentration and control while riding.
- Knowledge of fatigue and emotions: knowing when to rest to avoid fatigue, managing emotions while riding, and not reacting impulsively to other riders.
The key skills for riders involve mastering riding techniques, maneuvering, and quickly adjusting speed to road conditions, such as when it is raining, the road is slippery, narrow, or congested. Riders must be able to control their vehicles steadily, and making accurate decisions for acceleration or maneuvering is crucial for safety. Various studies show that road accidents are primarily caused by human factors (69%), mainly due to riding skills influenced by behavior. Unsafe behaviors such as recklessness, using a phone while riding, and fatigue must be avoided to ensure safety. Riders should possess basic skills including: (a) shifting gears, (b) accelerating or decelerating, making left or right turns with signal indicators, (c) braking, (d) overtaking, etc.
To ensure riders have these basic skills, the skill aspect in rider selection for Go-Jek should be a priority. Riders should not only present their rider’s license but also demonstrate their riding skills. Additionally, systematic monitoring should be implemented, covering skills, working hours/fatigue, health, and vehicle condition.
CONCLUSION
- Rider attitude does not have a significant effect on skills, but it does have a direct and significant impact on safety.
- Rider knowledge has a significant effect on riding skills, but it does not have a direct significant impact on safety.
- Skills are a key factor in ensuring safety, and skills are influenced by the rider’s knowledge of traffic rules and signs.
- A rider must have basic knowledge about the vehicle and traffic
Suggestion
- To ensure that riders are safe and secure while riding, regular monitoring and evaluation of their riding skills and knowledge of traffic regulations should be conducted, at least every three months.
- The company needs to develop a monitoring system for riders’ health conditions, working hours, and vehicle conditions, which should be done online through specific instruments or
- Refreshments or updates for riders, both in terms of skills and knowledge, should be implemented to continuously improve safety.
REFERENCES
- Fauzi. (2010). Belajar Keterampilan Motorik, Pengantar Teori dan Metode. Jakarta: Département Pendidikan dan Kebu Dayaan.
- Firmaiansyah, D., & Surjanti, J. (2014). Pengaruh berbagi pengetahuan terhadap kinerja karyawan melalui inovasi. Jurnal Ilmu Manajemen, 2(1), 128-139.
- Ghozali, I., & Latan, H. (2015). Partial Least Squares Konsep Teknik dan Aplikasi dengan Program Smart PLS 3.0. Semarang: Universitas Diponegoro Semarang.
- Hakim, L., & Nuqul, F. L. (2011). Analisa sikap terhadap aturan lalu-lintas pada communitas bermotor. Jurnal Psychology Indonesia, 8(2), 93-103.
- Hamdan, D. F., Rosdiana, Manawatu, A., Djano, N. A., & Rustam, R. (2024, May). Hubungan Sikap, Persepsi, dan Keterampilan Mengendara Siswa Terhadap Perilaku Keselamatan Birendra Safety Riding di SMKN 2 LUWU. MPPKI – Media Publicis Promosi Kesehatan Indonesia – The Indonesian Journal of Health Promotion, 7, 1343-1350.
- Khasanah, N., Kholil, Sugianto. (2019). Analysis the Effect of Leadership to Safety Climate, Safety Culture and Safety Performance. Asian Journal of Advanced Research and Reports 4 (2) : 1-12.DOI:10.9734/AJARR/2019/V4I230106
- Kementerian Perhubungan. (2023, 09 19). Kementerian Perhubungan Republik Indonesia https://dephub.go.id/post/read/%E2%80%8Btekan-angka-kecelakaan-lalu-lintas
- Kurniawan, J.S., Kholil, Sugianto. (2019). The Effect of Implementation SMKP (Occupational Health and Safety Management) and Safety Leadership to Safety Performance. International Journal of Occupational Medicine and Environmental Health. 1 (4): 20-31. Corpus ID: 203589972
- Mujianto, B. (2003). Faktor-Faktor yang Berhubungan dengan Perilaku Penggunaan Boraks pada Bakso yang Jajakan di Kecamatan Pondok Gede Bekasi Tahun 2003. Depok: Universitas Indonesia.
- Manurung, J., Sitorus, M. E., & Rinaldi, R. (2019). Faktor-Faktor yang Berhubungan dengan Perilaku Safety Riding Pengemudi Ojek Online (Go-Jek) di Kota Medan Sumatera Utara. Journal of Health Science and Physiotherapy, 1(2), 91-99.
- Muryatma, N. M. (2017). Hubungan antara factor keselamatan berkendara dengan perilaku keselamatan berkendara. Jurnal Promkes: The Indonesian Journal of Health Promotion and Health Education, 5(2), 155-166.
- Notoatmodjo, S. (2010). Ilmu perilaku kesehatan. Jakarta: PT. Rineka Cipta
- Nurtanti, D. (2002). Gambaran Perilaku Pengendara Sepeda Motor di Jalan Arteri Margonda Depok terhadap Kecelakaan Lalu Lintas Tahun 2002. Skripsi. Faculties Kesehatan Masyarakat. Universitas Indonesia.
- Perwitaningsih, R., Mahawati, E., & Hartin, E. (2013). Hubungan antara Pengetahuan dan Sikap Terhadap Pratik Keselamatan dan Kesehatan Berkendara Sepeda Motor pada Masahisa Kesehatan Masyarakat Udinus Semarang Tahun 2013. Jurnal Udinus.
- Purwanti, T., & CNBC. (2021). Riset: Ecosystem Gojek jadi Andalan Masyarakat Saat Pandemi. Retrieved from https://www.cnbcindonesia.com/tech/20211216134115-37- 299794/riset-ekosistem-gojek-jadi-andalan-masyarakat-saat-pandemi
- Puspitasari, A. D., & Hendrati, L. Y. (2013). Hubungan antara factor pengemudi dan factor lingkungan dengan kepatuhan mengendarai sepeda motor. Jurnal Berkala Epidemiology, 1(2).
- Putri, E. P. P., Nurhayati, S., & Sukamto, F. I. (2019, 2019). Hubungan Pengetahuan dengan Sikap Remaja dalam Keselamatan Berkendara.
- Ramadhani, R. (2021). Hubungan antara Pengetahuan, Sikap dan Masa Berkendaraan dengan Perilaku Safety Riding pada Pengemudi Ojek Online di Kota Banjar Baru Tahun 2020. Repository Universitas Islam Kalimantan. https://eprints.uniska-bjm.ac.id/4137/.
- Ruzain, R. B., Herawati, Y., & Christofa, D. (2020). Hubungan Pengetahuan Berkendara Selamat Dengan Kecelakaan Pengemudi Transports Roda Dua Ber basis Online Di Kota Ekambar. Jurnal Islamika, 3(1), 161-169.
- Sarstedt, M., Ringle, C. M., & Hair, J. F. (2017). Partial Least Squares Structural Equation Modeling. Handbook of Market Research, 1-40.
- Setiani, A., Majid, S. A., & Haroen, Z. A. (2019). Keselamatan Pengemudi Go-Jek di Jakarta Timur. Jurnal Manajemen Transports & Logistik, 6(1), 11-22.
- Soetjipto, B. W. (2002). Paradigma Baru Manajemen Sumber Daya Manusia. Yogyakarta: Usaha Penerbit Amara Books.
- Widyaputra, K. A., & Dewi, A. A. S. K. (2017). Pengaruh Motivasi Intrinsik Terhadap Kepuasan Kerja Dan Kinerja