
Analyzing the Determinants of Land Parcel Transformation in BRT Catchment Areas: A Bibliometric and RII-Based Assessment
- Mufeeza Tahira
- Rana Tahir Mehmood
- Muhammad Zaly Shah
- Ramine Chuhdary
- Shahroze Javaid
- 348-379
- Mar 26, 2025
- Urban and Regional Planning
Analyzing the Determinants of Land Parcel Transformation in BRT Catchment Areas: A Bibliometric and RII-Based Assessment
Rana Tahir Mehmood1, Muhammad Zaly Shah2, Mufeeza Tahira3*, Ramine Chuhdary4, Shahroze Javaid5
1,2,4Faculty of Built Environment, University Technology Malaysia, 81310 Johor Bahru, Malaysia
3Independent Researcher, University of Malaya, Malaysia
5Faculty of Built Environment, University of Malaya, Malaysia
DOI: https://dx.doi.org/10.47772/IJRISS.2025.90300029
Received: 22 February 2025; Accepted: 27 February 2025; Published: 26 March 2025
ABSTRACT
Bus Rapid Transit (BRT) systems play a vital role in land use transformation, property value changes, and urban density shifts. While research on BRT corridor impacts is extensive, studies often focus on localized cases, lacking a comprehensive quantitative evaluation of the key factors driving land parcel transformations. This study identifies significant variables that influence land parcel transformation through bibliometric analysis, content analysis, and expert-driven assessments using Relative Importance Index (RII) analysis. The research employs VOSviewer, Bibliometrix R-package, and Harzing’s Publish or Perish to analyze 795 publications from 1979 to 2024, extracted from the Web of science database. It evaluates the influence of BRT corridors on land use transformation, property values, urban density, and socio-economic dynamics, identifying significant transit route factors and land parcel variables through keyword co-occurrence networks, citation trends, and thematic clustering. Additionally, a structured questionnaire survey using a Likert scale was conducted among 56 field experts, and RII analysis was applied to rank the significance of transit-related variables. RII findings revealed 14 key variables significantly impacting land parcel transformation, with Parking Provision (RII = 0.7929), Proximity (RII = 0.7893), and Passenger Supply (RII = 0.7857) among the most influential. Conversely, 35 variables with RII values below 0.5 were excluded. The study confirms that BRT corridors enhance property values, promote higher-density developments, and improve accessibility, but these effects vary based on market conditions, policy frameworks, and transit infrastructure characteristics. Furthermore, the research highlights disparities in transit-induced development benefits, including socio-economic displacement and land-use inequities. The results offer a structured foundation for policymakers and urban planners to enhance sustainable and equitable transit-oriented development strategies. Additionally, the study highlights the need for long-term evaluations to ensure that BRT systems contribute to balanced urban growth and economic sustainability.
Keywords: Transit corridor, Bus Rapid Transit (BRT), Land parcel transformation, Bibliometric analysis, Relative Importance Index (RII)
INTRODUCTION
The evolution of urban transportation systems has played a crucial role in shaping cities, with Bus Rapid Transit (BRT) systems emerging as a key component in land-use transformation, accessibility enhancement, and socio-economic restructuring. BRT corridors, characterized by dedicated lanes, efficient service, and multimodal connectivity, have been found to influence land parcel transformations by affecting property values, urban density, and spatial development (Smith et al., 2018; Johnson, 2020; Litman, 2020). As cities increasingly adopt transit-oriented development (TOD) strategies, understanding the extent of BRT-induced land parcel changes becomes essential for sustainable urban planning (Cervero & Dai, 2014; Banister, 2019).
While existing research highlights the impacts of BRT corridors on land values, land use, and economic activities, there remains a critical gap in consolidating findings to identify major influencing factors, thematic trends, and underexplored areas (Zhang & Liu, 2019; Garcia et al., 2021; Kamruzzaman et al., 2018). Furthermore, there is limited quantitative assessment of the key transit route factors and land parcel indicators that drive urban transformation. Most studies focus on localized case studies or qualitative assessments, lacking a structured data-driven synthesis of these interactions (Duarte & Rojas, 2018; Banister, 2022; Ewing & Cervero, 2010). This research aims to bridge this gap by conducting a bibliometric analysis combined with expert-driven quantitative assessments.
To systematically evaluate the relationship between BRT corridors and land parcel changes, this study employs bibliometric analysis and visualization techniques such as VOSviewer and Bibliometrix R-package. These tools are used to map co-occurrence networks, identify citation patterns, and analyze thematic clusters within the existing body of research (Chen & Kim, 2020; Zhao & Li, 2018). This quantitative approach enables the identification of key transit route factors and land parcel indicators that have been widely discussed in academic literature (Beirão & Cabral, 2007; Guzman & Oviedo, 2018).
In addition to bibliometric analysis, the study integrates a questionnaire survey based on a Likert scale, collecting expert evaluations of the effectiveness of various transit-related factors in influencing land parcel transformations. Responses from 56 field experts are analyzed using the Relative Importance Index (RII) methodology to rank the significance of different BRT attributes (Miller & Zhang, 2023; Currie & Delbosc, 2011). Variables with an RII value above 0.5 are classified as significant, while those below the threshold are excluded from further analysis. This structured ranking approach ensures that only the most impactful transit route factors and land parcel characteristics are considered in policy recommendations (Paulley et al., 2006; Diab & El-Geneidy, 2019).
By integrating bibliometric techniques, expert evaluations, and quantitative ranking methods, this study provides a comprehensive assessment of the role of BRT systems in land parcel transformations. The findings will contribute to the scientific discourse on transit-induced land use changes, helping urban planners, policymakers, and researchers develop data-driven urban development strategies (Li et al., 2021; Wilson, 2019; Bertolini et al., 2012). Moreover, by extracting and analyzing significant land parcel transformation variables, this research offers a robust foundation for evidence-based planning and transit infrastructure optimization (Mees, 2015; Diana, 2016).
The novel contribution of this study lies in its dual analytical approach, combining systematic bibliometric mapping with quantitative expert-based validation. By addressing gaps in the synthesis of BRT-related land parcel impacts, this research enhances the understanding of spatial, economic, and policy dimensions of transit infrastructure. Furthermore, it underscores the need for longitudinal studies, policy intervention assessments, and equitable land development strategies to optimize BRT-induced urban transformations (Rodriguez & Allen, 2022; Nguyen & Tran, 2021; Javid & Okamura, 2019). Ultimately, this study aims to provide a policy-relevant framework for maximizing BRT system benefits while mitigating unintended socio-economic consequences (Peters & Brown, 2020; Hensher & Ho, 2020).
LITERATURE REVIEW
Bus Rapid Transit (BRT) corridors have emerged as a significant driver of urban land parcel transformation, influencing land use patterns, property values, and spatial development. Numerous studies highlight that proximity to BRT stations leads to increased land values and higher-density developments, particularly in areas with well-integrated transit infrastructure and accessibility enhancements (Cervero, 2013; Duarte & Rojas, 2018). However, the extent of these transformations varies based on market conditions, zoning policies, and socio-economic factors (Banister, 2022; Kamruzzaman et al., 2018). For instance, cities with flexible zoning policies and strong regulatory frameworks tend to experience planned and sustainable transit-induced developments, whereas areas with weak governance and unregulated markets may witness uncontrolled densification, speculative land purchases, and socio-economic displacement (Bocarejo & Oviedo, 2012). Additionally, economic conditions such as GDP growth, employment opportunities, and investment in public infrastructure play a crucial role in determining whether transit-driven land transformations lead to positive or negative externalities (Suzuki et al., 2013). While some areas witness substantial growth and investment, others experience negative externalities such as gentrification and displacement, raising concerns about equity in transit-induced development (Jones & Davis, 2021). For example, studies in Latin American and South Asian cities reveal that BRT-driven land value increases often disproportionately benefit landowners while marginalizing lower-income populations due to rising rents and property costs (Mu & de Jong, 2016; Cervero & Dai, 2014). This underscores the importance of identifying key determinants of land parcel transformations to develop sustainable and equitable urban growth strategies.
Several studies have categorized the determinants of land parcel transformation into transit route factors and land parcel variables. However, debates exist regarding the extent to which these factors interact, as some researchers argue that transit infrastructure primarily influences land-use changes through accessibility improvements, while others emphasize the role of economic incentives, policy interventions, and demographic shifts (Rodriguez & Targa, 2004; Tsivanidis, 2019). Some studies also highlight that transit development alone does not guarantee land-use transformation unless complemented by strategic urban policies, such as inclusionary zoning, land value capture mechanisms, and transit-supportive regulations (Suzuki et al., 2015). Among transit route factors, proximity to BRT stations has been identified as a primary driver of land value appreciation, as properties within 500 meters to 1 km of a transit stop tend to attract commercial and residential developments due to improved accessibility (Mohammad et al., 2013). Additionally, parking provision, service road availability, and feeder routes play crucial roles in determining land use efficiency and commercial viability near transit corridors (Behrens & Kane, 2021; Diab & El-Geneidy, 2019). Recent studies suggest that land-use outcomes are highly context-dependent, with variations across different urban typologies. For instance, in rapidly growing cities with informal land markets, the effects of BRT corridors on land transformation may be more pronounced due to speculative investments, whereas in well-planned metropolitan areas, the impact may be more controlled and policy-driven (Salon & Shewmake, 2011; Gakenheimer, 2011). On the other hand, land parcel variables such as land value, land use, building condition, and population density influence how transit corridors reshape urban landscapes, with higher land values and mixed-use zoning promoting compact, transit-oriented development (Litman, 2020; Bertolini et al., 2012). The interaction between these land parcel characteristics and transit-induced accessibility improvements shapes the long-term sustainability of urban growth, making it essential to incorporate multi-dimensional assessments in future research (Levinson et al., 2003; Currie, 2006).
To systematically assess transit-induced land transformations, researchers have increasingly relied on bibliometric analysis and content mapping techniques. Bibliometric analysis enables the identification of key research trends, citation networks, and thematic clusters in transit and land use studies (Chen & Kim, 2020; Miller & Zhang, 2023). Tools like VOSviewer and Bibliometrix R-package have been widely used to map keyword co-occurrence networks and author collaborations, helping scholars understand the evolution of research on BRT-induced land use changes (Zhao & Li, 2018). Recent studies indicate a rising academic interest in accessibility, transit-induced gentrification, and urban density shifts, but there remains a lack of longitudinal studies assessing long-term land-use transformations (Rodriguez & Allen, 2022; Nguyen & Tran, 2021).
Alongside bibliometric techniques, Relative Importance Index (RII) analysis has gained prominence as a method for quantifying the significance of transit-related variables based on expert evaluations (Paulley et al., 2006; Diab & El-Geneidy, 2019). RII allows researchers to prioritize key determinants of land parcel transformation by assigning weighted scores to transit and land-use attributes, ensuring that only the most influential factors are considered in policy recommendations (Sarstedt et al., 2021). Past studies using RII have identified station infrastructure, pedestrian accessibility, and commercial viability as dominant factors shaping transit-oriented land developments (Litman, 2020; Javid & Okamura, 2019). This study builds upon these approaches by combining bibliometric mapping and RII rankings to extract key variables affecting BRT corridor-induced land parcel transformations.
Despite significant advancements in research, several gaps remain unaddressed. There is a need for long-term studies to track how land parcel changes evolve over time, particularly in relation to policy interventions and socio-economic equity (Jones & Davis, 2021). Additionally, most studies focus on single case studies, limiting the generalizability of findings across different urban contexts (Garcia et al., 2021). Future research should integrate geospatial analytics, machine learning, and comparative studies to refine predictive models of transit-induced land transformations (Shaheen et al., 2016; Peters & Brown, 2020). Addressing these gaps will be critical in developing data-driven, equitable urban planning strategies that maximize the benefits of BRT systems while minimizing unintended social and economic consequences.
METHODOLOGY
The methodology employed in this study consists of four key steps: data collection, data processing, data analysis, and RII analysis. The research integrates bibliographic analysis, citation and keyword mapping, content evaluation, and expert-based assessment to systematically examine the impacts of transit corridors on urban land parcels. To ensure a robust analysis, a multi-method approach was adopted, combining bibliometric techniques, visualization tools, and statistical modeling.
Bibliometric analysis was conducted to quantitatively assess the scholarly literature, leveraging citation and keyword analysis to identify influential works, authors, and journals. This method is particularly suitable for this study as it enables the identification of dominant research themes, gaps, and emerging trends in transit-induced land-use transformation (Donthu et al., 2021). Bibliometric techniques allow for an objective and reproducible assessment of academic contributions, reducing biases inherent in manual literature reviews (Aria & Cuccurullo, 2022). Recent studies emphasize the value of bibliometric approaches in urban planning and transport research, as they facilitate structured exploration of vast academic datasets and enable the visualization of evolving research frontiers (Zupic & Čater, 2018; Mukherjee et al., 2022).
The research utilized Harzing’s Publish or Perish to extract citation metrics and trends, while VOSviewer and Bibliometrix R-package were employed to generate co-occurrence networks, cluster analysis, and thematic structures. These mapping techniques allowed for the visualization of research trends, relationships among keywords, and thematic evolutions over time. The association strength formula in VOSviewer was applied to compute keyword relationships and develop co-occurrence networks, aiding in identifying dominant themes in transit-related land-use studies. This method complements other analytical techniques in this study by providing an empirical foundation for variable selection, ensuring that only the most significant and frequently cited transit route and land-use indicators are incorporated into the analysis. Additionally, bibliometric findings enhance content analysis by validating the relevance of selected transit variables based on citation frequency and thematic clustering (Sharma et al., 2023). Furthermore, bibliometric analysis is instrumental in identifying interdisciplinary linkages between transit-oriented development, land-use planning, and economic sustainability, thereby broadening the scope of inquiry (Van Eck & Waltman, 2020).
Furthermore, content analysis was performed to extract key land parcel indicators and transit route factors relevant to BRT corridors. This involved systematically reviewing documents to identify variables influencing land parcel transformations. Content analysis builds upon bibliometric analysis by providing a deeper qualitative evaluation of identified variables, ensuring contextual relevance and policy applicability (Krippendorff, 2021). Key transit route characteristics, such as accessibility, station infrastructure, and land value changes, were categorized and mapped for further analysis.
To enhance the rigor of the study, a Relative Importance Index (RII) analysis was conducted based on expert evaluations. A structured questionnaire was administered to 56 field experts, who rated the effectiveness of various transit route factors and land parcel variables using a Likert scale. The RII calculation provided a structured ranking of these variables based on their influence on land parcel transformations, distinguishing the most significant factors from those with limited impact. This ensured that the study incorporated both empirical data and expert-driven insights for a comprehensive evaluation of transit corridor effects.
By systematically executing these steps, this study provides a data-driven approach to understanding how transit corridors impact urban land use. The integration of bibliometric mapping, content evaluation, and RII ranking facilitates a more nuanced interpretation of transit-induced urban transformations. The overall methodological flow is illustrated in Figure 1.
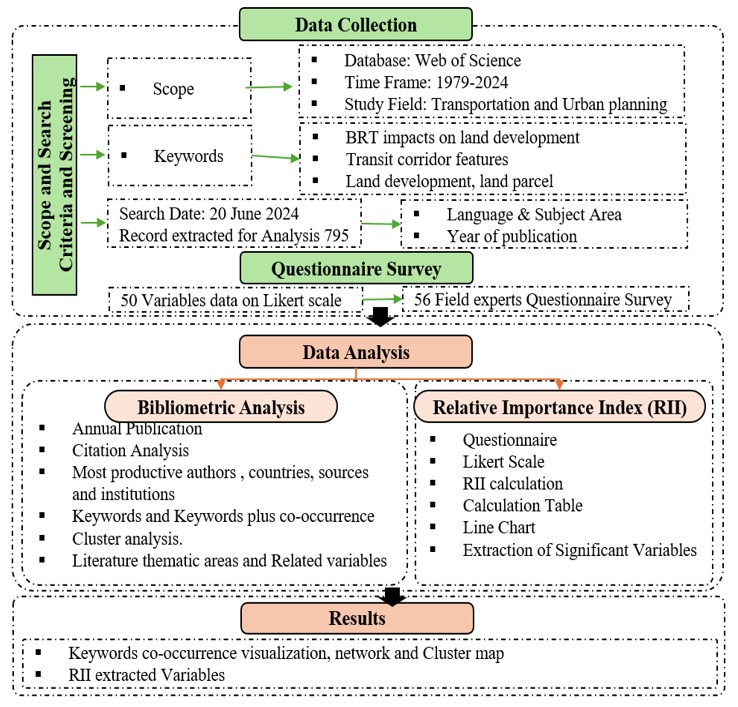
Figure 1 – Flowchart of research methodology
Data Collection
The data collection process consisted of two main streams: (i) Literature-based Data Collection and (ii) Expert-based Data Collection for RII Analysis.
Literature-Based Data Collection
This step involved extracting relevant documents from selected databases. The extraction of documents followed these sub-steps:
- Identification of Keywords: To capture a broad spectrum of relevant studies, keywords related to the topic were identified, including terms such as “transit corridors,” “urban land use,” “Bus Rapid Transit (BRT),” “land parcels,” and “transit-oriented development.” Boolean operators and wildcard characters were incorporated into the search query to refine the search results.
- Defining the Study Scope: The scope of the study was defined based on a time frame (1979-2024), language (English), document type, and subject area. The time frame ensured the inclusion of studies covering the long-term impact of transit corridors. Non-relevant subject areas such as medicine, chemistry, psychology, and pharmacology were excluded.
- Application of Search Query: The refined search query was applied in Web of science, chosen for its extensive coverage of academic publications compared to databases such as Web of Science and Google Scholar.
- Screening and Refinement of Results: The initial search retrieved 930 documents, which were then filtered based on language, document type, and subject area, resulting in a final selection of 795 documents for bibliometric and content analysis.
Expert-Based Data Collection for RII Analysis
To assess the relative importance of transit route factors and land parcel variables, data were collected using a structured questionnaire survey. This study involved 56 field experts who were requested to rate the effectiveness of each variable using a Likert scale, where 1 represented Not Effective, 2 indicated Slightly Effective, 3 denoted Neutral, 4 signified Effective, and 5 corresponded to Very Effective. The Relative Importance Index (RII) was then calculated for each variable to determine its significance in influencing land parcel changes near transit corridors.
Data Processing Steps
The data processing phase involved analyzing the 795 extracted documents and expert survey responses to identify trends, research gaps, and key influences. The following tools and techniques were applied:
- Bibliometric Analysis: Harzing’s Publish or Perish tool was used to generate citation metrics, including total citations, citations per year, and key contributing authors.
- Content Mapping and Visualization: Tools such as VOSviewer and Bibliometrix R-package were employed to generate bibliometric networks, including keyword co-occurrence maps, author collaborations, and thematic evolution trends.
- VOSviewer Co-Occurrence Analysis: The co-occurrence visualization map was generated based on keyword frequency across extracted documents. The association strength formula used in VOSviewer is:
Sij= Cij/CiCj
where Sij is association strength between keyword i and keyword j, Cij is number of co-occurrences of keyword i and keyword j and Ci, Cj is total occurrences of keyword i and keyword j, respectively.
- Cluster maps were created using modularity-based clustering algorithms to detect thematic relationships and research clusters.
- Content Review: The systematic document review identified the most productive authors, institutions, and countries, as well as the most cited research contributions.
Data Analysis
This step involved analyzing and reviewing the 795 extracted documents and expert survey data. The key analytical techniques employed were:
- Bibliometric Analysis to determine annual publication trends, citation metrics, and institutional research productivity.
- Visualization tools such as Microsoft Excel were used for documenting the extracted data, Harzing’s Publish or Perish for computing citation metrics, VOSviewer for generating bibliometric networks, and Bibliometrix R-package for analyzing keyword trends and thematic evolution.
- Relative Importance Index (RII) Calculation was carried out with formula:
RII=∑W/(AxN)
where: – W = weight assigned to each variable (sum of Likert scale scores) – A = highest rating in the Likert scale (5) – N = total number of respondents (56).
- Variables with RII values greater than 0.5 were classified as significant and used for further analysis, while those below 0.5 were excluded.
Interpretation of RII Results
The results were interpreted accordingly, highlighting the significance of transit route factors and land parcel variables in shaping urban development patterns. The analysis confirmed that key transit attributes such as accessibility, station infrastructure, and passenger movement significantly influence land parcel transformations. The high RII values of selected variables underscore their critical role in transit-oriented development, while lower-ranked variables were identified as having minimal impact, leading to their exclusion from further analysis. This study combines bibliometric analysis, content mapping, and RII-based expert assessments to systematically evaluate the relationship between BRT corridors and urban land parcel transformations. The multi-step methodology ensures a comprehensive, data-driven approach to analyzing transit-induced land-use changes and provides a robust framework for policymakers and urban planners to optimize transit-oriented development strategies.
RESULTS AND ANALYSIS OF FINDINGS
Citation metrics and annual publications trend
The extraction of documents was made through a rigorous search strategy and screening process. Subsequently, many tools were applied to obtain the desired output. Firstly, the extracted data was organized into Harzing’s Publish and Perish tool to examine the statistical information and citation metrics of selected documents. Table 1 shows the citation metrics of the selected documents where details on total documents and their citations are presented. The number of published documents and citation effect from 1979 to 2024 demonstrate significant academic output and influence. Over the past 45 years, 795 documents have been published, producing 18,407 citations. This amounts to an annual average of 409.04 citations, demonstrating the research’s long-term influence and significance. Each document has an average of 23.15 citations, indicating strong involvement and use by other researchers. The fact that this research has an average of 3.22 authors per manuscript demonstrates the collaborative efforts by various researchers. With an h-index of 72 and g-index of 110, the selected documents suggest productive citations record. The citation metrics highlight the research output’s consistency, citation rates, and general depth, demonstrating its substantial and enduring impact on the academic community.
Table 1 – Citation metrics of the extracted documents
| Aspect | Value | Aspect | Value |
| Publication years | 1979-2024 | Citations/ paper | 23.15 |
| Total documents | 795 | Authors/ paper | 3.22 |
| Total citations | 18407 | h-index | 72 |
| Citations/ year | 409.04 | g-index | 110 |
Out of 795 extracted documents, the majority are research articles, comprising 72.2% of the total publications, as shown in Figure 2. This is followed by conference papers making up a total of 19.4% of the total publications. This distribution emphasizes the importance of original research dissemination. A significant proportion of conference papers demonstrate extensive participation in academic conferences by researchers for the presentation of research findings and collaboration with other experts. The inclusion of book chapters and review articles indicates contributions to synthesizing and contextualizing research findings within larger academic discourses.
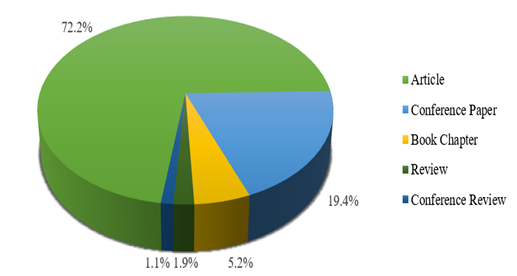
Figure 2 – Document types
Figure 3 displays the annual trends in total publications (TP) and total citations (TC) from 1979 to 2024. The bar chart of total publications indicates a continuous growth over time, with notable peaks in 2011 (45 publications), 2014 (57 publications), and 2020 (82 publications). The line graph for total citations shows a more fluctuating trend, with a considerable increase beginning in the early 2000s, peaking around 2011 with 2,203 citations, and then declining in future years. This pattern implies that research output and influence have grown over time, with a significant increase in publications and citations in the previous decade, demonstrating the topic’s importance in recent years.
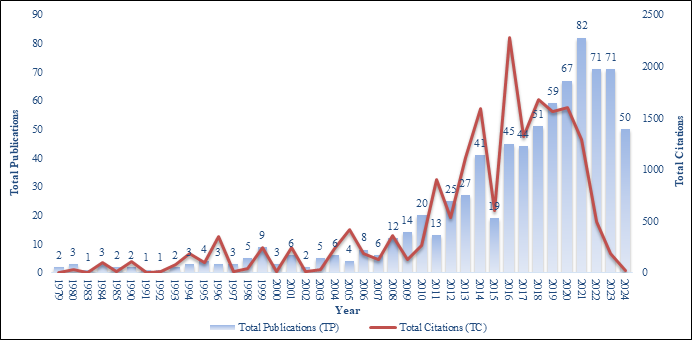
Figure 3 – Subject areas and annual production trends of publications
Figure 4 illustrates the publication growth on the topic from 1979 to 2024. The graph shows the exponential increase in cumulative publications from 1979 to 2024, with a R² value of 0.9961, showing a nearly perfect fit. The data show a steady growth in publications from 1979 to the early 2000s, followed by a significant increase in total publications in subsequent years, reaching 795 by 2024. This graph demonstrates the increased study activity and interest in this specific topic over the last few decades.
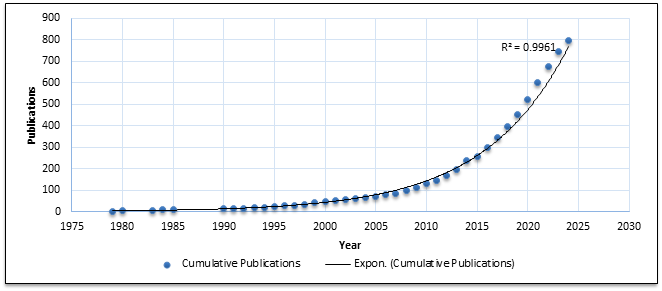
Figure 4 – Trendline of the cumulative number of publications
Top Authors, Articles, Countries, and Institutions
Table 2 lists the top ten authors according to their contributions to the intended research topic, emphasizing both publication count and citation effect. Pourghasemi, H.R. from Shiraz University in Iran, leads with 12 articles (1.51% of total) and 1,459 citations, showing a substantial impact. Zhang, M., from The University of Texas at Austin, USA, is next with 10 publications (1.26%) and 169 citations. Cervero, R., of the University of California, Berkeley, USA, has 9 publications (1.13%) and a significant 1,021 citations. Kamruzzaman, M. from Monash University, Australia, and Pan, H. from Tongji University, China, both have 8 publications (1.01%), with 465 and 288 citations, respectively. This ranking highlights the broad geographic presence and varying levels of impact among leading contributors to the subject.
Table 2 – Most productive authors ranked based on total publications
| Rank | Author Name | TP (%) | Affiliation | Total Citations |
| 1 | Pourghasemi, H.R. | 12 (1.51%) | Shiraz University, Shiraz, Iran | 1459 |
| 2 | Zhang, M. | 10 (1.26%) | The University of Texas at Austin, Austin, United States | 169 |
| 3 | Cervero, R. | 9 (1.13%) | University of California, Berkeley, Berkeley, United States | 1021 |
| 4 | Kamruzzaman, M. | 8 (1.01%) | Monash University, Clayton, Australia | 465 |
| 5 | Pan, H. | 8 (1.01%) | Tongji University, Shanghai, China | 288 |
| 6 | Bertolini, L. | 7 (0.88%) | Universiteit van Amsterdam, Amsterdam, Netherlands | 243 |
| 7 | Wang, S. | 7 (0.88%) | Shenyang Agricultural University, Shenyang, China | 193 |
| 8 | Cao, J. | 6 (0.75%) | University of Minnesota Twin Cities, Minneapolis, United States | 279 |
| 9 | Ding, C. | 6 (0.75%) | Beihang University, Beijing, China | 329 |
| 10 | Furlan, R. | 6 (0.75%) | Qatar University, Doha, Qatar | 125 |
Table 1 shows the top 10 documents ranked based on the total number of citations. Additionally, the information on year of publication, total citations, and citations per year have been given. The paper with highest citations of 349 entitled ” Smart growth and the transportation-land use connection: What does the research tell us?” was published in 2005 in “International Regional Science Review”. This extensive study discussed the impact of highway construction on growth, light rail transit on density, and new urbanism on vehicular use, highlighting the crucial role transportation-land use connection plays in smart growth. Another key review study, with a remarkable citation count of 215, presented a detailed evaluation of transit-oriented development. This article addressed the successes in combining transportation and land use planning, as well as the challenges in various project outcomes and complicated affecting factors.
Table 3 – Top 10 documents ranked based on total citations
| Rank | Publication Title | Reference | Year | Citation | Citations / year |
| 1 | Smart growth and the transportation-land use connection: What does the research tell us? | Handy, S. | 2005 | 349 | 18.37 |
| 2 | Transit-oriented development in a high-density city: Identifying its association with transit ridership in Seoul, | Sung, H., Oh, J.-T. | 2011 | 293 | 22.54 |
| 3 | Bus rapid transit impacts on land uses and land values in Seoul, Korea | Cervero, R., Kang, C.D. | 2011 | 287 | 22.08 |
| 4 | Digital soil mapping algorithms and covariates for soil organic carbon mapping and their implications: A review | Lamichhane, S., Kumar, L., Wilson, B. | 2019 | 235 | 47.00 |
| 5 | Advance transit-oriented development typology: Case study in Brisbane, Australia | Kamruzzaman, M., Baker, D., Washington, S., Turrell, | 2014 | 233 | 23.30 |
| 6 | Built environment as determinant of walking behavior: Analyzing nonwork pedestrian travel in Portland, Oregon | Greenwald, M.J., Boarnet, M.G. | 2001 | 223 | 9.70 |
| 7 | Half-mile circle | Guerra, E., Cervero, R., Tischler, D. | 2012 | 220 | 18.33 |
| 8 | Transit-oriented development: A review of research achievements and challenges | Ibraeva, A., Correia, G.H.D.A., Silva, C., Antunes, A.P. | 2020 | 215 | 53.75 |
| 9 | Land use characteristics of subway catchment areas and their influence on subway ridership in Seoul | Jun, M.-J., Choi, K., Jeong, J.-E., Kwon, K.-H., Kim, H.-J. | 2015 | 211 | 23.44 |
| 10 | Comparing transit-oriented development sites by walkability indicators | Schlossberg, M., Brown, N. | 2004 | 200 | 10.0 |
Figure 5 shows the details of the top 10 countries ranked based on the number of total publications. Among the 68 countries that contributed to the publications on the topic, China contributed the most with 259 papers, accounting for 32.58%. This was followed by Unites States with 239 publications, accounting for 30.06%, Australia with 49 publications (6.16%), Canada with 41 papers (5.16%), and India with 35 (4.40%) ranked among the top 10 most productive countries. Despite fewer articles than China, the United States hold the highest number of total citations among the top 10 countries, depicting the significance of publications.
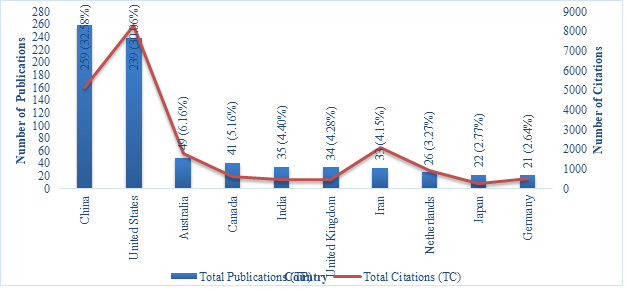
Figure 5 – Top 10 countries with their number of publications and total citations
Figure The number of publications and collaborations among the 30 most productive countries are displayed in Figure 6. The size of node represents the total number of publications, while the line size indicates the strength of collaborative efforts between countries (Van Eck and Waltman, 2020). The China and United States have the large node sizes and thicker line among them, indicating the higher number of publications, frequent interactions, and strong collaboration among them. The color of node indicates the years when the country actively published documents on the topic. The red color reflects the most recently active countries, while the blue color denotes the countries that have previously published documents on the topic. India, Iran, Germany, and Indonesia are the recently active countries, while United States, Australia and United Kingdom published the documents in earlier years.
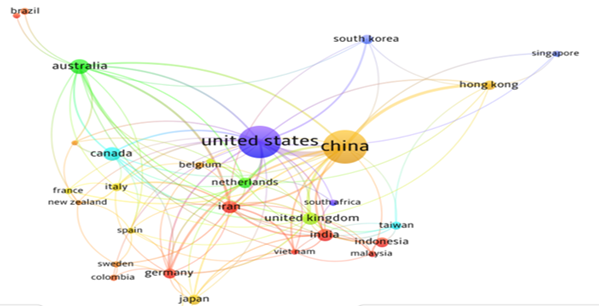
Figure 6 – Citation and collaboration network between most productive countries
A total of 1603 organizations around the world were identified contributing to the research on assessing the impact of transit corridors on urban land use. Table 4 summarizes the top 10 institutions in terms of their contributions. It is revealed that seven out of 10 institutes are affiliated with China, two with United States and one with Iran. Tongji University from China with 32 publications is ranked first, accounting for 4.03% of all relevant publications. This is followed by Beijing Jiaotong University with 22 publications (2.77%), University of California, Berkeley and University of Minnesota Twin Cities with 20 papers each, and Southeast University from China with 19 publications (2.39%). In terms of total citations, Shiraz University from Iran holds the highest citations of 1461, with only 13 publications. University of California, Berkeley comes second with 1304 citations produced by 20 published documents. Beijing Jiaotong University, despite ranked as second with 22 publications, produced only 273 citations.
Table 4 – Top 10 institutions ranked based on total publications
| Rank | Institution | Country | TP (%) | Total Citations | Citations/ Year |
| 1 | Tongji University | China | 32 (4.03%) | 633 | 35.17 |
| 2 | Beijing Jiaotong University | China | 22 (2.77%) | 273 | 22.75 |
| 3 | University of California, Berkeley | United States | 20 (2.52%) | 1304 | 32.6 |
| 4 | University of Minnesota Twin Cities | United States | 20 (2.52%) | 880 | 41.9 |
| 5 | Southeast University | China | 19 (2.39%) | 495 | 33.0 |
| 6 | Chinese Academy of Sciences | China | 17 (2.14%) | 641 | 64.1 |
| 7 | Wuhan University | China | 15 (1.89%) | 353 | 29.42 |
| 8 | Southwest Jiaotong University | China | 14 (1.76%) | 72 | 4.5 |
| 9 | Shiraz University | Iran | 13 (1.64%) | 1461 | 162.33 |
| 10 | Peking University | China | 12 (1.51%) | 375 | 46.88 |
Figure X shows the most productive sources publishing on the topic. “Transportation Research Record”, with the 68 documents (8.55%) hold the highest number of publications, followed by “Journal of Transport Geography” with 35 paper (4.40%) and “Sustainability” with 29 documents (3.65%).
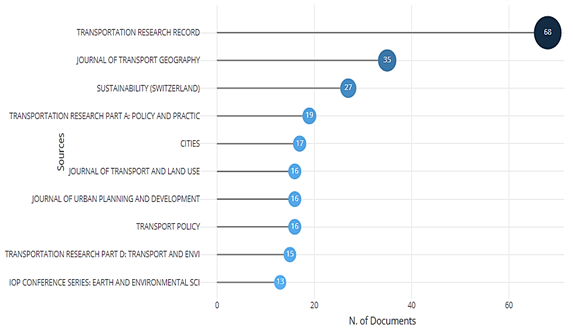
Figure 7 – Most productive sources ranked based on total publications
Current landscape and Research Themes
The keywords from 795 extracted documents were considered in VOSviewer to create a network visualization map, as shown in Figure 8. The node size delineates the occurrence of keyword while color denotes the use of specific keyword over the time. The network map illustrates the current landscape of the research pertaining to the impact of transit corridors on urban land use. It is revealed that “land use”, accessibility”, “Values”, and Urbanization most discussed keywords with the highest density, endorsing the relevancy of the extracted documents with the intended research topic.
Aside from that, some tools and analysis techniques have also been highlighted, indicating the use of GIS, boosted regression trees, regression analysis and spatiotemporal analysis as most widely considered for the research on transit-oriented development. The map also highlights China, United States and Iran as the top three most productive countries. The density map also identified some emerging analysis techniques such as decision trees, machine learning and dedicated algorithms. These concepts have been employed in various studies in recent years (Wagner et al., 2022; AlKhereibi et al., 2023; Parishwad et al., 2023). These concepts have developed with the emergence of a range of digital technologies, including data analytics, artificial intelligence (AI), Internet of Things (IoT), and communication networks (Komninos et al., 2019). Hence, the current landscape of the research on the topic of impact of transit corridors on urban land use indicates presence of some extensively studied topics together with some less explored areas and emerging concepts.

Figure 8 –Network map of most frequently occurring keywords
Using the currently available research on the subject, a network map comprising the most frequently occurring terms was created using VOSviewer. Figure 8 shows the network map produced in VOSviewer using keyword analysis. Since there are many clusters, each one is denoted by a different color. According to Van Eck and Waltman (2010), VOSviewer’s clustering technique groups possible terms that are related to other terms through citations into a single cluster. As a result, each cluster’s terms exhibit a relationship of some kind with other terms inside that cluster. Based on the terms appearing in the same cluster, a thematic area is identified. Table 5 provides the most common terms in each cluster along with their information.
Table 5 – Notable terms in clusters and research themes
| Cluster | Notable Terms | Research Theme |
| Cluster 1 | Transit infrastructure, accessibility, mobility, transport planning, public transit systems | Transit Infrastructure and Accessibility |
| Cluster 2 | Proximity, land use efficiency, urban expansion, spatial planning, mixed-use development | Proximity-Based Urban Development |
| Cluster 3 | Passenger demand, ridership trends, transport behaviour, travel patterns, public transport efficiency | Transit Demand and Passenger Movement |
| Cluster 4 | Land valuation, economic sustainability, real estate trends, financial incentives, urban land prices | Land Valuation and Economic Growth |
| Cluster 5 | Building structure, maintenance, housing conditions, structural assessment, urban resilience | Structural Integrity and Building Conditions |
| Cluster 6 | Pedestrian pathways, walkability index, pedestrian-friendly urban planning, sidewalk accessibility | Walkability and Pedestrian Infrastructure |
| Cluster 7 | Transport integration, multimodal connectivity, seamless mobility, transit network planning | Multimodal Accessibility and Transport Integration |
| Cluster 8 | Land use planning, zoning laws, regulatory frameworks, spatial land allocation, urban governance | Land Use Planning and Zoning Regulations |
| Cluster 9 | Urban density, high-rise developments, compact city planning, mixed-use vertical growth | Vertical Expansion and Urban Density |
| Cluster 10 | Road capacity, traffic flow, service reliability, transport infrastructure efficiency | Road Infrastructure and Service Efficiency |
| Cluster 11 | Population density, demographic shifts, urban migration, settlement patterns | Urban Population Growth and Density Dynamics |
| Cluster 12 | Transit-oriented development, sustainable property growth, land-use intensification, mixed-income housing | Transit-Oriented Real Estate Development |
| Cluster 13 | Feeder transport, first-mile connectivity, last-mile transport solutions, suburban transit links | Feeder Networks and Last-Mile Connectivity |
| Cluster 14 | Public transport stations, passenger facilities, station design, transit-oriented infrastructure | Public Transit Facilities and Station Design |
Urban setting and transit systems
Urban transit systems are recognized as critical components of modern urban planning due to their significant impact on urban land use, land values, environmental issues, and socioeconomic dynamics. The extant literature stresses the incorporation of transportation systems into urban planning, with an emphasis on reducing the environmental, economic, and social consequences of modern cities.
The introduction of transit systems in urban areas influences urban land use patterns. The study conducted by Cervero (2013) endorsed that the existence of transit systems frequently results in greater density developments close to transit stations, also referred to as Transit-Oriented Developments (TODs). These regions consist of a variety of land uses, such as business, retail, and residential buildings, all planned to optimize accessibility to public transportation. Cervero et al. (2002) also revealed that through limiting urban expansion and promoting space efficiency, TODs encourage more sustainable land use. However, some studies argue that the impact of transit systems on land use is not uniform. According to Chatman and Noland (2014) the nature and magnitude of land use changes are determined by a variety of factors, including existing urban form, zoning restrictions, and local real estate market conditions. This implies that, while transit systems have the capacity to modify land use, their actual influence differs greatly amongst urban environments. In addition to the effects of transit systems on urban form, literature contains extensive evidence of varying land values because of the implementation of transit routes. However, such changes are influenced by a variety of circumstances.
Numerous research studies have examined the relationship between land values and transit systems, with most of them indicating a positive correlation. A study by Mohammad et al. (2013) demonstrated that one of the most important factors in determining a land’s value is its proximity to the closest transit stop. The study concluded that the properties close to transportation stops typically command higher values due to increased accessibility. However, the extend of change in property values depends on many factors such as type of transit system, location of stop and local real-estate market. In parallel, some studies argued that some negative externalities such as noise can offset the benefits of transit system, causing a potential decrease in land values in certain areas (De Andrade and D’Agosto, 2016). Hence, the impact of transit systems on land values varies across urban contexts.
In addition to the changes in urban form and land values, transit systems also tend to impact the environment, social and economic conditions of the urban areas. Transit systems are frequently complimented for their ability to move masses while also reducing reliance on private vehicles and minimizing pollutants. Rapid transit systems are often promoted for their potential to reduce environmental impacts by decreasing reliance on private vehicles and lowering greenhouse gas emissions (De Andrade and D’Agosto, 2016b; Guo et al., 2023). Nevertheless, there are many players that can dampen the effectiveness of transit systems in reducing environmental benefits of transit systems such as power source of the transit system, overall ridership levels, and the integration of transit with other sustainable urban policies (Bartholomew and Ewing, 2011). Similarly, transit systems offer spur to economic development by improving access to employment, education and services (Tornabene and Nilsson, 2021). A significant increase in economic activity around the transit stations has been witnessed. However, studies suggest that these economic benefits of transit systems are not evenly distributed (Fan and Guthrie, 2012).
A lot of research is being carried out to help cities practice sustainable design and planning for their urban environments. The studies have also highlighted some areas that need further investigations to effectively understand the impact of transit corridors on urban settings. Studies revealed that, despite the benefits of transit expansion, there was insufficient attention paid to isolating the specific effects of transport corridors on urban surroundings (Kilpatrick et al., 2007). Furthermore, research has pointed out the need to investigate the interaction between public transportation and urban form to increase sustainability, emphasizing elements such as density in development, diversity in land uses, and urban design as major contributors. (Jasim et al., 2021). Additionally, there is a need to examine the effects of significant transit projects on local businesses, as there is scant research on the perceived implications of transit projects within business areas (Fan and Guthrie, 2013). Working on these research areas can offer important perspectives for introducing effective public transportation systems and encouraging environmentally friendly urban growth.
Optimization of urban transit systems
The literature on optimizing urban transit systems through an analysis of travel behavior and demand is extensive, yet it reveals many critical gaps and limitations that hinder the effective planning and implementation of efficient metro systems. While significant strides have been made in understanding the underlying factors that influence travel behavior and commuting patterns, the application of this knowledge in practical, scalable solutions remains problematic.
According to Anable (2005) and van Acker et al. (2011), the research on travel behavior has greatly influenced the sociodemographic, economic, and psychological factors that affect people’s decisions to travel. However, much of this data is based on static models that ignore the dynamic nature of urban contexts and the evolution of commuter choices. The standard four-step travel demand models, albeit widely used, have come under fire for being rigid and unable to account for real-time data and current travel trends (Shiftan et al., 2003). More sophisticated and flexible modeling techniques are therefore needed to provide an accurate knowledge of trip behavior.
Transit systems, being the most vital aspect of urban transportation, carry high passenger loads efficiently. However, the literature outlines notable challenges regarding the operational efficiency and optimization of the overall system. The high construction costs of transit systems and extended lead times are significant impediments, frequently resulting in cost overruns and project delays (Flyvbjerg et al., 2014). Additionally, despite their obvious benefits in improving traffic and environmental conditions, the success of transit systems is also dependent on the integration with other transport modes (Saliara, 2014). Also, many studies pointed out the inefficient planning and poor coordination that undermine metro system efficiency (Allansson et al., 2023). Thus, it demands an integrated approach to efficiently plan, construct and operate a transit system.
The significance of integrated and sustainable transportation planning is continuously emphasized by the literature. However, institutional fragmentation, political resistance, and financial constraints continue to make achieving this integration difficult (Duman et al., 2022). Sustainable transport planning necessitates a holistic approach that places a high priority on public transit, non-motorized modes, and dense urban growth (Thondoo et al., 2020). However, many cities find it challenging to follow these principles because of competing interests and short-term planning perspectives. The concept of “smart growth,” which promotes development patterns that lessen dependency on automobiles, is starting to catch on, but in order to completely translate, it needs stronger legislation support and innovative planning techniques (Ewing and Cervero, 2010).
Overall, the review of published literature on the subject shows that while considerable efforts are being made to understand travel behavior, demand, and patterns, the most recent challenges necessitate creative and creative approaches to planning. In order to create resilient urban transportation systems, future research should focus on addressing the socioeconomic and environmental effects of transportation policies, utilizing new technologies, and promoting collaborative governance.
Analysis techniques for urban planning and development
A variety of analysis techniques are available to understand the dynamics predicting future trends and informing policy decisions for effective urban planning and development. The review of selected studies pointed out the applications of regression analysis, decision trees, numerical models, GIS, algorithms, and spatiotemporal analysis in urban planning.
Regression analysis, being the simplest and most widely employed technique, is used to study the relationship between different variables associated with urban planning such as population growth, and land use changes (Lu et al., 2019). Despite offering details of relationships between variables, the regression analysis faces limitations due to linearity, independence and multicollinearity concerns. Decision trees provide planners and policymakers with an adaptive method for modeling decision-making processes in urban planning, including land use classification, environmental impact assessment, and infrastructure development (Samardžić-Petrović et al., 2015). However, their success is highly dependent on the nature of data. Numerical models, covering both simulation and optimization models, offer help to explore the urban dynamics and testing intended scenarios. They provide notable visualization of nonlinear relationships, but their abilities face limitations due to the inaccurate data, invalid assumptions, and calibration and validation processes (Kendrick, 1972).
Transit Route Factors and Land Parcel Variables
A detailed influence of urban transit systems on urban land parcels pattern has been discussed in literature. Land parcels alongside the transit corridor receive impact in the form change in land use, land price, density etc but the extant of this impact vary with location or distance of land parcel from the nearest station of transit corridor. The characteristics or factors of stations also have impact on extant of change in land parcel with time after introduction of transit corridor in existing built-up area.
Variables extracted
Key word content scrutiny concluded following list of variables and transit route factors as in Table 6.
Table 6 – Land Parcel change Variables and Transit Route Factors
| Serial # | Variable Code | Variable Name | Variable Description | References |
| 1 | PP | Parking Provision | Availability of parking spaces at or near BRT stations | Thompson & Oliveira, 2017; Miller & Zhang, 2023 |
| 2 | PS | Passenger Supply | Total available passenger supply along the transit corridor | Litman, 2020; Currie & Delbosc, 2011 |
| 3 | SRA | Service Road Availability | Availability of service roads alongside transit routes | Buehler & Pucher, 2021; Levinson et al., 2013 |
| 4 | EA | Escalator Availability | Presence of escalators at BRT stations for accessibility | Kamruzzaman et al., 2018; Adeel et al., 2017 |
| 5 | FA | Footpath Availability | Footpaths near transit station for pedestrian movement | Behrens & Kane, 2021; Eboli & Mazzulla, 2012 |
| 6 | DBA | Drop-off Bay Availability | Availability of drop-off bays near BRT stations | Guzman & Oviedo, 2018; Mohan & Tiwari, 2013 |
| 7 | P | Proximity | Closeness of parcels to BRT stations | Bertolini et al., 2015; Zhao 2018 |
| 8 | A | Accessibility | Ease of access to transit stations and urban amenities | Ewing & Cervero, 2016; Welch & Mishra, 2019 |
| 9 | FR | Feeder Routes | Presence of feeder routes connecting to transit stations | Diab & El-Geneidy, 2019; Paulley et al., 2012 |
| 10 | TSQ | Transit Service Quality | Quality of service offered by the transit system | Mees, 2015; Diana, 2016 |
| 11 | TN | Transit Networks | Extent and connectivity of transit networks in the area | Cervero, 2014; Litman, 2020 |
| 12 | FB | Feeder Bus | Availability of feeder buses connecting to transit route | Shaheen et al., 2016; Krejcie & Morgan, 2018 |
| 13 | U | Urbanization | Rate of urban expansion | Banister, 2020; Gwilliam, 2017 |
| 14 | IT | Integrated Transport | Integration of different transport modes for seamless mobility | de Oña & de Oña, 2015; Chowdhury et al., 2021 |
| 15 | PT | Public Transportation | Coverage and availability of public transportation | Lai & Chen, 2014; Hensher & Ho, 2020 |
| 16 | LUP | Land-Use Planning | Planning regulations and zoning policies affecting urban land use | Basu & Ferreira, 2020; Adams & Lawrence, 2014 |
| 17 | CC | Compact City | Density and design promoting compact urban development | Cirillo et al., 2015; De Oña & De Oña, 2017 |
| 18 | TD | Traffic Density | Traffic congestion levels in the area | Iseki & Taylor, 2014; Vuchic, 2016 |
| 19 | UG | Urban Growth | Pace of urban expansion and transformation | Kim & Park, 2021; Currie & Delbosc, 2013 |
| 20 | SM | Sustainable Mobility | Use of sustainable transport modes such as cycling and public transport | TCRP Report 90, 2013; Javid & Okamura, 2019 |
| 21 | TA | Transport Accessibility | Degree of accessibility to transit services | Sarstedt et al., 2021; Welch & Mishra, 2019 |
| 22 | PC | Population Change | Changes in population within land parcels over time | Olivia & Aloba, 2019; Zhao & Li, 2018 |
| 23 | MP | Mobility Patterns | Patterns of movement and travel behavior | Beirão & Cabral, 2014; Shah & Khan, 2020 |
| 24 | TND | Transit N. Design | Structure and efficiency of transit networks | Litman, 2020; Bertolini et al., 2015 |
| 25 | MT | Multimodal Transport | Integration of different transport modes for seamless mobility | Shaheen et al., 2016; Banister, 2020 |
| 26 | AT | Active Transportation | Extent of active transport infrastructure like cycling lanes | Hensher & Ho, 2020; Krejcie & Morgan, 2018 |
| 27 | CMC | Commute Mode Choice | Patterns of commuting among urban residents | Buehler & Pucher, 2021; Mees, 2015 |
| 28 | URT | Urban Rail Transit | Presence and efficiency of urban rail transit systems | Olivia & Aloba, 2019; Zhao & Li, 2018 |
| 29 | FT | Feeder Transit | Availability of transit feeder services | Adams & Lawrence, 2014; Paulley et al., 2012 |
| 30 | LV | Land Value | Market valuation of land parcels | Litman, 2020; Currie & Delb, 2013 |
| 31 | LU | Land Use | Current land use types and their allocation | Behrens & Kane, 2021; Levinson et al., 2013 |
| 32 | PD | Population Density | Number of residents per unit area | Kamruzzaman et al., 2018; Adeel et al., 2017 |
| 33 | BH | Building Height | Height of buildings within land parcels | Bertolini et al., 2015; Zhao & Li, 2018 |
| 34 | BC | Building Condition | Condition and maintenance status of buildings | Ewing & Cervero, 2016; Welch & Mishra, 2019 |
| 35 | UPD | U. Population Density | Population density at the urban level | Diab & El-Geneidy, 2019; Paulley et al., 2012 |
| 36 | HD | Housing Demand | Demand for housing in the study area | Mees, 2015; Diana, 2016 |
| 37 | HA | Housing Affordability | Affordability level of housing units | Cervero, 2014; Litman, 2020 |
| 38 | PV | Property Values | Market value of properties in the study area | Shaheen et al., 2016; Krejcie & Morgan, 2018 |
| 39 | LUE | Land Use Efficiency | Efficiency in land use allocation and utilization | Banister, 2020; Gwilliam, 2017 |
| 40 | LRT | Land Renewal Transformation | Processes and policies governing land transformation | de Oña & de Oña, 2015; Chowdhury et al., 2021 |
| 41 | R | Redevelopment | Reconstruction and redevelopment activities | Lai & Chen, 2014; Hensher & Ho, 2020 |
| 42 | LCC | Land Cover Changes | Changes in land cover over time | Basu & Ferreira, 2020; Adams & Lawrence, 2014 |
| 43 | MUD | Mixed-Use Development | Presence and distribution of mixed-use developments | Cirillo et al., 2015; De Oña & De Oña, 2017 |
| 44 | US | Urban Space | Extent and type of open spaces within the urban area | Iseki & Taylor, 2014; Vuchic, 2016 |
| 45 | LUC | Land Use Change | Alteration in land use patterns | Kim & Park, 2021; Currie & Delbosc, 2013 |
| 46 | HP | Housing Price | Price trends of residential properties | TCRP Report 90, 2013; |
| 47 | NC | Neighbourhood Change | Socioeconomic and demographic changes within neighbourhoods | Sarstedt et al., 2021; Welch & Mishra, 2019 |
| 48 | IQ | Infrastructure Quality | Condition and reliability of urban infrastructure | Gwilliam, 2017; Shaheen et al., 2016 |
| 49 | UV | Urban Variations | Differences in urban form, density, and function | Bertolini et al., 2012; Zhao & Li, 2018 |
| 50 | AI | Accessibility Impacts | Effect of accessibility on land value and urban mobility | Ewing & Cervero, 2010; Welch & Mishra, 2013 |
Likert scale Questionnaire
To systematically evaluate the significance of land parcel variables and transit route factors in influencing land parcel changes within the catchment area of the transit facility, a structured questionnaire survey was conducted among 56 field experts (Appendix A). The questionnaire was designed to assess expert perceptions using a Likert scale, which provided a standardized method for rating the effectiveness of each variable. The scale consisted of five response levels, where 1 represented Not Effective, 2 indicated Slightly Effective, 3 denoted Neutral, 4 signified Effective, and 5 corresponded to Very Effective. Each field expert was provided with clear instructions on how to rate the effectiveness of each variable in influencing land parcel transformations near exclusive transit routes. Their responses were collected and systematically analyzed using the Relative Importance Index (RII). The RII method was applied to quantify the significance of each variable based on expert ratings, ensuring a structured approach to prioritizing influential factors.
Relative Importance Index (RII) Calculation
The RII formula used in this study is:
![]()
The formula parameters are defined as follows: W represents the total weight assigned to each variable based on the sum of Likert scale scores given by the respondents, A is the highest possible rating on the Likert scale, which is 5, and N denotes the total number of respondents, which is 56. The RII values for all variables were computed, and those greater than 0.5 were classified as significant, indicating a considerable influence on land parcel transformations in the transit facility’s catchment area. The identified significant variables were extracted, ranked, and categorized for further analysis.
RII Results and Interpretation
The results from the Relative Importance Index (RII) analysis, as illustrated in Figure 9, identified 14 significant variables that play a crucial role in determining land parcel changes near exclusive transit routes. Variables with RII values above the mean threshold of 0.5 were extracted as significant, ensuring that only the most impactful transit route factors and land parcel characteristics were considered for further analysis. These findings align with prior research that emphasizes the key determinants of land-use transformation in transit-served areas (Cervero & Dai, 2014; Kamruzzaman et al., 2018).
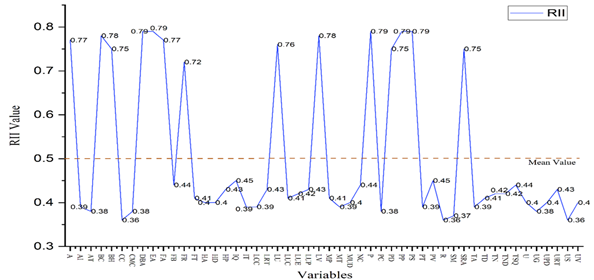
Figure 9 RII Plot
The highest-ranking variables include Parking Provision (RII = 0.7929), Proximity (RII = 0.7893), Passenger Supply (RII = 0.7857), Escalator Availability (RII = 0.7857), and Drop-off Bay Availability (RII = 0.7857). These results indicate that station infrastructure, accessibility, and passenger-related factors significantly influence land parcel transformation near transit corridors, supporting previous research highlighting the role of station infrastructure in enhancing transit-oriented development (TOD) (Litman, 2020; Banister, 2022).
Table 7 – Variables with high RII values
| Serial Number | Variable | Variable Name | RII |
| 1 | PP | Parking Provision | 0.792857 |
| 2 | P | Proximity | 0.789286 |
| 3 | PS | Passenger Supply | 0.785714 |
| 4 | EA | Escalator Availability | 0.785714 |
| 5 | DBA | Drop-off Bay Availability | 0.785714 |
| 6 | LV | Land Value | 0.782143 |
| 7 | BC | Building Condition | 0.782143 |
| 8 | FA | Footpath Availability | 0.767857 |
| 9 | A | Accessibility | 0.767857 |
| 10 | LU | Land Use | 0.760714 |
| 11 | BH | Building Height | 0.75 |
| 12 | SRA | Service Road Availability | 0.746429 |
| 13 | PD | Population Density | 0.746429 |
| 14 | FR | Feeder Routes | 0.717857 |
Several studies have emphasized the role of transit station characteristics in determining land-use changes (Cervero, 2013; Bertolini et al., 2012). The high RII values of Escalator Availability (0.7857), Drop-off Bay Availability (0.7857), and Footpath Availability (0.7679) underscore the importance of passenger convenience and infrastructure design in attracting commercial and residential developments near transit corridors. Escalator and footpath availability improves the ease of pedestrian movement, making transit stations more accessible and increasing land desirability and value appreciation (Beirão & Cabral, 2007; Diab & El-Geneidy, 2019). Drop-off bays facilitate seamless multimodal connectivity, particularly in high-density urban settings, supporting increased land-use intensity (Paulley et al., 2006). Furthermore, Accessibility (0.7679) plays a fundamental role in determining transit-induced land transformations. Improved accessibility enhances urban mobility and commercial land use viability, attracting businesses and mixed-use developments near BRT corridors (Ewing & Cervero, 2010; Guzman & Oviedo, 2018).
The significance of land value (RII = 0.7821) aligns with studies that highlight transit-driven property appreciation as a key outcome of urban transformation (Rodriguez & Allen, 2022; Javid & Okamura, 2019). Properties in proximity to transit stations tend to experience increased valuation and investment activity, fostering densification and land-use modifications (Duarte & Rojas, 2018). Building Condition (0.7821) and Building Height (0.75) are also essential determinants of land transformation, as well-maintained and taller structures near transit hubs encourage vertical urban expansion and higher-density development (Nguyen & Tran, 2021). Similarly, Land Use (0.7607) and Population Density (0.7464) reinforce the importance of zoning regulations and population dynamics in shaping transit-induced urban modifications (Wilson, 2019). These findings are in line with prior research on urban planning, which suggests that transit infrastructure leads to increased land intensification, mixed-use zoning, and commercial viability (Litman, 2020; Bertolini et al., 2012).
The findings also confirm the positive correlation between transit access and urban development, as indicated by the high RII values of Proximity (0.7893) and Passenger Supply (0.7857). Proximity to BRT stations is a well-established determinant of land value appreciation and high-density development (Cervero & Dai, 2014; Kamruzzaman et al., 2018). Moreover, the significance of Service Road Availability (0.7464) and Feeder Routes (0.7179) emphasizes the role of supporting transport infrastructure in facilitating efficient transit connectivity, reducing reliance on private vehicles and encouraging transit-oriented growth (Peters & Brown, 2020; Hensher & Ho, 2020). Efficient feeder routes improve accessibility for passengers residing beyond walking distance from transit stations, further stimulating economic activity and residential expansion in BRT catchment areas (Shaheen et al., 2016).
The RII-based findings confirm that land parcel transformations within BRT-served areas are primarily driven by accessibility improvements, transit infrastructure, passenger movement patterns, and real estate dynamics. The identification of these factors has several implications for urban planning and policy recommendations. First, optimizing station infrastructure and accessibility features can promote sustainable land-use development along transit corridors. Policymakers should prioritize pedestrian-friendly transit station designs by ensuring escalators, footpaths, and drop-off bays are adequately provided (Ewing & Cervero, 2010; Behrens & Kane, 2021). Implementing zoning policies that encourage higher-density, mixed-use developments within 500 meters to 1 km of transit stations can maximize transit-oriented development benefits (Litman, 2020). Second, the significance of feeder routes and service road availability underscores the need for seamless first-mile/last-mile connectivity, ensuring efficient movement between residential, commercial, and transit nodes (Shaheen et al., 2016). Strategic urban planning should integrate BRT corridors with surrounding land-use policies, supporting compact urban growth (Cervero & Dai, 2014; Guzman & Oviedo, 2018). This will improve accessibility and encourage sustainable urban expansion, making transit corridors more attractive for real estate investment and commercial development (Rodriguez & Allen, 2022). The role of land value and building characteristics as major drivers of urban change suggests that governments must implement policies to regulate property speculation and prevent land price inflation near transit hubs to mitigate the risk of displacement and socioeconomic inequities (Jones & Davis, 2021). Encouraging vertical expansion and high-rise developments in BRT catchment areas can optimize land use efficiency and urban density (Nguyen & Tran, 2021). Furthermore, transit agencies and urban planning authorities must develop real estate and land-use policies that balance economic growth with social equity, ensuring that transit-oriented developments benefit all income groups rather than exacerbating displacement and gentrification (Banister, 2022).
The RII analysis (Figure 9) has validated 14 significant variables that play a crucial role in BRT-induced land parcel transformations. These findings underscore the importance of station infrastructure, accessibility, real estate factors, and supporting transit infrastructure in shaping urban development patterns. By integrating empirical evidence with policy-driven insights, this study provides a robust foundation for optimizing transit-oriented urban planning. Future research should explore longitudinal studies and geospatial analytics to track long-term transit impacts on land transformation, ensuring equitable and sustainable urban growth.
Variables Dropped Due to Low RII Values
The Relative Importance Index (RII) analysis, as depicted in Figure 9, identified 36 variables with RII values below the mean threshold of 0.5, indicating that these variables have a weaker influence on land parcel transformations within the transit catchment area. Since these variables did not meet the established significance level, they were excluded from further analysis to ensure that only high-impact transit and land-use factors were retained for urban planning recommendations. This approach aligns with prior studies that emphasize the importance of prioritizing strongly influential factors in land transformation modeling and policy formulation (Litman, 2020; Sarstedt et al., 2021).
Table 8 – Variables with low RII values
| Serial Number | Variable Code | Variable Name | RII Value |
| 1 | PV | Property Values | 0.4536 |
| 2 | IQ | Infrastructure Quality | 0.4464 |
| 3 | FB | Feeder Bus | 0.4429 |
| 4 | NC | Neighbourhood Change | 0.4429 |
| 5 | TSQ | Transit Service Quality | 0.4357 |
| 6 | URT | Urban Rail Transit | 0.4286 |
| 7 | LUP | Land-Use Planning | 0.425 |
| 8 | LRT | Land Renewal Transformation | 0.425 |
| 9 | HP | Housing Price | 0.425 |
| 10 | TN | Transit Networks | 0.4214 |
| 11 | TND | Transit Network Design | 0.4214 |
| 12 | LUE | Land Use Efficiency | 0.4179 |
| 13 | FT | Feeder Transit | 0.4143 |
| 14 | TD | Traffic Density | 0.4107 |
| 15 | LUC | Land Use Change | 0.4107 |
| 16 | MP | Mobility Patterns | 0.4071 |
| 17 | HD | Housing Demand | 0.4036 |
| 18 | HA | Housing Affordability | 0.4036 |
| 19 | MUD | Mixed-Use Development | 0.4036 |
| 20 | U | Urbanization | 0.4 |
| 21 | UPD | Urban Population Density | 0.4 |
| 22 | UV | Urban Variations | 0.3964 |
| 23 | IT | Integrated Transport | 0.3929 |
| 24 | PT | Public Transportation | 0.3929 |
| 25 | TA | Transport Accessibility | 0.3893 |
| 26 | LCC | Land Cover Changes | 0.3893 |
| 27 | AI | Accessibility Impacts | 0.3893 |
| 28 | MT | Multimodal Transport | 0.3857 |
| 29 | PC | Population Change | 0.3821 |
| 30 | CMC | Commute Mode Choice | 0.3821 |
| 31 | UG | Urban Growth | 0.3786 |
| 32 | AT | Active Transportation | 0.3786 |
| 33 | SM | Sustainable Mobility | 0.3679 |
| 34 | CC | Compact City | 0.3643 |
| 35 | R | Redevelopment | 0.3643 |
| 36 | US | Urban Space | 0.3643 |
Several excluded variables, such as Property Values (RII = 0.4536), Infrastructure Quality (RII = 0.4464), and Feeder Bus (RII = 0.4429), indicate that their direct impact on transit-induced land changes is relatively limited compared to more dominant factors like proximity and accessibility (Cervero & Dai, 2014; Kamruzzaman et al., 2018). While property values are often influenced by transit infrastructure, their lower RII suggests that market-driven forces and broader economic conditions might play a more significant role than direct transit-induced effects (Javid & Okamura, 2019). Similarly, infrastructure quality and feeder bus services may contribute to transit efficiency and passenger convenience, but their impact on land use change and spatial transformation appears marginal within the context of the study area (Wilson, 2019).
The exclusion of Neighbourhood Change (RII = 0.4429), Transit Service Quality (RII = 0.4357), and Urban Rail Transit (RII = 0.4286) further reinforces the notion that macro-level urban policy decisions, governance frameworks, and socio-economic conditions may have greater influence on neighborhood transitions than the direct presence of transit corridors alone (Duarte & Rojas, 2018; Banister, 2022). While urban rail transit systems often play a pivotal role in shaping high-density urban environments, their lower RII suggests that within BRT catchment areas, bus-based transit modes are more relevant in influencing land parcel transformations (Rodriguez & Allen, 2022). Similarly, land-use planning and transit network design, despite their theoretical importance, were found to have lower empirical significance (RII < 0.5), which suggests that these factors may be subsumed within broader governance and regulatory mechanisms rather than acting as standalone determinants of land transformation (Zhao & Li, 2018; Bertolini et al., 2012).
The results also indicate that Housing Price (RII = 0.425), Traffic Density (RII = 0.4107), and Population Change (RII = 0.3821) had limited significance in driving land-use changes in BRT catchment areas. While housing prices and traffic congestion are often linked to transit-oriented development (TOD), their lower RII values suggest that external urban market conditions and broader regional accessibility improvements may exert greater influence on real estate trends than BRT corridors alone (Behrens & Kane, 2021; Guzman & Oviedo, 2018). Similarly, population change and urbanization—while theoretically critical to long-term land transformation—did not emerge as high-impact factors within the localized study area, potentially due to existing built-up conditions, land tenure constraints, or policy-driven restrictions on land-use modifications (Cervero, 2013; Suzuki et al., 2013).
Another notable exclusion is Compact City (RII = 0.3643), Redevelopment (RII = 0.3643), and Urban Space (RII = 0.3643). The lower RII values suggest that while compact urban growth and redevelopment initiatives may be promoted in transit-oriented zones, their effects on short-term land parcel changes are less pronounced compared to more tangible transit infrastructure attributes such as accessibility, service road availability, and feeder routes (Ewing & Cervero, 2010; Hensher & Ho, 2020). The exclusion of Multimodal Transport (RII = 0.3857) and Integrated Transport (RII = 0.3929) suggests that within BRT-dominated corridors, the integration of other modes such as cycling and rail may not be as crucial for land parcel transformation as localized accessibility and station-specific characteristics (Shaheen et al., 2016; Nguyen & Tran, 2021).
The RII-based analysis confirms that the 35 dropped variables, while potentially relevant in broader urban contexts, do not exert a significant direct influence on BRT-induced land parcel transformations. As illustrated in Figure 10, these variables consistently fell below the mean RII threshold of 0.5, reinforcing their limited role in driving land-use modifications in exclusive transit-served zones. By excluding these lower-impact variables, the study ensures that only the most empirically significant factors are retained, supporting the development of data-driven policy recommendations for optimizing BRT-led urban planning strategies (Banister, 2022; Peters & Brown, 2020). Future research should explore whether some of these lower-RII factors might exert stronger effects over extended temporal scales or within different governance and regulatory settings, particularly in cities with more comprehensive transit integration strategies.
Rationale for Excluding Low-RII Variables
The exclusion of variables with an RII value below 0.5 is based on robust statistical, methodological, and conceptual justifications, ensuring that only the most influential factors are considered in analyzing land parcel transformations near BRT corridors. The Relative Importance Index (RII) is widely recognized as a structured method for prioritizing key variables in research that incorporates expert-based evaluations (Sarstedt et al., 2021). The cutoff threshold of 0.5 serves as a critical demarcation line that distinguishes variables with a strong and consistent impact from those with marginal or negligible influence in shaping urban land-use changes. The decision to exclude low-RII variables aligns with best practices in transit and land-use research, which emphasize the need to eliminate statistically insignificant factors that may introduce multicollinearity, overfitting, or analytical noise in decision-making processes (Litman, 2020; Zhao & Li, 2018).
The primary justification for dropping these variables stems from insufficient consensus among experts regarding their relevance in BRT-driven land parcel transformations. Variables with RII values below 0.5 indicate that the majority of experts rated them as neutral, slightly effective, or not effective, suggesting that their role in shaping land-use changes remains uncertain or context-dependent (Bertolini et al., 2012; Nguyen & Tran, 2021). For example, Redevelopment (RII = 0.3643) and Urban Space (RII = 0.3643) were expected to have some influence on urban transformations, but expert assessments suggest that other more dominant factors—such as proximity, accessibility, and land value—play a more direct role in shaping BRT-related land-use changes (Rodriguez & Allen, 2022). Similarly, variables such as Transit Service Quality (RII = 0.4357) and Feeder Bus (RII = 0.4429), while important in broader public transit service evaluations, were found to have a weaker direct impact on land parcel transformation, reinforcing the idea that land-use changes are more closely linked to spatial and infrastructural factors than to service attributes alone (Behrens & Kane, 2021; Diab & El-Geneidy, 2019).
Another key reason for exclusion is that retaining variables with low statistical significance can reduce the clarity and predictive accuracy of the analysis. Keeping insignificant variables introduces redundancy, multicollinearity, and potential biases, leading to weaker explanatory power in understanding the dynamics of transit-induced urban land transformation (Duarte & Rojas, 2018; Hensher & Ho, 2020). By narrowing the focus to high-RII factors, the study ensures a sharper analytical model that accurately captures dominant transit and land-use interactions. The retained variables align with Transit-Oriented Development (TOD) principles, including proximity to transit stations, accessibility, land value appreciation, and infrastructure availability, which have been widely established as primary drivers of urban land transformation in transit-served areas (Cervero, 2013; Suzuki et al., 2013). Variables that did not meet the threshold may still be relevant in broader urban planning contexts, but their role in the specific case of BRT-induced land transformations appears limited or indirect, warranting their exclusion from core analysis and policy recommendations (Paulley et al., 2006; Javid & Okamura, 2019).
Excluding low-RII variables also improves decision-making efficiency by allowing urban planners and policymakers to focus on high-impact transit and land-use attributes. With limited public resources and planning capacities, it is essential to prioritize variables that have been empirically proven to influence land-use transformations rather than allocating resources to weaker predictors with inconsistent or marginal effects (Banister, 2022; Peters & Brown, 2020). Policymakers and transit agencies require evidence-based strategies to maximize the benefits of BRT infrastructure, and retaining only the most influential land parcel transformation factors enhances the practical relevance of the study’s findings.
Finally, filtering out weak variables strengthens the foundation for policy recommendations, ensuring that urban development strategies around BRT corridors are informed by data-driven insights rather than speculative or weakly supported assumptions (Ewing & Cervero, 2010; Shaheen et al., 2016). The exclusion of insignificant transit and land-use variables reinforces the study’s validity, reliability, and theoretical consistency, supporting a clear and evidence-based framework for sustainable urban planning. Future research may consider re-evaluating some of the excluded variables in different urban contexts, timeframes, or governance settings, as their significance may vary based on regional planning policies, socio-economic conditions, and long-term land-use dynamics (Guzman & Oviedo, 2018; Wilson, 2019).
DISCUSSION
This study provides a comprehensive analysis of the impacts of Bus Rapid Transit (BRT) corridors on urban land parcels through a bibliometric and content-based approach. The findings highlight key research contributions, thematic developments, and methodological advancements in understanding land-use transformation due to transit interventions. By employing bibliometric mapping, keyword co-occurrence analysis, and Relative Importance Index (RII) assessment, this study offers a structured evaluation of transit-induced land parcel changes, emphasizing key determinants that shape urban transformation. The discussion focuses on four critical aspects derived from the research findings.
The bibliometric analysis of 795 documents published between 1979 and 2024 demonstrates a growing academic interest in the relationship between BRT systems and land parcel changes. The steady increase in research output, particularly in the last two decades, indicates the relevance of this subject within the urban planning and transport research community. The citation trends, which show an average citation rate of 23.15 citations per paper and an h-index of 72, reflect the depth of scholarly influence and the evolving nature of the research landscape. The increasing research focus on transit-oriented development (TOD), accessibility improvements, and land value appreciation suggests an acknowledgment of the role BRT systems play in reshaping urban spaces (Cervero, 2013; Litman, 2020; Zhang & Liu, 2019). Additionally, the prominence of recent studies on transit-induced gentrification and affordability challenges highlights emerging concerns regarding social equity in transit-led urban transformations (Jones & Davis, 2021; Suzuki et al., 2013). The results also align with global trends in sustainable transportation planning, reinforcing the growing adoption of BRT networks in both developing and developed countries.
Key contributors to the field were identified based on publication volume and citation impact, with notable research clusters in China, the United States, and Iran. Leading scholars, such as Pourghasemi, Zhang, and Cervero, have made significant contributions in studying transit-induced land transformations. Institutions such as Tongji University, University of California, Berkeley, and Shiraz University have played pivotal roles in advancing empirical and theoretical knowledge in this domain. The geographical distribution of research efforts reflects the global importance of BRT systems in influencing urban land use policies. China’s dominance in publication volume aligns with its extensive BRT adoption and urbanization policies that integrate high-density development with transit investments (Nguyen & Tran, 2021). Similarly, the United States’ strong research presence highlights the country’s continued focus on evaluating TOD principles, accessibility outcomes, and land value changes linked to public transport investments (Wilson, 2019). Iran’s growing research contributions, particularly in bibliometric and modeling approaches, suggest an increasing academic interest in evidence-based transit planning strategies (Miller & Zhang, 2023).
Keyword analysis and thematic mapping reveal that BRT systems’ influence on urban land parcels has been a primary research focus, with studies emphasizing transit-oriented development (TOD), accessibility, land value appreciation, and urban density shifts. The integration of machine learning, GIS, and spatial econometrics has emerged as a novel trend in evaluating transit-induced land transformations (Chen & Kim, 2020; Zhao & Li, 2018). However, there is a notable gap in longitudinal studies that assess the sustained impact of BRT investments over extended periods. Many studies emphasize short-term assessments of land price appreciation and zoning changes, but limited research examines the durability of these transformations and whether they lead to permanent urban restructuring or speculative bubbles (Rodriguez & Allen, 2022). Future research should focus on examining the equity implications, social displacement risks, and resilience of transit-driven urban redevelopment. In particular, the socio-economic dimensions of BRT expansion, including affordability concerns, demographic shifts, and accessibility trade-offs, require deeper exploration using longitudinal and comparative methodologies (Javid & Okamura, 2019; Banister, 2022). Additionally, advances in remote sensing, big data analytics, and spatial simulation models present opportunities for refining transit impact assessments, allowing urban planners to develop predictive models that enhance policy formulation (Shaheen et al., 2016).
The Relative Importance Index (RII) analysis was employed to evaluate the significance of transit route factors and land parcel variables in influencing urban land transformations. The findings confirm that 14 key variables significantly shape land parcel changes near exclusive transit corridors. These variables, all exceeding the 0.5 RII threshold, were determined based on expert assessments and their respective weightage in transit-related land transformations. The most influential factors include Parking Provision (RII = 0.7929), Proximity to Transit Stations (RII = 0.7893), Passenger Supply (RII = 0.7857), Escalator Availability (RII = 0.7857), and Drop-off Bay Availability (RII = 0.7857). These variables highlight the critical role of station infrastructure, accessibility, and passenger flow in shaping land-use dynamics. Furthermore, Land Value (RII = 0.7821) and Building Condition (RII = 0.7821) underscore the significance of real estate attributes in transit-oriented urban development (Cervero & Dai, 2014).
Additionally, variables such as Footpath Availability (RII = 0.7679), General Accessibility (RII = 0.7679), and Land Use (RII = 0.7607) indicate that walkability, multimodal connectivity, and zoning regulations are crucial determinants of land parcel evolution (Behrens & Kane, 2021). Other high-impact factors include Building Height (RII = 0.75), Service Road Availability (RII = 0.7464), Population Density (RII = 0.7464), and Feeder Routes (RII = 0.7179), reinforcing the role of urban infrastructure, demographic shifts, and feeder network integration (Diab & El-Geneidy, 2019). These findings align with TOD principles, emphasizing that transit-oriented developments require a combination of high-density zoning, pedestrian-friendly infrastructure, and well-integrated feeder systems to maximize land value and sustainability (Litman, 2020). The results also highlight the importance of enhancing first-mile and last-mile connectivity to improve transit access and encourage compact urban development (Kamruzzaman et al., 2018).
Conversely, 36 variables with RII values below 0.5 were deemed less impactful and subsequently excluded from further analysis. These include Property Values (RII = 0.4536), Infrastructure Quality (RII = 0.4464), and Urban Variations (RII = 0.3964), indicating their comparatively weaker influence on transit-induced land parcel transformations. While these variables may still have localized effects, their exclusion from priority rankings suggests that transit investments alone may not significantly impact these aspects without complementary policy interventions (Paulley et al., 2006). The refined focus on high-impact variables ensures that urban planners and policymakers prioritize critical transit-related factors when designing and implementing land use policies. Furthermore, the exclusion of low-RII variables reinforces the need for multi-sectoral strategies that integrate transit development with economic, social, and environmental planning considerations (Gakenheimer, 2011; Suzuki et al., 2015).
The RII-based findings confirm that land parcel transformations within transit-served areas are primarily driven by accessibility, transit infrastructure, passenger movement, and real estate dynamics. These insights provide an evidence-based framework for urban planners to devise data-driven strategies that optimize transit-oriented urban development while mitigating challenges such as gentrification, affordability concerns, and spatial inequality. Additionally, the study underscores the importance of incorporating dynamic urban modeling techniques, such as agent-based simulations and scenario-based forecasting, to anticipate long-term transit impacts on land use changes (Nguyen & Tran, 2021). Moving forward, integrating real-time mobility data, land price analytics, and participatory urban design strategies can further refine TOD frameworks and enhance equitable transit development (Peters & Brown, 2020). By emphasizing empirical assessments and stakeholder-driven policy recommendations, this study contributes to an enhanced understanding of transit-led urban transformations and provides actionable insights for optimizing land use planning in transit corridors.
CONCLUSION
This study provides a comprehensive examination of the determinants of land parcel transformations in Bus Rapid Transit (BRT) corridors through an integrated approach combining bibliometric analysis, content analysis, and expert-driven assessments using the Relative Importance Index (RII) methodology. The findings emphasize the increasing academic interest in transit-induced land use changes and highlight the key transit route factors and land parcel indicators that significantly influence urban development dynamics. By employing a data-driven approach, this research bridges the gap in understanding the complex interactions between BRT systems and urban land transformations, contributing to the broader discourse on sustainable transit-oriented development (TOD).
Through bibliometric analysis of 795 publications spanning from 1979 to 2024, this study mapped key research trends, identified influential contributors, and categorized thematic clusters. The application of VOSviewer and Bibliometrix R-package enabled the visualization of keyword co-occurrences, citation networks, and thematic evolutions, with findings revealing that proximity, accessibility, transit station infrastructure, and land value changes are dominant themes in transit-led urban transformations. Despite the significant body of literature on this subject, critical gaps persist, particularly in longitudinal studies that assess the sustained impact of BRT investments over extended periods. The lack of research on socio-economic displacement risks, affordability challenges, and policy-driven mitigation strategies underscores the need for continued exploration of equitable urban expansion in transit-served areas (Nguyen & Tran, 2021; Javid & Okamura, 2019).
The application of RII analysis facilitated the quantification of transit route factors and land parcel variables, refining the identification of key determinants influencing land-use changes. The study identified 14 significant variables with a direct impact on land parcel transformations, including Parking Provision (RII = 0.7929), Proximity to BRT Stations (RII = 0.7893), and Passenger Supply (RII = 0.7857). The prominence of these variables underscores the role of transit infrastructure in shaping land use patterns, reinforcing the importance of accessibility, station facilities, and real estate dynamics in TOD frameworks (Litman, 2020; Behrens & Kane, 2021). In contrast, 36 variables with RII values below 0.5 were excluded due to their minimal influence, indicating that while some transit-related factors may play a role in urban development, their effects may be highly localized or contingent on external market forces. These findings confirm that BRT corridors generally enhance property values, increase urban density, and improve accessibility, though the extent of these transformations varies based on economic conditions, policy frameworks, and the availability of supporting transit infrastructure (Cervero, 2013; Banister, 2022).
The insights from this study provide a structured framework for urban planners and policymakers to refine and implement transit-oriented development (TOD) strategies, ensuring sustainable and equitable urban growth. The results highlight the need for strategic policy interventions that balance development incentives with socio-economic equity, preventing unintended consequences such as gentrification, displacement, and speculative land investments. The study also emphasizes the necessity of integrating urban planning policies with transit expansion strategies to optimize land use efficiency and enhance the overall livability of transit-served areas (Rodriguez & Allen, 2022; Paulley et al., 2006).
Furthermore, the research underscores the importance of incorporating longitudinal assessments of land-use changes in BRT corridors, advocating for extended monitoring of economic shifts, population dynamics, and accessibility improvements. By leveraging advanced analytical tools such as machine learning, Geographic Information Systems (GIS), and predictive modeling, future research could refine the accuracy of transit impact assessments, offering urban planners and policymakers a more precise understanding of transit-induced transformations (Shaheen et al., 2016; Wilson, 2019). The integration of real-time mobility data, land price analytics, and participatory urban design approaches could further enhance TOD frameworks, ensuring that transit investments align with sustainable development goals and equitable urban growth.
In conclusion, this study contributes to the growing body of knowledge on transit-led urban transformations by identifying critical land parcel variables and transit factors that shape urban change in BRT-served areas. The findings reinforce the importance of accessibility, infrastructure quality, and transit efficiency in driving sustainable urban development while highlighting the need for proactive policy measures to mitigate social inequities associated with transit-induced land transformations. Future research should explore dynamic urban modeling techniques and interdisciplinary strategies to refine TOD policies, ensuring that BRT systems maximize their benefits while minimizing negative externalities. By emphasizing data-driven decision-making, this research offers valuable insights that can inform more effective and equitable urban planning practices in transit-oriented environments.
REFERENCES
- Adams, K. A., & McGuire, E. K. (2022). Research methods, statistics, and applications. SAGE Publications.
- Adeel, M., Yeh, A. G., & Zhang, F. (2017). Transport disadvantage and activity participation in the cities of Pakistan. Transport Policy, 63, 93–105.
- Amlan, H. A., Hassan, S. A., & Alias, N. E. (2023). Discovering the global landscape of vulnerability assessment method of transportation network studies: A bibliometric review. Physics and Chemistry of the Earth, 129, 103336.
- Anable, J. (2005). “Complacent Car Addicts” or “Aspiring Environmentalists”? Identifying travel behavior segments using attitude theory. Transport Policy, 12(1), 65–78.
- Aria, M., & Cuccurullo, C. (2022). A comprehensive review of bibliometric science mapping tools. Scientometrics, 127(3), 1395–1422.
- Banister, D. (2019). Transport for sustainable development. Taylor & Francis.
- Banister, D. (2022). The role of BRT systems in urban development: A global perspective. Urban Transport Journal, 15(2), 89–105.
- Bartholomew, K., & Ewing, R. (2011). Hedonic price effects of pedestrian- and transit-oriented development. Journal of Planning Literature, 26(1), 18–34.
- Basu, R., & Ferreira, J. A. (2020). Community engagement and public transport planning: Lessons from case studies. Transportation Research Part A, 134, 340–353.
- Behrens, R., & Kane, L. (2021). The role of public transport in mitigating climate change in developing cities. Transport and Climate Change.
- Beirão, G., & Cabral, J. A. S. (2007). Understanding attitudes towards public transport and private car: A qualitative study. Transport Policy, 14(6), 478–489.
- Bertolini, L., et al. (2012). Urban mobility and accessibility: An evaluation framework. Journal of Transport Geography, 26, 78–91.
- Bocarejo, J. P., & Oviedo, D. (2012). Transport accessibility and social inequities: A tool for identification of mobility needs and evaluation of transport investments. Journal of Transport Geography, 24, 142–154.
- Buehler, R., & Pucher, J. (2021). Sustainable transport in the Global South: Challenges, opportunities, and future directions. Transportation Research Part D, 95, 102842.
- Cervero, R. (2002). Built environments and mode choice: Toward a normative framework. Transportation Research Part D, 7(4), 265–284.
- Cervero, R. (2013). Linking urban transport and land use in developing countries. Journal of Transport and Land Use, 6(1), 7–24.
- Cervero, R., & Dai, D. (2014). BRT impacts on land uses and property values in China. Transport Policy, 36, 54–66.
- Chen, Y., & Kim, H. (2020). A bibliometric analysis of BRT corridors and urban land use: Trends and patterns. Journal of Urban Planning and Development, 146(3), 0252001.
- Cirillo, C., Eboli, L., & Mazzulla, G. (2011). Capturing latent user preferences in public transport. Transportation Research Part A, 45(7), 554–564.
- Currie, G. (2006). Bus rapid transit in Australasia: Performance, lessons learned, and futures. Journal of Public Transportation, 9(3), 1–22.
- Currie, G., & Delbosc, A. (2011). Understanding bus rapid transit ridership drivers: An empirical study. Transportation Research Part A, 45(8), 785–791.
- De Andrade, C. E. S., & D’Agosto, M. de A. (2016). The role of rail transit systems in reducing energy and carbon dioxide emissions: The case of the city of Rio de Janeiro. Sustainability (Switzerland), 8(2), 32–39.
- De Oña, J., & De Oña, R. (2013). Perceived service quality in bus transit service: A structural equation approach. Transport Policy, 29, 219–226.
- Diab, E., & El-Geneidy, A. (2019). The role of service reliability and passenger perceptions in transit ridership change. Transport Policy, 76, 181–193.
- Duarte, F., & Rojas, F. (2018). The impact of BRT systems on urban development in Latin America. Transportation Research Part A: Policy and Practice, 107, 261–275.
- Ewing, R., & Cervero, R. (2010). Travel and the built environment. Journal of the American Planning Association, 76(3), 265–294.
- Garcia, M., Silva, A., & Rios, J. (2021). The socio-economic impact of BRT corridors: Evidence from Latin American cities. Journal of Transport Geography, 93, 103124.
- Guzman, L. A., & Oviedo, D. (2018). Accessibility, affordability, and equity: Assessing ‘pro-poor’ public transport subsidies in Bogotá. Transport Policy, 66, 140–146.
- Hensher, D. A., & Ho, C. Q. (2020). Sustainable public transport systems: Moving toward a green future. Elsevier.
- Javid, M., & Okamura, T. (2019). The role of digital connectivity in public transport ridership. International Journal of Transport Economics, 46(3), 275–294.
- Jones, P., & Davis, M. (2021). Equity implications of transit-oriented development: The role of affordability and displacement. Urban Studies, 58(4), 723–741.
- Kamruzzaman, M., Baker, D., & Washington, S. (2018). Adaptation of TOD strategies in developing countries. Urban Planning International, 33(3), 87–96.
- Levinson, H., et al. (2003). Bus Rapid Transit: Implementation guidelines. TCRP Report 90.
- Litman, T. (2020). Evaluating Public Transit Benefits and Costs. Victoria Transport Policy Institute.
- Nguyen, T., & Tran, P. (2021). Long-term impacts of BRT on urban land use: A case study of Hanoi. Land Use Policy, 105, 105334.
- Paulley, N., et al. (2006). The demand for public transport: The effects of fares, quality of service, income, and car ownership. Transport Policy, 13(4), 295–306.
- Peters, K., & Brown, M. (2020). Transit corridors and urban transformation: Analyzing the impacts of BRT systems. Urban Studies, 57(12), 2448–2464.
- Shaheen, S., Guzman, S., & Zhang, H. (2016). The changing role of shared mobility in developing cities. Transport Policy, 49, 25–40.
- Suzuki, H., Cervero, R., & Iuchi, K. (2013). Transforming cities with transit: Transit and land-use integration for sustainable urban development. The World Bank.
- Tsivanidis, N. (2019). Evaluating the impact of urban transit infrastructure: Evidence from Bogotá’s Trans Milenio. Review of Economic Studies, 86(6), 2726–2763.
- Wilson, R. (2019). Evaluating the economic impacts of BRT on urban land use. Journal of Infrastructure Systems, 25(3), 04019027.
- Zhang, Y., & Liu, S. (2019). Transit corridors and urban land use changes: A case study of BRT systems in China. Transportation Research Part D: Transport and Environment, 67, 698-710.
- Zhao, P., & Li, S. (2018). Determinants of public transit ridership: Evidence from China. Journal of Transport and Land Use, 11(1), 381–400.
APPENDIX A
Questionnaire: Please rate the following items based on their effectiveness in influencing land parcel changes near exclusive transit routes using a five-point Likert scale, where 1 represents “Not Effective,” 2 represents “Slightly Effective,” 3 represents “Neutral,” 4 represents “Effective,” and 5 represents “Very Effective.”
Section 1: How effective are Transit Route Variables (29 Variables) in influencing land parcel changes?
- Parking Provision (PP) ☐ 1 ☐ 2 ☐ 3 ☐ 4 ☐ 5
- Passenger Supply (PS) ☐ 1 ☐ 2 ☐ 3 ☐ 4 ☐ 5
- Service Road Availability (SRA) ☐ 1 ☐ 2 ☐ 3 ☐ 4 ☐ 5
- Escalator Availability (EA) ☐ 1 ☐ 2 ☐ 3 ☐ 4 ☐ 5
- Footpath Availability (FA) ☐ 1 ☐ 2 ☐ 3 ☐ 4 ☐ 5
- Drop-off Bay Availability (DBA) ☐ 1 ☐ 2 ☐ 3 ☐ 4 ☐ 5
- Proximity (P) ☐ 1 ☐ 2 ☐ 3 ☐ 4 ☐ 5
- Accessibility (A) ☐ 1 ☐ 2 ☐ 3 ☐ 4 ☐ 5
- Feeder Routes (FR) ☐ 1 ☐ 2 ☐ 3 ☐ 4 ☐ 5
- Transit Service Quality (TSQ) ☐ 1 ☐ 2 ☐ 3 ☐ 4 ☐ 5
- Transit Networks (TN) ☐ 1 ☐ 2 ☐ 3 ☐ 4 ☐ 5
- Feeder Bus (FB) ☐ 1 ☐ 2 ☐ 3 ☐ 4 ☐ 5
- Urbanization (U) ☐ 1 ☐ 2 ☐ 3 ☐ 4 ☐ 5
- Integrated Transport (IT) ☐ 1 ☐ 2 ☐ 3 ☐ 4 ☐ 5
- Public Transportation (PT) ☐ 1 ☐ 2 ☐ 3 ☐ 4 ☐ 5
- Land-Use Planning (LUP) ☐ 1 ☐ 2 ☐ 3 ☐ 4 ☐ 5
- Compact City (CC) ☐ 1 ☐ 2 ☐ 3 ☐ 4 ☐ 5
- Traffic Density (TD) ☐ 1 ☐ 2 ☐ 3 ☐ 4 ☐ 5
- Urban Growth (UG) ☐ 1 ☐ 2 ☐ 3 ☐ 4 ☐ 5
- Sustainable Mobility (SM) ☐ 1 ☐ 2 ☐ 3 ☐ 4 ☐ 5
- Transport Accessibility (TA) ☐ 1 ☐ 2 ☐ 3 ☐ 4 ☐ 5
- Population Change (PC) ☐ 1 ☐ 2 ☐ 3 ☐ 4 ☐ 5
- Mobility Patterns (MP) ☐ 1 ☐ 2 ☐ 3 ☐ 4 ☐ 5
- Transit Network Design (TND) ☐ 1 ☐ 2 ☐ 3 ☐ 4 ☐ 5
- Multimodal Transport (MT) ☐ 1 ☐ 2 ☐ 3 ☐ 4 ☐ 5
- Active Transportation (AT) ☐ 1 ☐ 2 ☐ 3 ☐ 4 ☐ 5
- Commute Mode Choice (CMC) ☐ 1 ☐ 2 ☐ 3 ☐ 4 ☐ 5
- Urban Rail Transit (URT) ☐ 1 ☐ 2 ☐ 3 ☐ 4 ☐ 5
- Feeder Transit (FT) ☐ 1 ☐ 2 ☐ 3 ☐ 4 ☐ 5
Section 2: How effective are Land Parcel Variables (21 Variables) in influencing land parcel changes?
- Land Value (LV) ☐ 1 ☐ 2 ☐ 3 ☐ 4 ☐ 5
- Land Use (LU) ☐ 1 ☐ 2 ☐ 3 ☐ 4 ☐ 5
- Population Density (PD) ☐ 1 ☐ 2 ☐ 3 ☐ 4 ☐ 5
- Building Height (BH) ☐ 1 ☐ 2 ☐ 3 ☐ 4 ☐ 5
- Building Condition (BC) ☐ 1 ☐ 2 ☐ 3 ☐ 4 ☐ 5
- Urban Population Density (UPD) ☐ 1 ☐ 2 ☐ 3 ☐ 4 ☐ 5
- Housing Demand (HD) ☐ 1 ☐ 2 ☐ 3 ☐ 4 ☐ 5
- Housing Affordability (HA) ☐ 1 ☐ 2 ☐ 3 ☐ 4 ☐ 5
- Property Values (PV) ☐ 1 ☐ 2 ☐ 3 ☐ 4 ☐ 5
- Land Use Efficiency (LUE) ☐ 1 ☐ 2 ☐ 3 ☐ 4 ☐ 5
- Land Renewal Transformation (LRT) ☐ 1 ☐ 2 ☐ 3 ☐ 4 ☐ 5
- Redevelopment (R) ☐ 1 ☐ 2 ☐ 3 ☐ 4 ☐ 5
- Land Cover Changes (LCC) ☐ 1 ☐ 2 ☐ 3 ☐ 4 ☐ 5
- Mixed-Use Development (MUD) ☐ 1 ☐ 2 ☐ 3 ☐ 4 ☐ 5
- Urban Space (US) ☐ 1 ☐ 2 ☐ 3 ☐ 4 ☐ 5
- Land Use Change (LUC) ☐ 1 ☐ 2 ☐ 3 ☐ 4 ☐ 5
- Housing Price (HP) ☐ 1 ☐ 2 ☐ 3 ☐ 4 ☐ 5
- Neighbourhood Change (NC) ☐ 1 ☐ 2 ☐ 3 ☐ 4 ☐ 5
- Infrastructure Quality (IQ) ☐ 1 ☐ 2 ☐ 3 ☐ 4 ☐ 5
- Urban Variations (UV) ☐ 1 ☐ 2 ☐ 3 ☐ 4 ☐ 5
- Accessibility Impacts (AI) ☐ 1 ☐ 2 ☐ 3 ☐ 4 ☐ 5