
Banana Production Risk Zoning and Copula Based Income Insurance Rate Determination: a Case Study of Guangdong, China
- Jianming Xie
- Charuk Singhapreecha
- Warattaya Chinnakum
- Kittawit Autchariyapanitkul
- 3816-3828
- Feb 20, 2025
- Economics
Banana Production Risk Zoning and Copula Based Income Insurance Rate Determination: a Case Study of Guangdong, China
Jianming Xie1; Charuk Singhapreecha2 ;Warattaya Chinnakum3 ;Kittawit Autchariyapanitkul4
1,2,3Faculty of Economics, Chiang Mai University, Chiang Mai, 50200, Thailand
4Faculty of Economics, Maejo University, Chiang Mai 50290, Thailand
DOI: https://dx.doi.org/10.47772/IJRISS.2025.9010298
Received: 08 January 2025; Accepted: 16 January 2025; Published: 20 February 2025
ABSTRACT
This study explores the risk characteristics and regional differences in banana production in 21 cities in Guangdong Province through cluster analysis and kernel density estimation. Based on statistical analysis and optimal clustering number selection, cities are divided into three categories: high, medium, and low-risk areas, reflecting the characteristics of resource dependent, economic core, and technological innovation cities, respectively. The estimation of kernel density function reveals the concentration and tail characteristics of production and price distribution in different risk areas. By analyzing the dependence relationship between price and output through the Copula model, t Copula and Frank Copula performed well in high-risk and medium risk areas, respectively. The insurance pricing results show that the premium rate in high-risk areas is more sensitive to changes in coverage, reflecting the significant impact of differences in risk distribution on insurance design. This study provides important references for regional risk management and insurance product optimization.
Keywords:Cluster analysis, Kernel density , Copula model, Income insurance, Regional economic
INTRODUCTION
The sources of risks in banana production are complex, including natural risks, disease risks, and market risks. The banana production in Guangdong Province is the largest region in China, and natural risk and disaster factors can seriously affect the growth and yield of bananas. Liu et al., In 2021, when ensuring farmers’ income from banana cultivation, market risks stem from drastic price fluctuations. Faced with supply and demand contradictions in the market, it is difficult to quickly adjust, which further increases the uncertainty of price fluctuations, et al., (2022). Because income insurance provides more comprehensive protection.
The division of risk areas is a key step in the design of banana agricultural insurance. Cluster analysis is a commonly used method that groups data on banana production, environment, and market prices to reveal risk characteristics in different regions (Guo et al., 2021; Alfonso Guti é rrez Mart í n, 2020). In banana production in Guangdong Province, systematic clustering is achieved through data standardization, combined with average square distance and inconsistency coefficient to evaluate clustering effectiveness, thus achieving accurate risk zoning. Different cities can adjust insurance rates based on different indicators to achieve dynamic matching between risks and insurance costs.
In terms of calculating insurance premiums, Kernel Density Estimation (KDE) is an effective tool for non parametric estimation of the marginal distribution of banana production and prices in Guangdong Province, revealing the distribution characteristics of variables (Kamalov, 2020). In addition, the Copula model characterizes the nonlinear dependence between banana yield and price through a joint distribution function, providing flexibility for tariff determination (Lee et al., 2020). To cope with the uncertainty of natural disasters and market fluctuations in bananas, Mobarok Hossain. et al, (2020) Monte Carlo simulation, as a probability estimation method based on random samples, can not only simulate the impact of extreme conditions and price fluctuations on banana yield in banana cultivation, but also evaluate the effectiveness of different insurance schemes. At present, the insurance products provided by Guangdong Province for banana cultivation are mainly cost insurance, which only transfers banana production risks caused by natural disasters. Farmers still need to bear market risks, such as the drop in banana prices by Hirbod Assa, et al.(2021)
Therefore, this article uses banana production and price data from 21 cities in Guangdong Province from 1990 to 2023, divides the cities into different risk levels through cluster analysis, tests the joint distribution of kernel density estimation and Copula model, and then uses Monte Carlo simulation to calculate the joint distribution of banana prices and yields, and calculates the banana income insurance premium rate. This method can effectively optimize the division of banana production risk areas and rate design in Guangdong Province, and enhance the fairness and scientificity of agricultural insurance.
Rsearch Objectives
This study aims to explore the risk characteristics and regional differences of banana production in 21 cities in Guangdong Province through cluster analysis and non parametric estimation methods.
Based on cluster analysis, divide cities into different risk areas and reveal the risk characteristics of different types of cities.
Use the kernel density function and Copula’s joint distribution to estimate the marginal distribution and joint distribution characteristics of banana yield and price, and analyze their concentration and tail risk.
3.Combining risk area division and joint distribution, using Monte Carlo simulation method, design a scientifically reasonable banana income insurance premium rate, providing theoretical basis and practical support for insurance product optimization and regional risk management.
METHODOLOGY
Cluster Analysis
Cluster analysis is used to analyze different variables related to banana production, calculate the optimal risk zoning level, and form the final banana risk zoning. The overall data is divided into risk levels from low to high. According to the use of z-score method to standardize the dimensions of quantitative indicators, Zizheng Guo, Yu Shi, Faming Huang, et al. (2021) k-means clustering defines the distance between classes as the average square distance between two samples and reflects the results on the clustering tree. Combined with the inconsistency coefficient of the analysis, it can identify the risk areas of banana production in Guangdong. The risk zoning clustering formula is as follows:
\[ d(x, \mu_k) = \sqrt{\sum_{j=1}^{n} (x_j – \mu_{k,j})^2} \] \quad (1)
Among them:: is the spatial straight-line distance from point x to point. : is the value of data point x on the j th variable. : is the value of the cluster center on the j th variable. n: total number of variables. x: Cluster iterative data points. Variable content in x: V1:Coefficient of Variation: Describe the difference between the dispersion of data points and the dispersion of cluster centers. V2:Specialization Index: Measure the degree to which the specialization level of a region or industry deviates from the specialization level of the cluster center. V3:Efficiency Index: Measure the difference between the economic or production efficiency of a region and the average efficiency of the cluster center. V4:Rural Residents’ Income: Measure the difference in income levels between data points and cluster centers. V5:Production Decline Rate:Describe the deviation in the proportion of yield decline in agriculture or production fields.
The original data used for data point x is the yield data per unit area of banana production in 21 cities in Guangdong Province from 1990 to 2023. Take the average of the variable data for each city as a representative of its banana production status and perform k-means clustering analysis. After clustering, the Euclidean distance of each cluster group in 21 cities in Guangdong Province is minimized, and the optimal risk zoning situation is determined through elbow plots and clustering result plots.
Kernel Density Function and Copula Joint Distribution
As firstly, analyzing the joint distribution of banana prices and yields requires a stationary sequence. Qi, LM., Zhu, HJ., Geng, XZ. et al. (2023) HP filtering method is a common method that can eliminate perturbation terms and obtain fitted values. Combining different risk zones, the data is divided into two categories using the HP filtering method: trend term and random disturbance term, and then the ADF stationarity test is used to obtain stationary data.
\[ Y_t = \hat{Y}_{2023} + \left( \frac{e_t}{\hat{Y}_t} \right) \hat{Y}_{2023} \] \quad (2)
At the same time, use the above equation, with a time period of 1990-2023, to discount the banana disturbance terms for different years using the predicted banana production value for 2023, making it easy to compare the risk and random disturbance terms of banana production, and making the sequence stationary Qi, LM., et al.(2023)
Analyzing the marginal distribution of banana yield and price, kernel density estimation KDE is a non parametric method used to estimate the probability density function of random variables based on data point samples. It provides a stationary estimate of the basic distribution of data without making any assumptions about the distribution form, Lee, W. J., Mendis, G. P., Triebe, M. J,et al.(2020)。 According to the determined marginal distribution, Copula functions have different types, each with its own attributes and characteristics, Benson, S., Burroughs, R,et al.(2020)
Copula chooses normal Gaussian Copula, T-Popula,Frank Copula,plackett-copula. The copula function reflects the joint distribution, which is the final joint distribution state Shi, P., & Lee, G. Y. (2022) Then calculate the square Euclidean distance of the empirical side functions of the four copula functions corresponding to the shortest distance, and use the maximum likelihood estimation method to determine the copula parameters to fit the joint distribution Shi of banana prices and yields, P., & Zhao, Z. (2020). Combining KDE and Copula methods, the complete joint distribution formula for banana yield and price is as follows:
\[ ƒ_{X_i,P_i,R_i} (x,p) = \left[ c(F_{X_i} (x), F_{P_i} (p); \theta) \cdot f_{X_i} (x) \cdot f_{P_i} (p) ; R_i \right] \quad (3) \]’
Among them, \[ c(u,v; \theta) = \frac{\partial^2 (u,v; \theta)}{\partial u \partial v} \] is the probability density function of the copula; \( R_i \) represents the basic rates for different levels of banana risk area classification; \( f_{X_i} (x) \) is the marginal density function of banana yield; \( f_{P_i} (p) \) is the editing density function for banana prices, which can be estimated by KDE.
Determination of Income Insurance Premiums
Above all, combining the actual situation of the banana industry in Guangdong Province, Markovi ć Todor et al. (2020) have the importance and conditions for implementing income insurance. Tiwari S, Coble KH, et al. (2021) The calculation of income insurance premium rates can be divided into the following steps: loss distribution calculation, using KDE estimated probability density, combined with banana planting area and unit output value, quantifying the compensation amount under different loss levels. Joint risk calculation, using Copula function to calculate the probability of multiple risk factors occurring simultaneously, adjusting the payout prediction Duarte of a single risk model, Gislaine Vieira and Ozaki, Vitor A.(2023). Expected compensation calculation, based on the compensation amount and corresponding probability, calculate the expected compensation value E (Loss). The formula is as follows:
\[ E(\text{Loss}) = \left[ \int_{0}^{\infty} \text{Loss}(x) \cdot f(x) \,dx ; R_i \right] \quad (4) \]
Among them, ƒ(x) is the probability density function of kernel density estimation. Loss (x) is the probability of banana production loss per year. is the basic rate for different levels of banana risk area classification
Therefore, in terms of final cost calculation, taking into account management expenses, profit margins, and reinsurance costs, a formula for calculating the final banana income insurance premium rate is formulated:
\[ \text{Pure Premium Rate} = \frac{E(\text{Loss})}{\text{Insured Value}} \quad (5) \]
Among them, Premium Rate: the proportion of the premium that the end customer needs to pay to the insurance amount. E(Loss):the average loss amount of bananas estimated based on the pre kernel density function and Copula function. Insured Value:the value of banana production covered by the policy.
DATA SOURCES
Risk zoning clustering data
Cluster analysis uses banana production and planting area data from different cities over the years, sourced from the Guangdong Statistical Yearbook. The banana yield per unit area, variation index, specialization index, efficiency index, and banana planting loss probability data for each city are calculated by the author.
Insurance premium rate calculation data
The copula joint distribution insurance premium rate calculation uses banana price data, which is the average wholesale price of bananas in China over the years. It is obtained from the monthly fruit price query on the official website of China Agricultural Reclamation and Hot Work Institute, and is the annual average value of the monthly data summary. The banana yield per unit area using different risk zones is derived from the author’s calculations.
EMPIRICAL ANALYSIS
Cluster analysis
In the risk of banana production in Guangdong, dividing the research area into zones of different risk levels helps to more accurately identify and respond to different risk levels and regions. Its core function is to spatialize complex risk information and present it in a visual form for intuitive understanding.
Table 1: Descriptive of Cluster Variables
| Variable | Median | Min | Max | Range | Skewness | Kurtosis |
| v1 | -0.39 | -0.92 | 3.57 | 4.49 | 2.13 | 4.98 |
| v2 | -0.36 | -1.06 | 1.95 | 3.01 | 0.84 | -0.78 |
| v3 | -0.05 | -1.45 | 1.86 | 3.31 | 0.15 | -1.15 |
| v4 | -0.21 | -0.85 | 3.99 | 4.83 | 2.98 | 9.12 |
| v5 | -0.44 | -0.63 | 3.69 | 4.32 | 2.42 | 5.99 |
Source: Author’s Calculation
Table 1 shows the statistical characteristics of five variables v1-v5 used for cluster analysis of banana production in different cities, revealing key features of variable distribution through median, range, skewness, and kurtosis. The skewness of v2 and v3 is close to symmetry, indicating that the distribution of these variables is relatively balanced. The kurtosis of v4 and v1 is relatively high, indicating a steep distribution with a heavy tail, and a few cities have a significant impact on the overall situation. These variables describe significant differences in economic, geographical, and social characteristics of cities, supporting the rationality and interpretation depth of different city groupings in cluster analysis.

Figure 1.Cluster Optimal Average Silhouette Width and Cluster Elbow Graph
By analyzing the elbow diagram and average contour coefficient, the optimal number of clusters for 21 cities was determined to be 3, indicating significant distribution of three types of features between cities.
Cluster 1 banana production high-risk areas, inland or eastern coastal cities. These cities have a relatively low economic level, with agriculture and primary manufacturing as the main industries. The similarity between cities is high, indicating the common characteristics of resource dependent economy and underdeveloped level. Cluster 2 is a high-risk area for banana production, a core city in the economic belt, with high levels of agriculture and industrialization, and a developed economy. These cities together constitute the main body of the Pearl River Economic Development Zone. Cluster 3 is a low-risk area for banana production, an economically developed region, a center for technological innovation, and a globalized city with advanced and diverse economic structures. By clustering into three risk zones, the distribution of urban economy, industry, and geographical characteristics is further revealed, providing important basis for regional development planning and resource allocation.
Table 2: Cluster Sorting Criteria
| Rank | v1 | v2 | v3 | v4 | v5 |
| 1 | -0.1420914 | -0.6739489 | -0.5991446 | -0.09897694 | -0.4967905 |
| 2 | -0.2234471 | 0.9351038 | 0.8900616 | -0.32195308 | 0.1972324 |
| 3 | 3.5740295 | -1.0024964 | -1.419964 | 3.98632401 | 3.6896032 |
Source: Author’s Calculations
Table 3: K-means Cities Clustering Analysis Results
| Cities | c1 | c2 | c3 | c4 | c5 | c6 | c7 | c8 | c9 | c10 | c11 | c12 | c13 | c14 | c15 | c16 | c17 | c18 | c19 | c20 | c21 |
| Rank | 2 | 3 | 2 | 2 | 2 | 1 | 1 | 1 | 1 | 1 | 2 | 2 | 2 | 1 | 2 | 2 | 1 | 1 | 1 | 1 | 1 |
Source: Author’s Calculation
According to the results in Tables 2 and 3, 21 cities are divided into 3 clustering groups. The clustering results reflect significant differences in economic development patterns, geographical locations, and industrial structures among urban banana plantations in Guangdong Province.
Cluster 1 high-risk areas include the city of Shaoguan, Heyuan , Meizhou , Huizhou , Shanwei , Yangjiang , Zhaoqing , Qingyuan , Chaozhou , Jieyang And Yunfu. These cities are located inland or along the eastern coast, with relatively low levels of economic development, possibly dominated by agriculture or low industrialization, and characterized by resource dependence or underdeveloped economies.The risk areas in Cluster 2 include Guangzhou, Zhuhai, Foshan, Dongguan, Zhongshan, Jiangmen, and Zhanjiang. These cities are usually located in economic development zones with a high degree of agricultural technology.Cluster 3 low-risk areas include Shenzhen, which demonstrates its agricultural economy and social characteristics independent of other cities. Reflecting Shenzhen’s special status as a first tier city and a center for technological innovation.
Determination of insurance premium rate using kernel density function combined with copula
Kernel density estimation
Kernel density estimation is an important step in fitting the joint distribution of banana production edges. By combining the annual income loss of bananas with the joint distribution of kernel density function KDE and Copula function, a relatively dynamic income insurance premium calculation model can be established.
Table 4 : ADF test of Prices and Yields
| Test Result | ADF Statistic | Critical Values (1%) | Critical Values (5%) | Critical Values (10%) | p-Value |
| RA1 | -4.577009 | -3.65373 | -2.95711 | -2.617434 | 0.0009 |
| RA2 | -3.349325 | -3.646342 | -2.954021 | -2.615817 | 0.0205 |
| RA3 | -6.55531 | -3.646342 | -2.954021 | -2.615817 | 0 |
| p | -4.380966 | -3.646342 | -2.954021 | -2.615817 | 0.0015 |
Source: Author’s Calculations
After the original banana production data is separated into periodic and trend terms through HP filtering, using the aforementioned formula, the banana production data from different years are combined with the fitted value of banana production in 2023 to discount all random fluctuation terms to 2023 for comparison between data from different years. At the same time, the ADF stationarity test in the above table has passed, proving that the new sequence is a stationary sequence.
Table 5 : Descriptive Statistics of Price and Yield Data
| Variable | Mean | Standard deviation | Median | Min | Max | Skewness | Kurtosis |
| RA1 | 1.77 | 0.13 | 1.76 | 1.37 | 1.99 | -1.02 | 1.46 |
| RA2 | 2.98 | 0.23 | 2.98 | 2.29 | 3.37 | -0.9 | 1.27 |
| RA3 | 1.64 | 0.57 | 1.71 | 0.65 | 3.67 | 0.99 | 2.83 |
| P | 5.84 | 0.55 | 5.83 | 4.75 | 7.43 | 0.61 | 1.36 |
Source: Author’s Calculations
From the perspective of mean and standard deviation, the distribution of yield data for RA1 and RA2 is relatively concentrated, with mean values of 1.77 and 2.98 respectively, small standard deviation, and low volatility. The mean of RA3 is 1.64, but the standard deviation is 0.57, indicating significant fluctuations in its yield. The maximum value of RA3 is higher than other risk areas, and its distribution exhibits a spike characteristic, reflecting the instability of high risk. There may be abnormal or extreme production values.
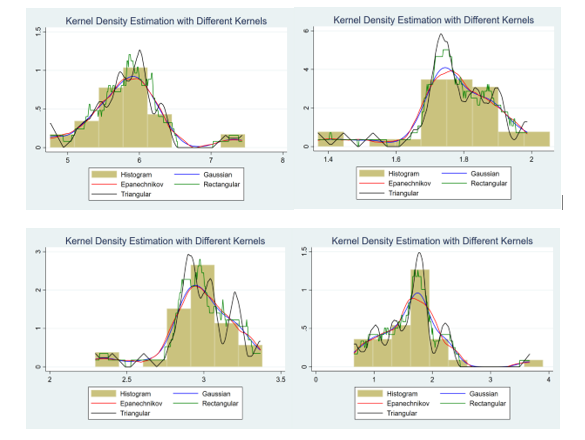
Figure 2. Kernel Density Estimation with Price and Yields
By comparing the histogram with KDE, it can be seen that four kernel functions were used for kernel density estimation to compare and analyze the output and price of different risk zones with the histogram. The functions of each kernel are different, Gaussian kernel: The smoothness is the strongest, suitable for identifying overall distribution trends. Epanechnikov kernel: High efficiency and moderate smoothness of boundaries. Rectangular kernel: The boundary is sharp and suitable for analyzing local changes. Triangular kernel: Has moderate smoothing effect and is commonly used to simplify the distribution estimation of models.
The distribution of price p has a certain degree of non-uniformity, and there are local outliers or multimodal features. The distribution concentration of partition ra1 is relatively high, and kernel density estimation shows limited tail risk. The skewed distribution of ra2 may be related to potential extreme risk factors and requires further analysis. The distribution of RA3 is uniform, and the tail extension indicates that it has a certain degree of risk diversity. Among the four variables, the distribution of p and ra2 shows more obvious skewness and volatility, which may reflect high-risk or variable production environments, while the distribution of ra1 and ra3 is more concentrated or uniform.
Table 6: Integrated Squared Error to Select Kernel
| Variables/Kernel | Gaussian | Epanechnikov | Rectangular | Triangular |
| RA1 | 14.8703 | 10.9015 | 10.3598* | 13.2178 |
| RA2 | 2.804 | 2.2418* | 3.0853 | 2.8857 |
| RA3 | 0.9079 | 0.602 | 0.5158* | 0.7582 |
| P | 0.5685 | 0.5354 | 0.4938* | 0.6302 |
Source: Author’s Calculations
The sum of squares (ISE) within the group is used to measure the degree of deviation between the kernel density estimation function and the true distribution. The smaller the value, the closer the estimation is to the true distribution. It can be used as a reference for selecting the optimal kernel density function for banana production in Guangdong. Rectangular and Epanechnikov kernels are suitable for capturing complex distribution features, while Gaussian and Triangular kernels can be used for overall trend analysis.
The distribution of banana price P may contain multiple peaks and local variations, and rectangular kernels are more accurate in capturing these changes, while the smoothness of triangular kernels may lead to increased errors. The distribution of RA1 may be concentrated in a limited range and contain distinct peaks. Rectangular kernels can better capture these features, while Gaussian kernels may increase errors due to excessive smoothing. The distribution of RA2 may contain some skewness, and the Epanechnikov kernel retains boundary characteristics while capturing the concentrated distribution, while the rectangular kernel has weaker adaptability to skewness. The distribution of RA3 may be uniform and broad, with rectangular kernels performing the best, while Gaussian kernels may result in loss of details due to their high smoothness.
Therefore, based on the numerical calculation of ISE and the kernel density function graph of banana price and partition yield in Fig.4, the optimal kernel density function for banana price P, risk partition Ra1, and risk partition Ra3 is Rectangular, while the optimal kernel density function for risk partition Ra2 is Epanechnikov.
Table 7: Optimal Copula Fitting Results(Price&Risk-Zones)
| District | Copula | Parameter θ | Std.erro | Max loglikelyhood | Spearman_rho | Kendall_tau | Euclidean squared distance |
| High-R1 | gaussian | -0.0376 | 0.211 | 0.01582 | -0.0358768 | -0.02392209 | 11.34381 |
| t | -0.0374 | NA | 0.01545 | -0.03569784 | -0.02380272 | 11.34223 | |
| frank | 0.04604 | 1.052 | 0.0009582 | 0.007673127 | 0.005115454 | 10.00066* | |
| plackett | 1.021 | 0.51 | 0.0008615 | 0.01035361 | 0.01035361 | 10.79183 | |
| Mid-R2 | |||||||
| gaussian | -0.366 | 0.159 | 1.758 | -0.3514697 | -0.2385352 | 10.9271 | |
| t | -0.3655 | 0.159 | 1.758 | -0.3509697 | -0.2381831 | 10.92408 | |
| frank | -1.777 | 1.043 | 1.438 | -0.2844563 | -0.1915609 | 9.576965* | |
| plackett | 0.4839 | 0.217 | 1.214 | -0.3477675 | -0.3477675 | 9.611628 | |
| Low-R3 | |||||||
| gaussian | -0.3617 | 0.16 | 1.711 | -0.3472838 | -0.2355893 | 10.8275 | |
| t | -0.2538 | 0.199 | 3.92 | -0.2430361 | -0.1633745 | 9.789194* | |
| frank | -1.651 | 1.148 | 1.011 | -0.2657075 | -0.178697 | 10.02812 | |
| plackett | 0.3884 | 0.217 | 1.222 | -0.4405492 | -0.4405492 | 9.940505 |
Source: Author’s Calculations
By fitting, estimating parameters, and evaluating the adaptability of four different Copula models, it is possible to summarize and compare the dependency relationship between banana price P and unit area yield data of three production risk zones R1-R3 for each model. From the optimization results of the maximum likelihood estimation method, all models have successfully converged, indicating that these models can capture the potential correlation structure between banana price P and unit area yield in different production risk zones.
From the Euclidean squared distance between simulated banana production data and actual data, t Copula performs the best in modeling the dependency relationship between banana prices and yield in R3 production risk zones, especially in capturing tail correlations. Frank Copula also showed good performance in the moderately correlated banana risk zones R1 and R2, with high adaptability and simulation data quality.
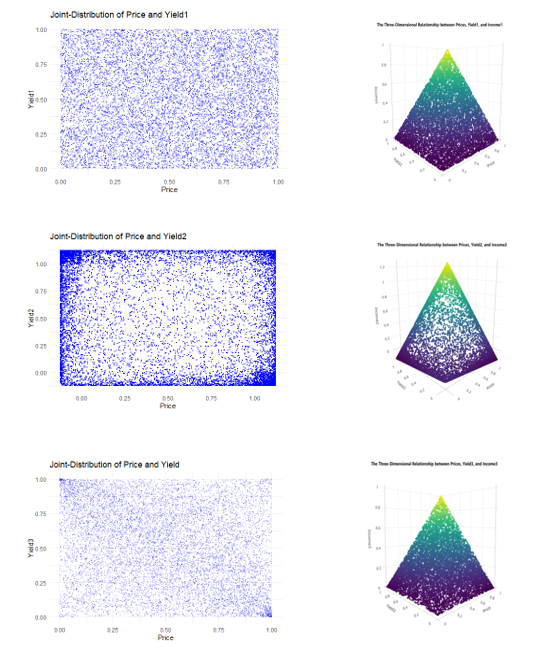 Figure 3.Scatter Plot and Three-Dimensional Relationship of Prices, Yields and Incomes
The image displays the joint distribution and three-dimensional relationship of price, Yield1-Yield3, and Income1 ncome3. The scatter plot in Fig.3 shows the two-dimensional scatter distribution of price and Yield1-Yield3. Scatter plot 3 shows a clear spiral shape, while scatter plots 1 and 2 exhibit a rectangular distribution, indicating that there is no significant linear correlation between price and output. The 3D image in Fig.3 illustrates the three-dimensional relationship between P-Yield Income. The three-dimensional scatter distribution presents a Viridis color map that gradually changes from bottom to top, indicating an increasing trend in income with rising prices and production.
The information displayed in the image is consistent with the background of pure insurance premium analysis, with Guangdong banana prices and production as the main variables, and income as a derivative indicator. The distribution characteristics of the data suggest that the price and yield of bananas in Guangdong have a strong impact on income, but the nonlinear components need to be further validated through clustering or regression models.
Table 8: Banana Income Insurance Pure Premium Rate
| Rank 1-High | Coverage Level (%) | Insurance Premium Rate(%) |
| 1.1 | 100 | 8.0157 |
| 1.2 | 95 | 6.9548 |
| 1.3 | 90 | 5.9398 |
| 1.4 | 85 | 4.9629 |
| 1.5 | 80 | 4.023 |
| 1.6 | 75 | 3.1318 |
| 1.7 | 70 | 2.3255 |
| Rank 2-Mid | ||
| 2.1 | 100 | 7.4356 |
| 2.2 | 95 | 6.4414 |
| 2.3 | 90 | 5.482 |
| 2.4 | 85 | 4.5594 |
| 2.5 | 80 | 3.6708 |
| 2.6 | 75 | 2.8405 |
| 2.7 | 70 | 2.0926 |
| Rank 3-Low | ||
| 3.1 | 100 | 3.8933 |
| 3.2 | 95 | 3.1951 |
| 3.3 | 90 | 2.5499 |
| 3.4 | 85 | 1.9597 |
| 3.5 | 80 | 1.4237 |
| 3.6 | 75 | 0.9384 |
| 3.7 | 70 | 2.3255 |
Source: Author’s Calculations
The table lists the relationship between the coverage rate and insurance premium rate of banana income insurance pure premium rate under three risk levels. Rank 2 and Rank 1 represent medium and high-risk areas, respectively. Rank 3 represents the lowest risk area. The increasing premium rate reflects that high-risk areas need to pay higher insurance costs due to higher potential losses, which is consistent with the aforementioned data risk difference.
As the coverage rate decreases from 100% to 70%, the premium rates for all risk levels gradually decrease. In the Rank 3 region, the premium rate decreased from 3.8933% with 100% coverage to 0.5252% with 70% coverage. At the same time, there is a significant difference in the growth rate of premium rates. The decrease in premium rate of Rank 1 with decreasing coverage is smaller than that of Rank 2 and Rank 3. At a coverage rate of 100% to 70%, the rate of Rank 1 decreases by about 5.69%, while the rate of Rank 3 decreases by about 3.37%. This indicates that even if coverage is reduced in high-risk areas, insurance risks are still relatively high, reflecting a greater sensitivity of high-risk areas to premium rates.
Combining the average and skewness descriptions of risk zones R1, R2, and R3, it can be seen that income fluctuations are greater in high-risk areas, leading to higher premium rate demands. Meanwhile, the distribution characteristics between risk levels are consistent with the tail correlation analyzed by the Copula model. Especially Frank Copula and t Copula’s ability to capture tail correlations in high-risk areas further validates the applicability of these models for insurance pricing. Therefore, the changes in the pure premium rate of banana income in the table not only reflect the pricing logic of different coverage rates, but also fully demonstrate the significant differences in risk characteristics between regions and their important impact on insurance products.
CONCLUSION
Through a comprehensive study of cluster analysis and kernel density function estimation of banana production risks in 21 cities, the profound impact of economic, industrial, and geographical differences between cities on banana planting risks has been revealed. Based on the statistical characteristics of five variables, the analysis shows that the kurtosis of v4 and v1 is relatively high, indicating that a few cities have a significant impact on the overall distribution. The elbow diagram and average contour coefficient confirm that the optimal number of clusters is 3, representing high-risk, medium risk, and low-risk areas, respectively. Among them, Cluster 1 is an underdeveloped city in inland and coastal areas, characterized by a resource dependent economy and low levels of industrialization; Cluster 2 is an economic core city dominated by technology-based agriculture; Cluster 3 is a center for technological innovation and globalization, with a diversified economic structure and minimal impact on agriculture.
The distribution characteristics of banana prices and yields were analyzed by combining kernel density estimation with different kernels. It was found that the yield of high-risk area RA1 fluctuated significantly and the tail extended, reflecting potential diversification risks. The yield distribution of RA2 and RA3 is relatively concentrated, but RA2 shows skewed characteristics. The price P exhibits local outliers and multiple peaks, and the ISE indicators of different kernels validate the advantages of Rectangular and Epanechnikov in complex distribution estimation. By fitting the Copula model to the dependency relationship between banana prices and yields in different risk areas, it was found that t Copula performed the best in capturing tail correlation in high-risk areas, while Frank Copula was suitable for medium correlation areas. Ultimately, insurance pricing analysis shows that premium rates increase with risk levels under different coverage rates, and the decrease in premium rates in high-risk areas is smaller when coverage rates decrease, reflecting their greater insurance risk sensitivity.
Comprehensive analysis shows that different urban risk zones, economic development models, and geographical characteristics have a significant impact on banana production risks. The analysis based on kernel density estimation and Copula model provides important references for resource allocation and insurance product design in high-risk areas.
REFERENCES
- Tripathi G, Pandey AC, Parida BR.(2022). Flood Hazard and Risk Zonation in North Bihar Using Satellite-Derived Historical Flood Events and Socio-Economic Data. Sustainability. 14(3):14-
- Liu Y, Lu X, Yao Y, et al.(2021). Mapping the risk zoning of storm flood disaster based on heterogeneous data and a machine learning algorithm in Xinjiang, China. J Flood Risk Management. 14:e,71-126.
- Alfonso Gutiérrez-Martín.(2020).A GIS-physically-based emergency methodology for predicting rainfall-induced shallow landslide zonation,Geomorphology,359,107-121.
- J.A. Kirby, G. Masselink, S. Essex, T. Poate, T. Scott.(2021). Coastal adaptation to climate change through zonation: A review of coastal change management areas (CCMAs) in England,Ocean & Coastal Management.215. 95-105.
- Mobarok Hossain, Pulak Kumar Patra.(2020).Contamination zoning and health risk assessment of trace elements in groundwater through geostatistical modelling,Ecotoxicology and Environmental Safety. 189.110038.
- Guo W, Wu T, Jiang G, Pu L, Zhang J, Xu F, Yu H, Xie X. (2021).Spatial Distribution, Environmental Risk and Safe Utilization Zoning of Soil Heavy Metals in Farmland, Subtropical China. Land. 10(6):569.
- Tiwari S, Coble KH, Barnett BJ, Harri A.(2021). Hedging the Price Risk Inherent in Revenue Protection Insurance. Journal of Agricultural and Applied Economics. 53(4):510-530.
- Marković Todor, Kokot Željko, Veličković Stevan.(2020) Area revenue insurance as a risk management instrument in Serbian agriculture. Ratar povrt.57(2).43-48.
- Duarte, Gislaine Vieira and Ozaki, Vitor A.(2023).Modeling multivariate time series with copulas: Implications for pricing revenue insurance.Revista Brasileira de Economia.77.e102023
- Zizheng Guo, Yu Shi, Faming Huang, Xuanmei Fan, Jinsong Huang.(2021). Landslide susceptibility zonation method based on C5.0 decision tree and K-means cluster algorithms to improve the efficiency of risk management, Geoscience Frontiers,12(6),101-249.
- Shi, P., & Lee, G. Y. (2022). Copula regression for compound distributions with endogenous covariates with applications in insurance deductible pricing. Journal of the American Statistical Association, 117(539), 1094-1109.
- Hirbod Assa, Hossein Sharifi, Andrew Lyons.(2021).An examination of the role of price insurance products in stimulating investment in agriculture supply chains for sustained productivity. European Journal of Operational Research, 288(3), 918-934,
- Shi, P., & Zhao, Z. (2020). Regression for copula-linked compound distributions with applications in modeling aggregate insurance claims. The Annals of Applied Statistics, 14(1), 357-380.
- Lee, W. J., Mendis, G. P., Triebe, M. J., & Sutherland, J. W. (2020). Monitoring of a machining process using kernel principal component analysis and kernel density estimation. Journal of Intelligent Manufacturing, 31, 1175-1189.
- Hua Guo, Yuliang Qi, Zhiyuan Xiu, and Guoqing Wang.(2022). Revenue and Expenditure Forecast and Cloud Audit Warning of Pension Insurance Fund for Urban Workers Based on Neural Network. ICSIE’22: Proceedings of the 11th International Conference on Software and Information Engineering.92-96.
- Qi, LM., Zhu, HJ., Geng, XZ. et al.(2023). Premium rate making of jujube revenue insurance in Xinjiang Aksu Region based on the mixed Copula-stochastic optimization model. J Comb Optim 45, 91-113.
- Magnuson JA, Hobbs J, Yakkanti R, Gold PA, Courtney PM, Krueger CA.(2024). Lower Revenue Surplus in Medicare Advantage Versus Private Commercial Insurance for Total Joint Arthroplasty: An Analysis of a Single Payor Source at One Institution. J Arthroplasty. 39(1).26-31.e1.
- Kularatne, T. D., Li, J., & Pitt, D. (2021). On the use of Archimedean copulas for insurance modelling. Annals of Actuarial Science, 15(1), 57-81.
- Benson, S., Burroughs, R., Ladyzhets, V., Mohr, J., Shemyakin, A., Walczak, D., & Zhang, H. (2020). Copula models of economic capital for life insurance companies. North American Actuarial Journal (under review).
- Wolny-Dominiak, A., & Żædlo, T. (2022). Copula-based risk measures in non-life insurance portfolio. Procedia Computer Science, 207, 2610-2617.
- Kamalov, F. (2020). Kernel density estimation based sampling for imbalanced class distribution. Information Sciences, 512, 1192-1201.
- Mammola, S., & Cardoso, P. (2020). Functional diversity metrics using kernel density n‐dimensional hypervolumes. Methods in Ecology and Evolution, 11(8), 986-995.