
Behavioral Intentions toward the Adoption of Halal Auditing Mobile Apps in Malaysia
- Nur Aaina Athira Hamdan
- Zuhra Junaida Mohamad Husny Hamid
- Mohd. Iskandar Illyas
- Suhana Jamaian
- 880-898
- Mar 3, 2025
- Education
Behavioral Intentions toward the Adoption of Halal Auditing Mobile Apps in Malaysia
Nur Aaina Athira Hamdan1, Zuhra Junaida Mohamad Husny Hamid2*, Mohd. Iskandar Illyas3, Siti Suhana Jamaian4
Department of Mathematics and Statistics, Universiti Tun Huession Onn Malaysia1
Department of Urban and Regional Planning, Universiti Teknologi Malaysia2
Azman Hashim International Business School, Universiti Teknologi Malaysia3
Faculty of Applied Sciences and Technology, Universiti Tun Hussein Malaysia4
*Corresponding Author
DOI: https://dx.doi.org/10.47772/IJRISS.2025.9020071
Received: 28 January 2025; Accepted: 31 January 2025; Published: 03 March 2025
ABSTRACT
Obtaining halal certification is essential for companies to establish consumer trust in their products. However, the traditional, manual certification process poses significant challenges for halal auditors due to the extensive time needed to prepare checklists and complete applications. While technological advancements have transformed many industries, the halal sector, particularly the certification process, has seen limited adoption of these innovations. Nevertheless, some auditors are open to using technology to streamline their work. This study investigates the factors influencing the adoption of mobile auditing applications for halal certification using the Unified Theory of Acceptance and Use of Technology (UTAUT) model. The model examines eight factors: performance expectancy, effort expectancy, social influence, facilitating conditions, attitude toward technology, self-efficacy, anxiety, and behavioural intention. The study surveyed 552 users of mobile auditing apps in halal certification processes. Findings indicate that direct factors: performance expectancy, effort expectancy, social influence, facilitating condition and indirect factors: self-efficacy and attitude towards using the technology positively impact the intention to adopt these applications.
Keywords: UTUAT, halal auditing, mobile apps, intention behavior
INTRODUCTION
The halal industry is diverse, catering to a significant market with products manufactured following Islamic law. To ensure halal compliance, every production activity undergoes verification and certification processes (Mohd Sulaiman et al., 2018). Obtaining Halal Certification (HC) involves meticulous auditing, as stated by Petiwala et al. (2021), making it a challenging yet essential process. The adoption of technology is recognized as a potential solution, considering its evolving role in the industry (Mohd Sulaiman et al., 2018).
In Malaysia, HC, awarded by the Department of Islamic Development Malaysia (JAKIM), follows strict standards and criteria (Fadzil, 2022). Halal auditors must meticulously assess various aspects, including documentation, handling, storage, and hygiene, in adherence to established rules (MPPHM, 2020). Research highlights challenges in managing the HC duration, emphasizing the importance of systematic checklists and thorough preparation (Muhammad et al., 2020; Amin, 2021). The process of obtaining HC in Malaysia involves internal audits before external authorities conduct their assessments. Developing a comprehensive checklist, as emphasized by Irfan & Iskandar (2017), is time-consuming due to the analysis of multiple standards and laws. Companies face difficulties meeting HC requirements, leading to rejections and increased energy, time, and cost for executives (Muhammad et al., 2020; Fadzil, 2022). Manual auditing, conducted with paper and pens, further compounds the challenges (Fadzil, 2022).
As Malaysia aspires to embrace the Industrial Revolution 4.0, there is a growing recognition of the need for technological advancements in the halal industry. QuikHalal, a cloud-based mobile application, exemplifies this shift by simplifying the halal auditing process (Nowlan, 2013). Despite the potential benefits of technology adoption in enhancing efficiency and transparency, its application in the halal industry remains limited (Widiani & Abdullah, 2018). The study aims to identify factors influencing halal auditors’ intentions to adopt such technological solutions using the Unified Theory of Acceptance and Use of Technology (UTUAT) method.
LITERATURE REVIEW
Halal Industry
Halal represents a symbol of legality, permissibility, and wholesomeness in the context of Islam, emphasizing security, quality, and hygiene (Soraji et al., 2017). The global Muslim population’s growth has propelled the halal industry into a transformative phase, encompassing pharmaceuticals, cosmetics, healthcare, finance, manufacturing, tourism, and food and beverage (Hidayat & Musari, 2022). Halal Certification (HC) is essential for businesses, especially in the food industry, ensuring sustainability and meeting consumer expectations. Certification acts as a mark of quality and compliance with Islamic dietary requirements, driving consumer demand for halal products (Ab Talib et al., 2017).
Malaysia, with a large Muslim population, plays a significant role in the halal industry. HC, managed by JAKIM, has evolved since its inception in 1974, ensuring adherence to specific requirements (Kamaruddin et al., 2012). Malaysia has become one of the top five nations dominating the global halal market, attracting Middle Eastern tourists and investments (Mat et al., 2020). The application process involves various considerations, such as hygiene, quality, and security, in the evaluation of products and goods. HC, though not compulsory, is viewed as a crucial standard by Muslims, contributing to economic progress and driving the halal industry forward (Batu & Regenstein, 2014; Mohamad Nordin Ibrahim, 2019). The HC application process, as outlined in the Manual Procedure for Malaysia Halal Certification 2020, involves document approval, site inspection, application approval, and enforcement and monitoring, providing a structured approach to halal certification in Malaysia (Noordin, 2013).
Halal Audit
Halal Audit, a systematic and independent evaluation process, ensures compliance with halal standards (ISO 9000:2000). It involves on-site inspections to verify the adherence of systems and processes in the halal industry (Maidhili & Nithyanandam, 2017). While businesses claim halal compliance, audits provide evidence to assess and guarantee the level of compliance, ensuring consumer trust (Fadzil, 2022). Audits evaluating a company’s alignment with halal certification requirements, play a crucial role in the halal industry (Mohamad & Othman, 2009).
Halal auditors, categorized as internal and external, play distinct roles. Internal auditors, focusing on the company, conduct first-party audits to monitor operations (IIA, 2010). External auditors, representing authorities like JAKIM and State Islamic Religious Council (JAIN), ensure compliance through technical and Shariah audits. These audits examine halal documents and premises to ensure adherence to standards and regulations, preventing potential contamination risks (Rahman et al., 2020).
Three types of halal audits – adequacy, field, and follow-up audits – are conducted, each serving a specific purpose (JAKIM, 2020). Adequacy audits assess documents and systems for halal certification, while field audits ensure on-site compliance with halal standards. Follow-up audits verify the corrective actions taken after initial audits. Auditors must follow a structured process, including opening and closing meetings, to ensure smooth audits and eliminate non-conformance (Jais, 2016). The applicant must cooperate and assist auitors throughout these audits, crucial for the halal authorities’ assessment and certification decisions.
Technology Adoption
Technology plays a crucial role in the halal industry, enhancing efficiency and accessibility. Various technologies, such as mobile phones and web-based applications, have been developed to support the Halal Certification (HC) process. However, the focus has primarily been on consumer-centric technologies, leaving a gap in aiding industry players and authorities involved in auditing processes (Husny et al., 2018). The lack of emphasis on technology adoption for industry and auditing purposes results in time-consuming processes for auditors during certification renewals and applications. Mobile-based technology emerges as a pivotal tool in the halal industry, especially with the development of mobile applications like QuikHalal. These apps cater to both consumer needs, providing information on halal status, and industry requirements, assisting auditors in their tasks. The positive impact of mobile apps is evident in their ability to streamline audit activities, cut down costs, and enhance productivity in preparing checklists (Irfan & Iskandar, 2017; Ahmad et al., 2019). The introduction of QuikHalal, a cloud-based mobile app designed explicitly for halal auditing, signifies a step towards digital innovation in the industry. Developed to assist JAKIM in halal audit verification, it simplifies the entire audit lifecycle. QuikHalal’s functionalities include evidence collection through photos, customizable checklists based on business type, and automatic report generation (HOLISTICS Lab, 2017; Irfan & Iskandar, 2017). It not only expedites the auditing process but also ensures that all necessary documentation is digitally stored, eliminating concerns about physical storage space. The app’s performance matrices, instant updates with new standards, and the ability to monitor compliance make it a comprehensive solution for efficient halal auditing (Rahman et al., 2020; Salama, 2017; Ahmad et al., 2019).
Adoption Theories of Technology
Several technology adoption theories provide valuable insights into how end users decide to embrace specific technologies. Prominent models include the Technology-Organization-Environment (TOE) framework introduced by Tornatzky and Fleischer (1990), which examines how technological, organizational, and environmental factors collectively influence technology adoption. Technological Frames of Reference (TFR) explores how organizations reduce incongruities among members through technology integration, Technology Acceptance Model (TAM) developed by Davis (1986), focuses on user behavior by evaluating perceived usefulness and ease of use, Diffusion of Innovation (DOI) Theory explains how innovations spread over time within specific social systems, and Unified Theory of Acceptance and Use of Technology (UTAUT) introduced by Venkatesh et al. (2003), integrates multiple models to predict user adoption and actual technology usage, emphasizing key factors such as performance expectancy, effort expectancy, social influence, and facilitating conditions. These models offer a theoretical foundation to analyze the success or failure of technological applications across different contexts, considering factors such as organizational dynamics, user perceptions, technological frames of reference, and the diffusion of innovations.
Among these models, UTAUT has emerged as one of the most comprehensive frameworks for understanding technology adoption. Empirical studies have demonstrated its superiority over previous models in predicting technology acceptance (Šumak & Šorgo, 2016). UTAUT consolidates insights from eight major theoretical models, including the Theory of Reasoned Action (TRA), TAM, Motivational Model (MM), Theory of Planned Behavior (TPB), Combined TAM and TPB (CTAMTPB), PC Usage Model (MPCU), DOI, and Social Cognitive Theory (SCT). The model identifies four primary factors that directly influence technology adoption: performance expectancy (PE), effort expectancy (EE), social influence (SI), and facilitating conditions (FC). While factors such as anxiety (ANXI), self-efficacy (SE), and attitude towards technology (AT) play a role in shaping perceptions, they do not directly impact behavioral intention (Venkatesh et al., 2003). According to UTAUT, the actual usage of technology is primarily determined by behavioral intention (BI), which is significantly influenced by PE and EE (Venkatesh et al., 2003; Šumak & Šorgo, 2016; Hoque & Sorwar, 2017; Khalilzadeh et al., 2017; Šumak et al., 2017).
Numerous studies have successfully applied UTAUT to various fields, particularly in auditing and financial technology. For instance, Mustika et al. (2023) and Thottoli & Thomas (2022) explored the adoption of computer-assisted audit techniques and enterprise resource planning (ERP) software among auditors. Malik et al. (2017) applied UTAUT to investigate the factors influencing consumer attitudes toward adopting and continuously using mobile applications for hedonic and utilitarian purposes. Similarly, Foon & Fah (2011) utilized UTAUT to study internet banking adoption. Other researchers, such as Wijaya et al. (2022), Al-Mamary (2022), and Shaqrah & Almars (2022), extended the UTAUT framework to examine digitalization trends in education. These diverse applications highlight the model’s versatility and effectiveness in predicting technology adoption across different industries and user contexts.
By integrating insights from various adoption theories, particularly UTAUT, researchers and practitioners can better understand the factors driving technology acceptance and identify strategies to enhance adoption rates. This comprehensive approach is crucial for ensuring the successful implementation of digital solutions in industries such as Halal auditing, finance, and education.
Research Model and Hypothesis
The existing literature and theoretical models on technology adoption were studied to review the factors that encourage customer adoption of an app. The most similar research by Thottoli & Thomas, (2022) and Salsabila et al., (2022) also implements the direct factors only; Performance Expectancy, Effort Expectancy, Social Influence and Facilitating Condition only for their research. The conceptual of this research can be referring in Figure 1 where indirect factors will be included as there is lack of research that implements all the factors suggested by (Venkatesh et al., 2003). Strengthen by (Taylor and Todd, 1995) that included all the factors will provide a more comprehensive review of the research environment.

Fig1 Conceptual Model
Performance Expectancy
Performance expectancy (PE) is defined as “the degree to which an individual believes that using the system will help him or her attain gains in job performance” (Venkatesh et al., 2003). Performance expectancy is based on concepts from the TAM, TAM2, CTAMTPB, MM, MPCU, DOI and SCT (i.e., perceived usefulness, extrinsic motivation, job-fit, relative advantage, and outcome expectations). It is the most powerful predictor of intention to use and is important in both voluntary and mandatory settings (Zhou, Lu, & Wang, 2010; Venkatesh, Thong, & Xu, 2012). Therefore, in this study, the researcher wants to determine if PE significantly influences the BI of halal auditors to adopt halal auditing apps.
H1: Performance expectancy significantly influences the behavioral intention of halal auditors to adopt halal auditing apps.
Effort Expectancy
Effort expectancy (EE) or ease of use is defined as “the degree of ease associated with the use of the system”, (Venkatesh et al., 2003). Any technology is deemed to be useful if a consumer can easily use it or if the technology’s operation requires little or no effort (Ghalandari, 2012). While Tang, (2016) add that when adopters find a mobile app that is less complicated and easier to use, they are more likely to utilize it. Teo and Noyes (2012) conducted a study of Singapore trainee teachers and discovered, using a Structural Equation Method technique, that EE strongly influences individual BI’s usage of information technology. Additionally, Tan, Sim, Ooi, and Phusavat (2011) revealed that the BI’s adoption of m-learning is highly influenced by perceived ease of use using multiple regression. Therefore, in this study, the researcher wants to determine if EE significantly influences the BI of halal auditors to adopt halal auditing apps.
H2: Effort expectancy significantly influences the behavioral intention of halal auditors to adopt halal auditing apps.
Social Influence
Social influence (SI) is defined as “the degree to which an individual perceives that important others believe he or she should use the new system”, (Venkatesh et al., 2003). According to Taylor et al. (2011) survey of institutions in the Midwest of the United States, students’ adoption and usage of mobile apps is largely affected by their peers as opposed to their family members. Furthermore, Leong et al., (2013a), utilizing survey questions that were gathered from mobile device users in Malaysia via SEM, demonstrated that SI plays a crucial role in persuading the BI to utilize m-entertainment. These empirical investigations concur that SI has a key role in persuading the BI to use mobile technologies. Therefore, in this study, the researcher wants to determine if SI significantly influences the BI of halal auditors to adopt halal auditing apps.
H3: Social influence significantly influences the behavioral intention of halal auditors to adopt halal auditing apps.
Facilitating Condition
Facilitating condition (FC) is defined as “the degree to which an individual believes that an organizational and technical infrastructure exists to support the use of the system”, (Venkatesh et al., 2003). FC strongly affects behavioral intention for 3G mobile telecommunication services, according to Wu et al., (2008). This empirical research concurs that FC plays a big role in persuading the BI to use technology. While Teo et al., (2012) countered that there was no significant effect of FC on the BI’s adoption of technology. Therefore, in this study, the researcher wants to determine if FC significantly influences the BI of halal auditors to adopt halal auditing apps.
H4: Facilitating condition significantly influences the behavioral intention of halal auditors to adopt halal auditing apps.
Anxiety
In the theory, even though anxiety (AX) is identified as not significant for their study, this factor will be use in this study to identify the significant of AX with behavioral intention of halal auditors to adopt halal auditing apps. Carlsson et al., (2006) study was tested the anxiety has no significant of intention behavior in adoption new mobile apps. However, in this study, the researcher wants to determine if AX significantly influences the BI of halal auditors to adopt halal auditing apps.
H5: Anxiety significantly influences the behavioral intention of halal auditors to adopt halal auditing apps.
Self – Efficacy
Self-efficacy (SE) refers to a user’s view of his or her own talents, which is fundamentally an individual’s subjective evaluation and can have a substantial impact on the user’s intention to adopt (Balapour et al., 2019). In the theory, even though SE is identified as not significant for their study. However, this factor will be used in this study to identify the significance of SE with BI of halal auditors to adopt halal auditing apps.
H6: Self-efficacy significantly influences the behavioral intention of halal auditors to adopt halal auditing apps.
Attitude towards using technology
The definition of this factor is “an individual’s positive or negative feelings about performing the target behavior”, (Venkatesh et al., 2003). In the theory, even though this factor does not have direct significance towards intention behavior, in this study, to test if the factor is significantly influencing the BI of halal auditors to adopt halal auditing apps will be done.
H7: Attitude towards using technology significantly influences the behavioral intention of halal auditors to adopt halal auditing apps.
RESEARCH METHOD
Sampling
Halal certification (HC) plays a crucial role in ensuring compliance with Islamic dietary laws. According to Baharuddin & Ismail (2018), as of 2018, there were 5,726 companies registered with JAKIM for halal certification. More recent data from JAKIM’s website indicates that 9,273 HC certifications were issued in 2022. Additionally, HOLISTICS Lab Sdn. Bhd. reports that 2,157 users had registered for the QuikHalal mobile auditing app as of 2023. This study employs convenience sampling, a type of non-probability sampling, due to the accessibility of respondents and their prior experience using Halal auditing mobile apps, as they have direct exposure and practical insights into the adoption process. The targeted respondents are halal auditors in Malaysia with prior experience using such apps. A total of 552 valid responses were collected for analysis. While convenience sampling offers practical advantages and cost-effective choice, this study acknowledges the potential bias in respondent selection, as it may not fully represent the broader population of halal auditors. Future research should consider probability-based sampling techniques to enhance the generalizability of findings.
Instrument
This study utilizes a Likert Scale for survey measurement. The Likert Scale is a widely used psychometric scale that quantifies respondents’ attitudes, perceptions, and opinions (Taherdoost, 2019). The scale, originally developed by Rensis Likert in 1932 (Likert, 1932), facilitates structured and standardized responses. With regard to the Likert scale, a score of one (1) indicates strongly disagree, a score of two (2) indicates disagree, a score of three (3) indicates disagreement in a moderate way, a score of four (4) indicates agreement, and a score of five (5) indicates strongly agreement. The 5-point scale was selected for its ease of interpretation and respondent familiarity. However, the study recognizes the limitations of relying solely on quantitative data. While qualitative methods provide deeper insights into user motivations, the study focuses on quantitative analysis for generalizability, objectivity, and statistical validation of findings. The structured nature of the study ensures that results can be measured, compared, and modeled effectively. Future research should incorporate qualitative methods, such as interviews or focus groups, to gain deeper insights into user motivations and concerns regarding mobile halal auditing apps.
Analysis
Pilot Test
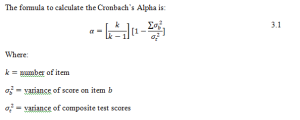
A comprehensive pilot test was executed, involving the distribution of the questionnaire to a group of 20 respondents, halal auditor in Malaysia that have experience using the QuikHalal. To determine the reliability of the questionnaire in the pilot study, Cronbach’s alpha method, a widely recognized measure for assessing the internal consistency and dependability of summated rating scales, was applied (Cronbach, 1951).
Table 1 – Pilot Test Summary
| Variable | Cronbach’s Alpha | No. Items |
| Performance Expectancy | 0.915 | 4 |
| Effort Expectancy | 0.854 | 4 |
| Social Influence | 0.883 | 4 |
| Facilitating Condition | 0.928 | 6 |
| Anxiety | 0.943 | 4 |
| Self- Efficacy | 0.878 | 4 |
| Attitude Towards Using Technology | 0.793 | 4 |
| Behavioural Intention to Use the System | 0.883 | 4 |
Reliability Analysis
The first analysis after the data collection is the reliability test which it used to evaluate the consistency of measurement tools that frequently make use of questionnaires (Mishra et al., 2019).The reliability coefficients of the items used in the study surpass the minimum level of significance proposed by Nunnally and Bernstein (1994) and Pallant, (2010), which is 0.70. However, Gorge and Mallery, (2003) wrote that the rule of thumb for Cronbach’s Alpha is as follows: “>.9 – Excellent, >.8 – Good, >.7 – Acceptable, >.6 – Questionable, >.5 – Poor and <.5 Unacceptable.
Hypothesis Testing
The hypotheses testing was done by analyzing correlation coefficients between each of the independent variables and the dependent variable. A nonparametric metric called Spearman’s rank correlation or “rank-order correlation coefficient” or “rank correlation coefficient” evaluates the direction and strength of monotonic correlations between ordinal variables meaning that as one variable increases or decreases, the other variable tends to also increase or decrease, respectively (Guetterman, 2019). It is robust against outliers and does not assume linearity or normality. The relationships between ordinal independent variables and ordinal dependent variables can be accessed without assuming anything about the underlying distributions of the variables by using Spearman’s rank correlation coefficient. Likert scale data frequently include monotonic relationships between ordinal variables, which makes this method appropriate for evaluating such correlations.
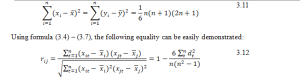
According to Wiśniewski, J., (2022), the Spearman “rank correlation coefficient” commonly used in such situations, has been transformed from the Pearson correlation coefficient for the case of sequences of a pair of natural numbers with n observation. The Pearson correlation coefficient, written in its general form:
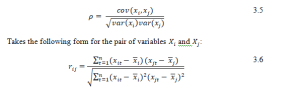
When the observations on the variables and are natural numbers (obviously, observations in the form of natural numbers don’t act as ranks here but are numbers on a quotient scale. Such cases, however, are extremely rare in statistical and econometric research.), i.e., n, n, then the correlation coefficient (3.2) can transform into Spearman rank coefficient:
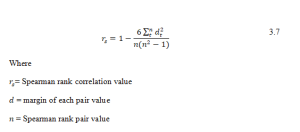
In the above formula, denotes the differences between the observations of simultaneous value of a pair of random variables in the form of natural numbers (t = 1, n). As such, the coefficient (3.3) when the observations on each pair of the variables are natural numbers belonging to the results of ratio measurement.
Suppose that the observations on variables X and Y form sequences of natural numbers with n observations, that is, and . The sums of the observations on the two variables in such case are as follows (Cf. Steczkowski J., Zelia A. (1981):
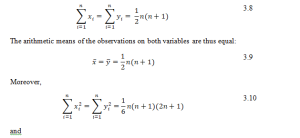
Application of Spearman Rank correlation coefficient for pair of variables with natural number observations is therefore equivalent to the use of Pearson correlation coefficient. For this study, SPSS statistical software is used to calculated the Spearman Rank correlation coefficient.
Referring to Schober et. al, 2018, Spearman coefficients, like Pearson coefficients, vary-1 to +1. It can
describe anything from no association (ρ = 0) to a perfect monotonic relationship (ρ = -1 or +1). Spearman Rank Correlation Coefficients (denoted by r) measure the strength and direction of the association between two variables and the result will comply the RO1. The values of r range from -1 to 1. To interpret the Spearman correlation, the following guidelines shown in table 3.5 can be used (Schober et al., 2018):
Table 3.5 Strength of relationship
| Value (range) | Association (strength) |
| ρ = 0 | No monotonic relationship |
| 0 < |ρ| < 0.3 | Weak monotonic relationship |
| 0.3 ≤ |ρ| < 0.5 | Moderate monotonic relationship |
| |ρ| ≥ 0.5 | Strong monotonic relationship |
The same considerations as outlined above for a Pearson correlation apply to the interpretation of confidence intervals and P values for a Spearman coefficient (Schober et al., 2018). And to achieve RO2, the significance level can be tested with the value of significance (2-tailed) to ascertain whether the link is significant at the level of 0.01. The resultant p-value must be compared with the significance level (abbreviated as alpha, α) in order to establish whether the correlation between the variables is significant (Fadhil et al., 2007). The correlation’s p-value indicates if it differs significantly from zero. First, if the p-value is less than or equal to the significance level, the correlation is regarded as statistically significant and distinct from zero (Sekaran, 2003). Second, if the p-value is larger than the significance level, it can be assumed that the link is not statistically significant (Sekaran, 2003).
RESULT AND DISCUSSION
This study has developed a research instrument for investigating the factors of behavioural intention influencing the adoption of halal mobile auditing apps among halal auditor in Malaysia. The main theory used in this study is the UTUAT model which posits that the elements of performance expectancy, effort expectancy, social influence, facilitating conditions, attitude towards using technology, self-efficiency, anxiety, and behavioural intention to use technology.
Reliability
Following the successful pilot test of factors influencing behavioral intention to adopt mobile auditing, the instrument was distributed to 2,157 users, yielding feedback from 552 respondents. The reliability of all factors was deemed satisfactory, with Cronbach’s Alpha values exceeding 0.5, except for the anxiety factor, as shown in Table 2.
Table 2 – Reliability Test Summary
| Code | Variable | Cronbach Alpha | No. Items |
| PE | Performance Expectancy | 0.930 | 4 |
| EE | Effort Expectancy | 0.918 | 4 |
| SI | Social Influence | 0.883 | 4 |
| FC | Facilitating Condition | 0.911 | 4 |
| ANX | Anxiety | 0.669 | 6 |
| SE | Self- Efficacy | 0.936 | 4 |
| AT | Attitude Towards Using Technology | 0.889 | 4 |
| BI | Behavioural Intention to Use the System | 0.916 | 4 |
The result of the reliability test shows all the variables pass the test where performance expectancy, effort expectancy, facilitating condition, self – efficacy and behavioral intention to use the apps got an excellent reliability 0.930, 0.918, 0.911, 0.936, 0.916 respectively. While social influence and attitude towards using technology values is 0.883 and 0.889 is categorized as high reliable. And lastly, for anxiety got 0.669 which is still pass but moderate reliability. Therefore, we can test all the variables correlation since it was pass the reliability test.
Analysis Result
This study examined the relationships between key variables influencing technology adoption, including Performance Expectancy (PE), Effort Expectancy (EE), Attitude Toward Technology (AT), Social Influence (SI), Facilitating Conditions (FC), Self-Efficacy (SE), Anxiety (ANXI), and Behavioral Intention (BI). Spearman’s rank correlation analysis was performed to evaluate these relationships. The results, presented in Table 5, reveal several significant correlations among the variables, offering valuable insights into the factors shaping technology adoption.
Table 5 – SPSS Non-parametric Spearman Rank Correlation
| PE | EE | AT | SI | FC | SE | ANXI | BI | ||
| PE | Correlation Coefficient | 1.000 | .738** | .741** | .505** | .844** | .533** | -.115** | .573** |
| Sig. (2-tailed) | . | .000 | .000 | .000 | .000 | .000 | .007 | .000 | |
| N | 552 | 552 | 552 | 552 | 552 | 552 | 552 | 552 | |
| EE | Correlation Coefficient | .738** | 1.000 | .687** | .501** | .703** | .484** | -.121** | .575** |
| Sig. (2-tailed) | .000 | . | .000 | .000 | .000 | .000 | .005 | .000 | |
| N | 552 | 552 | 552 | 552 | 552 | 552 | 552 | 552 | |
| AT | Correlation Coefficient | .741** | .687** | 1.000 | .651** | .742** | .606** | -.143** | .648** |
| Sig. (2-tailed) | .000 | .000 | . | .000 | .000 | .000 | .001 | .000 | |
| N | 552 | 552 | 552 | 552 | 552 | 552 | 552 | 552 | |
| SI | Correlation Coefficient | .505** | .501** | .651** | 1.000 | .526** | .595** | .172** | .652** |
| Sig. (2-tailed) | .000 | .000 | .000 | .000 | .000 | .000 | .000 | .000 | |
| N | 552 | 552 | 552 | 552 | 552 | 552 | 552 | 552 | |
| FC | Correlation Coefficient | .844** | .703** | .742** | .526** | 1.000 | .507** | -.096* | .577** |
| Sig. (2-tailed) | .000 | .000 | .000 | .000 | . | .000 | .025 | .000 | |
| N | 552 | 552 | 552 | 552 | 552 | 552 | 552 | 552 | |
| SE | Correlation Coefficient | .533** | .484** | .606** | .595** | .507** | 1.000 | .163** | .580** |
| Sig. (2-tailed) | .000 | .000 | .000 | .000 | .000 | . | .000 | .000 | |
| N | 552 | 552 | 552 | 552 | 552 | 552 | 552 | 552 | |
| ANXI | Correlation Coefficient | -.115** | -.121** | -.143** | .172** | -.096* | .163** | 1.000 | .043 |
| Sig. (2-tailed) | .007 | .005 | .001 | .000 | .025 | .000 | . | .316 | |
| N | 552 | 552 | 552 | 552 | 552 | 552 | 552 | 552 | |
| BI | Correlation Coefficient | .573** | .575** | .648** | .652** | .577** | .580** | .043 | 1.000 |
| Sig. (2-tailed) | .000 | .000 | .000 | .000 | .000 | .000 | .316 | .0000 | |
| N | 552 | 552 | 552 | 552 | 552 | 552 | 552 | 552 | |
| **. Correlation is significant at the 0.01 level (2-tailed). | |||||||||
| *. Correlation is significant at the 0.05 level (2-tailed). | |||||||||


Figure 2 Indirect Factors scatter plot with Behavioral Intention
H1: Performance expectancy significantly influences the behavioral intention of halal auditors to adopt halal auditing apps.
PE represents the belief that using QuikHalal improves job performance or productivity. Results show a significant and positive relationship between PE and behavioral intention (BI) (r=0.573, p=0.01). This indicates that higher PE is associated with greater intention to adopt QuikHalal, aligning with UTAUT findings by Venkatesh et al. (2003). The scatter plot in Figure 1(a) illustrates a moderate monotonic relationship, confirming that as PE increases, so does BI. The statistical significance supports H1, highlighting PE as a key determinant in the halal auditing context.
The correlation coefficient (r=0.573) shows that PE has a moderate effect on BI, indicating that while other factors may also influence adoption, perceived performance improvement plays a substantial role. This aligns with previous studies in other industries, such as Salsabila et al. (2022) in the electricity sector, confirming that performance-driven perceptions consistently motivate technology adoption. These findings suggest that emphasizing the productivity and efficiency benefits of QuikHalal could encourage more auditors to adopt the app, reinforcing its value as a tool for improving audit processes.
H2: Effort expectancy significantly influences the behavioral intention of halal auditors to adopt halal auditing apps.
EE reflects the degree of ease associated with using QuikHalal. Results reveal a significant positive relationship between EE and BI (r=0.575, p=0.01). Higher perceptions of ease of use correlate with a stronger intention to adopt the app, consistent with prior UTAUT-based studies. The scatter plot in Figure 1(b) confirms a moderate monotonic relationship between EE and BI. These results support H2, reinforcing that EE is a crucial factor influencing BI.
Ease of use is particularly important in reducing barriers to adoption, as demonstrated in similar studies, such as Patel et al. (2019), which identified EE as a significant predictor for mobile payment app adoption. The findings suggest that improving user-friendly design, simplifying onboarding processes, and minimizing technical challenges can significantly enhance the adoption rate of QuikHalal. By addressing EE, developers and policymakers can ensure the app appeals to a broader audience, particularly those less comfortable with technology.
H3: Social influence significantly influences the behavioral intention of halal auditors to adopt halal auditing apps.
SI measures the degree to which users perceive that important others encourage the use of QuikHalal. Results indicate a significant and strong positive relationship between SI and BI (r=0.652, p=0.01). This strong correlation highlights the importance of peer and organizational encouragement in driving adoption. The scatter plot in Figure 1(c) reflects a clear monotonic trend, supporting H3 and emphasizing SI’s impact on the adoption process.
The high correlation (r=0.652) suggests that social dynamics play a pivotal role in influencing auditors’ decisions to adopt QuikHalal. This aligns with findings in other sectors, such as Zhao et al,. (2021), where social influence significantly impacted online banking adoption. For QuikHalal, leveraging influential figures within organizations, such as senior auditors or management, and creating a culture of peer recommendation could significantly enhance adoption rates. This underscores the need for targeted marketing and awareness campaigns that involve key stakeholders.
H4: Facilitating condition significantly influences the behavioral intention of halal auditors to adopt halal auditing apps.
FC refers to the resources and support available to users for adopting QuikHalal. The study finds a significant positive relationship between FC and BI (r=0.577, p=0.01). Adequate facilitating conditions, such as training, infrastructure, and technical support, are associated with increased intention to use the app. The scatter plot in Figure 1(d) illustrates a moderate monotonic relationship, reinforcing the importance of FC in technology adoption.
A moderate correlation (r=0.577) underscores the value of a supportive environment in encouraging adoption. Similar to findings by Davis et al. (2020) on mobile learning applications, this study highlights that providing robust technical support and resources can alleviate user concerns and enhance confidence in technology use. For QuikHalal, this could include offering training workshops, user manuals, and dedicated support teams to ensure users feel equipped and supported throughout the adoption process.
H5: Anxiety significantly influences the behavioral intention of halal auditors to adopt halal auditing apps.
ANXI refers to users’ feelings of unease or worry about using QuikHalal. Results show a weak and non-significant relationship between ANXI and BI (r=0.033, p=not significant), suggesting minimal impact on adoption intentions. The scatter plot in Figure 2(e) illustrates the scattered nature of data points, indicating no clear monotonic trend. This finding does not support H5 and aligns with prior studies where anxiety showed limited influence on technology adoption.
While ANXI is not a strong predictor of BI in this study, addressing user concerns through comprehensive training and support remains essential. This is particularly relevant for users who may feel hesitant due to unfamiliarity with technology. By offering guided tutorials, in-app support, and reassurance about data security, organizations can reduce any latent anxiety and foster a more conducive environment for adoption.
H6: Self-efficacy significantly influences the behavioral intention of halal auditors to adopt halal auditing apps.
SE represents users’ belief in their ability to use QuikHalal effectively. Results indicate a significant positive relationship between SE and BI (r=0.580, p=0.01). Higher SE correlates with a stronger intention to adopt the app, as illustrated by the scatter plot in Figure 2(f), which demonstrates a moderate monotonic relationship. These findings support H6, confirming SE as a critical factor in technology adoption.
The correlation (r=0.580) highlights the importance of empowering users with confidence in their technological abilities. This is consistent with prior research, such as Kim et al. (2020), which showed SE as a key driver in adopting fitness tracking apps. For QuikHalal, providing user-friendly features, step-by-step guides, and consistent technical support can enhance SE, ultimately increasing adoption rates.
H7: Attitude towards using technology significantly influences the behavioral intention of halal auditors to adopt halal auditing apps.
AT reflects users’ positive or negative evaluation of QuikHalal. Results show a strong positive relationship between AT and BI (r=0.648, p=0.01), indicating that positive attitudes strongly influence adoption intentions. The scatter plot in Figure 2(g) demonstrates a clear monotonic trend, supporting H7 as a significant indirect factor in this study.
A strong correlation (r=0.648) reinforces the importance of cultivating a positive user perception of QuikHalal. Similar to findings by Williams et al. (2019) on mobile banking apps, fostering positive attitudes through effective marketing, user testimonials, and demonstrable benefits can significantly enhance adoption. Highlighting real-world success stories and emphasizing the app’s alignment with user needs can further strengthen positive attitudes and drive adoption rates.
SUMMARY OF RESULT
The key findings from this study reveal that PE, EE, SI and FC significantly influence BI to adopt QuikHalal, with SI and AT emerging as the strongest predictors. This indicates that while technological and infrastructural factors such as usability and available resources play a role, social and attitudinal influences have a greater impact on adoption decisions. The strong correlation of SI with BI suggests that peer recommendations, endorsements from senior auditors, and regulatory backing are crucial in driving adoption. Additionally, the significant effect of AT highlights the importance of shaping a positive perception of QuikHalal through effective branding and demonstrable benefits. While ANXI was found to have no significant influence on BI, suggesting minimal apprehension among auditors, it remains essential to offer adequate support and reassurance to sustain confidence in technology use. The findings emphasize the need for technology adoption strategies that focus on leveraging social influence, enhancing usability through intuitive design and training, reinforcing the productivity benefits of QuikHalal, and ensuring robust support systems. By addressing these factors, stakeholders can facilitate greater acceptance and integration of halal auditing technologies, ultimately improving audit efficiency and compliance within the industry.
CONCLUSION
In conclusion, this study underscores the critical role that mobile auditing technologies, such as QuikHalal, play in streamlining the Halal certification process. Attributes like speed, convenience, user-friendliness, integration, automated reporting, customizability, and data accessibility position these technologies as essential tools in addressing industry challenges. While Malaysia, through JAKIM, has established itself as a global leader in Halal certification, the process is often perceived as complex, costly, and time-consuming. Technological solutions can mitigate these challenges by improving efficiency, reducing errors, and simplifying document preparation and audit compliance.
This research highlights the significant influence of key behavioural factors—Performance Expectancy, Effort Expectancy, Social Influence, Facilitating Conditions, Self-Efficacy, and Attitude—on the adoption of Halal auditing technologies. Strengthening supportive conditions, such as infrastructure and technical resources, and leveraging social influences, such as peer and organizational encouragement, are pivotal in increasing adoption rates. Moreover, addressing ease of use and building user confidence through targeted training and user-friendly designs can further enhance adoption intentions.
Beyond behavioural factors, this study recognizes the need to address practical barriers to adoption. Financial constraints, such as the high cost of technology implementation and maintenance, may limit accessibility for smaller businesses. Technical limitations, including outdated infrastructure and system compatibility issues, could hinder seamless integration within existing certification frameworks. Additionally, regulatory constraints, such as stringent compliance requirements and bureaucratic hurdles, may slow the widespread implementation of mobile auditing solutions. Understanding and mitigating these barriers through policy improvements, industry incentives, and technological advancements are crucial for ensuring broader acceptance and successful implementation.
Future studies should expand the geographical scope to include auditors and stakeholders from diverse regions, enabling comparisons of adoption patterns across varying cultural, regulatory, and technological contexts. A longitudinal design could track changes in user behavior and perceptions over time, offering insights into the long-term impact of continued app usage and external factors such as policy updates and technological advancements. Additionally, incorporating qualitative methods, such as interviews and focus groups, would provide deeper insights into user motivations, concerns, and cultural influences. By addressing both behavioral and practical barriers, this research contributes to a more comprehensive understanding of technology adoption in the Halal industry and supports the advancement of a more efficient, accessible, and digitally driven Halal certification ecosystem.
REFERENCES
- Salsabila, A. P., Pratama, A., & Wulansari, A. (2022). Behavior Analysis on PLN Mobile Users Using UTAUT Method. Jurnal Riset Informatika, 5(1), 155-164.
- Ab Talib, M. S., Ai Chin, T., & Fischer, J. (2017). Linking Halal food certification and business performance. British Food Journal, 119(7), 1606-1618.
- Ahmad, N. A., Nordin, N., & Sulaiman, M. Z. M. (2019). Contemporary Management and Science Issues in the Halal Industry: Proceedings of the International Malaysia Halal Conference. Springer Singapore Pte. Limited. https://doi.org/10.1007/978-981-13-2677-6_27
- Amin, A. Z. M. (2021). Halal Auditing: The Study on the Effectiveness of Mobile Auditing Apps (QuikHalal) Towards Clients of Holistics Lab Sdn Bhd. Universiti Teknologi Mara: Thesis Degree.
- Baharuddin, S. A., & Ismail, R. M. (2018). Halal compliance impact on organizational performance: The role of religiosity. International Journal of Supply Chain Management, 7(5), 455-460.
- Balapour, A., Reychav, I., Sabherwal, R., and Azuri, J. (2019). Mobile technology identity and self-efficacy: Implications for the adoption of clinically supported mobile health applications. Int. J. Inform. Manage. 49, 58–68. doi: 10.1016/j.ijinfomgt.2019.03.005
- Batu, A., Regenstein, J.M. (2014). Halal food certification challenges and their implications for Muslim societies worldwide. In: International Periodical for the Languages, Literature and History of Turkish or Turkic, Turkish Studies, Ankara, Turkey, pp. 111–130.
- Carlsson, C., Carlsson, J., Hyvonen, K., Puhakainen, J., & Walden, P. (2006). Adoption of mobile devices/services-searching for answers with the UTAUT. In Proceedings of the 39th annual Hawaii international conference on system sciences (HICSS’06) (Vol. 6, pp. 132a-132a). IEEE.
- Davis, F. D. (1989). Perceived Usefulness, Perceived Ease of Use and User Acceptance of Information Technology. MIS Q, 319-340.
- Davis, F. D., Bagozzi, R. P., & Warshaw, P. R. (2020). User acceptance of computer technology: A comparison of two theoretical models. Management Science, 35(8), 982–1003.
- Fadzil, N. S. M. (2022), The Study on The Effectiveness Of Quikhalal Among The Halal Auditors. Universiti Teknologi Mara: Thesis Degree.
- Fornell, C.; Larcker, D.F. Evaluating structural equation models with unobservable variables and measurement error. J. Mark. Res. 1981, 18, 39–50.
- George, D., & Mallery, P. (2003). SPSS for Windows Step by Step: A Simple Guide and Reference (4th ed.). Allyn & Bacon.
- Guetterman, T. C. (2019). Basics of statistics for primary care research. Family medicine and community health, 7(2).
- Hair, J.F.; Sarstedt, M.; Ringle, C.M.; Mena, J.A. An assessment of the use of partial least squares structural equation modeling in marketing research. J. Acad. Mark. Sci. 2012, 40, 414–433.
- Hidayat, S. E., & Musari, K. (2022). ASEAN towards a global halal logistics through the digitally enabled community. International Journal of Asian Business and Information Management, 13(2). https://doi.org/10.4018/IJABIM.20220701.oa1
- Husny, Z. J. M., Tan, M. I. I., Sulong, N., Yusof, N. S., & Mazlan, M. N. A. (2018). Technology requirement for halal quality control. Journal of Fundamental and Applied Sciences, 10(2S), 399-412.
- Holistics Lab Sdn Bhd. (n.d.). Quik Halal | Halal Auditing Mobile Apps and Improve Halal Auditor productivity. QuikHalal. https://quikhalal.com/
- (2010). Measuring Internal Audit Effectiveness and Efficiency. IPPF Practical Guide. Institute of Internal Auditors (IIA) Report.
- Irfan, A., & Iskandar, M. (2017). Implementation of Halal Auditing Using Progressive Web Application.
- Jais, A. S. (2016). Halal Assurance System (HAS) for Foodservice Organizations and Food Manufacturers (1st ed.). Merlimau: Politeknik Merlimau Melaka
- (2020). Manual Prosedur Pensijilan Halal Malaysia (Domestik) 2020. http://www.halal.gov.my/v4/index.php?data=bW9kdWxlcy9uZXdzOzs7Ow==&utama=panduan&ids=gp1
- Kamaruddin, R., Iberahim, H., & Shabudin, A. (2012). Halal compliance critical control point (HCCCP) analysis of processed food. BEIAC 2012 – 2012 IEEE Business, Engineering and Industrial Applications Colloquium, 383–387. https://doi.org/10.1109/BEIAC.2012.6226088.
- Kim, Y., Chun, J. U., & Lee, H. (2020). Influence of self-efficacy on the adoption of fitness tracking applications: The mediating role of perceived usefulness and ease of use. Information Systems Research, 25(4), 788–803.
- Leong, L. Y., Hew, T. S., Tan, G. W. H., & Ooi, K. B. (2013a). Predicting the determinants of the NFC-enabled mobile credit card acceptance: A neural networks approach. Expert Systems with Applications, 40(14), 5604-5620.
- Likert, R. (1932). A Technique for the Measurement of Attitudes. Archives of Psychology, 22(140), 1–55.
- Maidhili, S., & Nithyanandam, K. (2017). External Audit and Non Conformance. International Journal of Library Science and Research (IJLSR), 7(2), 35-38.
- Manual Procedure for Malaysia Halal Certification (Third Revision) (2014). Retrieved from halal.gov.my/v4/images/pdf/MPPHM2014BI.pdf.
- Mat, N. K. N., Sulaiman, Y., Abdghani, N. H., & Mohamad, M. (2020). Halal Consumption Determinants: The Mediating Role of Risk Perception and Muslim Lifestyle. Malaysian Journal Of Consumer And Family Economics, 24. https://www.researchgate.net/publication/348233319.
- Mohamad, M. N., & Othman, N. (2009). Audit pengesahan halal: Kajian di Jabatan Kemajuan Islam Malaysia. Jurnal Penyelidikan Islam, 22, 19–54. https://myjurnal.mohe.gov.my/filebank/published_article/34073/Article_2.PDF.
- Mohd Sulaiman, M. Z., Noordin, N., Nor, N. L., Suhaimi, A. I. H., & Wan Mohd Isa, W. A. R. (2018). The issues of halal inspection process from the perspective of demand and supply side in malaysia halal certification system. Communications in Computer and Information Science, 886, 277–288. https://doi.org/10.1007/978-981-13-1628-9_25
- Noordin, N. (2013) Efficiency factors and ecosystem framework in Malaysian halal food certification system.
- Nunnally, J. C., & Bernstein, I. H. (1994), Psychometric theory. McGraw-Hill.
- Orlikowski, W. J., & Gash, D. C. (1994). Technological frames: making sense of information technology in organizations. ACM Transactions on Information Systems (TOIS), 12(2), 174-207.
- Pallant, J. (2010). SPSS Survival Manual: A Step by Step Guide to Data Analysis Using SPSS (4th ed.). Open University Press/McGraw-Hill.
- Patel, K., & Patel, R. (2019). Understanding the Dynamics of Mobile Banking Adoption in Rural Gujarat: A Longitudinal Study. Journal of Banking and Finance, 33(4), 321-335.
- Petiwala, F. F., Nawazish, H. N., Shukla, V. K., Sharma, R., & Nanda, I. (2021). Halal Food benefits and challenges: A Mobile Application based technical Review. In 2021 International Conference on Advance Computing and Innovative Technologies in Engineering (ICACITE) (pp. 139-144). IEEE.
- Rahman, N. A. A., Hassan, A., & Mohammad, M. F. N. (2020). Halal Logistics and Supply Chain Management in Southeast Asia. Taylor & Francis.
- (2017). UTM Researchers Invent Mobile App for Halal Certification. Retrieved from HalalFocus.net – Daily Halal Market News website: https://halalfocus.net/ malaysia-utm-researcher-invent-mobile -app-for-halal-certification/
- Salsabila, A. P., Pratama, A., & Wulansari, A. (2022). Behavior Analysis on PLN Mobile Users Using UTAUT Method. Jurnal Riset Informatika, 5(1), 155-164.
- Schober, P., Boer, C., & Schwarte, L. A. (2018). Correlation coefficients: Appropriate use and interpretation. Anesthesia & Analgesia, 126(5), 1763–1768. https://doi.org/10.1213/ANE.0000000000002864
- Sekaran, U. (2003). Research Methods for Business: A Skill-Building Approach(4th ed.). Wiley.
- Soraji, A. J., Awang, M. D., & Mohd Yusoff, A. N. (2017). Malaysia Halal Trust: Between Reality and Challenges. IJASOS- International E-Journal of Advances in Social Science, III (7). http://ijasos.ocerintjournals.org
- Steczkowski J., Zelia (1981): Statystycne metody nalizy cech jakosciowych Statistical methods for analysis of qualitative characteristics, PWE, Warszawa.
- Taherdoost, H. (2019). What Is the Best Response Scale for Survey and Questionnaire Design; Review of Different Lengths of Rating Scale / Attitude Scale / Likert Scale SSRN. 8(1), 1–10. https://papers.ssrn.com/sol3/papers.cfm?abstract_id=3588604.
- Tan, G. W. H., Sim, J. J., Ooi, K. B., & Phusavat, K. (2012). Determinants of mobile learning adoption: an empirical analysis. Journal of Computer Information Systems, 82-91.
- Taylor, S. and Todd, P. (1995). The Role of Prior Experience. MIS Quarterly, 19(4), 561-570.
- Taylor, D. G., Voelker, T. A., & Pentina, I. (2011). Mobile application adoption by young adults: A social network perspective. International Journal of Mobile Marketing, 6(2), 60-70.
- Teo, T., & Noyes, J. (2012). Explaining the intention to use technology among pre-service teachers: A multi-group analysis of the Unified Theory of Acceptance and Use of Technology. Interactive Learning Environments, 2(1), 51-66.
- Thottoli, M. M., & Thomas, K. V. (2022). ERP Software and Practicing Auditors: An Empirical Study Applying UTAUT Model. International Journal of Innovation in the Digital Economy (IJIDE), 13(1), 1-13.
- Tornatzky, L. and Fleischer, M. (1990) The process of technology innovation, Lexington, MA, Lexington Books.
- Venkatesh, V., Morris, M. G., Davis, G. B., & Davis, F. D. (2003). User acceptance of information technology: Toward a unified view. MIS quarterly, 425-478.
- Williams, K., Shaw, R., & Turner, D. (2019). Adoption of mobile banking apps: The role of attitudes, ease of use, and perceived security. International Journal of Banking and Finance, 15(2), 45–62.
- Wiśniewski, J. (2022). The possibilities on the use of the spearman correlation coefficient. International Electronic Scientific and Practical Journal “WayScience, 5(1), 151-162.
- Wu, Y. L., Tao, Y. H., & Yang, P. C. (2007, December). Using UTAUT to explore the behaviour of 3G mobile communication users. Paper presented at the Industrial Engineering and Engineering Management (IEEE, 2007) International Conference, Singapore.
- Zhou, T., Lu, Y. B., & Wang, B. (2010). Integrating TTF and UTAUT to explain mobile banking user adoption. Computers in Human Behavior, 26(4), 760-767.
APPENDIX 1: UTUAT QUESTIONNAIRE
| Construct | Corresponding Items | |
| Performance expectancy | PE1 | Technology can assist in halal audit process |
| PE2 | Technology can speed up the halal audit process | |
| PE3 | Technology can improve my productivity | |
| PE4 | Technology can improve the overall productivity of my organization | |
| Effort expectancy | EE1 | Technology provide a clear menu |
| EE2 | Technology is easy to understand | |
| EE3 | Technology is easy to use | |
| EE4 | Technology is easy to learn | |
| Attitude towards using technology | A1 | Using Technology l is a good idea |
| A2 | Using Technology makes managing halal audit more interesting | |
| A3 | Technology can assist the halal audit report generation | |
| A4 | I like using Technology | |
| Social Influence | SI1 | People who influence my behaviour think I should use Technology |
| SI2 | People who are important to me think I should use Technology | |
| SI3 | My peers think I should use Technology | |
| SI4 | Halal authorities has supported the use of Technology | |
| Facilitating condition | F1 | Technology can assist the checklist preparation process |
| F2 | Technology can assist the identification of checklist references (MPPHM/ MS) | |
| F3 | Technology can facilitate the evidence collection (photo) | |
| F4 | Technology can assist the non-compliance detection | |
| F5 | Technology can reduce the halal auditing time | |
| F6 | Technology can reduce the halal auditing cost | |
| SE1 | With Technology, I could complete most tasks without assistance | |
| SE2 | With Technology, I could complete most tasks if I could call someone for help | |
| SE3 | With Technology, I could complete most tasks with full confidence | |
| SE4 | With Technology, I could complete most tasks with just instruction provided | |
| Anxiety | ANX1 | I feel nervous using Technology due to complexity of the system |
| ANX2 | I feel worried if I hit the wrong button my information may not appear | |
| ANX3 | I hesitate to use Technology for fear of making mistakes | |
| ANX4 | Technology is somewhat intimidating to me | |
| Behavioural intention to use the system | BI1 | I intend to use Technology in the near future |
| BI2 | I intend to use Technology to comply Malaysia Halal certification procedure | |
| BI3 | I intend to use Technology to assist my job | |
| BI4 | I intend to use Technology l to replace the existing method |