
Board Structure and the Financial Stability of Banks in Nigeria
- Adeyemo M.O
- Ologunwa, O.P
- Obamuyi T.M
- 2430-2441
- Feb 21, 2024
- Accounting & Finance
Board Structure and the Financial Stability of Banks in Nigeria
Adeyemo M.O.1, Ologunwa, O.P.*2, Obamuyi T.M.3
1Polaris Bank Plc
2, 3Department of Economics, Federal University of Technology, Akure, Nigeria
*Corresponding Author
DOI: https://dx.doi.org/10.47772/IJRISS.2024.801178
Received: 03 January 2024; Revised: 18 January 2024; Accepted: 22 January 2024; Published: 21 February 2024
ABSTRACT
The stability and prosperity of any bank is to a large extent dependent on the integrity of its business and markets shares. This study therefore examined the effect of Board Structure (board size, board independence and board members affiliations) on Bank Financial Stability in Nigeria. The study employed quantitative research method with data spanning between 2010 and 2022. The descriptive statistics, which involved the characteristics of the existing corporate board structure of listed Banks in Nigeria showed that; no Bank in Nigeria has less than an average number of 10 Board members; that on the average, independent Board members account for 39% of the Board of Directors while 28% has the least affiliated Board members at the period of this study. The empirical results showed that Board size and the board independence have negative and significant effects on the Sharpe ratio of Nigerian Banks. This is an indication that Nigerian banks are highly sensitive to changes in Board independence and the reward to volatility ratio of banks fell approximately by 3% as Board size increased to 10%. Unlike the Board size and Board independence, Board affiliation has positive and significant effect on the Sharpe ratio of the Banks. In this regard, a 1% increase in Board affiliation will engender 0.4% improvement in the financial stability of Nigeria Banks. This follows that not only that the set of people made up of affiliated members are over-blotted but also that their impacts were positively felt in Nigeria Banks. Thus the study concludes that increase in Board size and Board independence inhibits financial stability of Nigeria Banks while Board affiliation, showed positive effect on financial stability. The study recommends that Nigeria banks should reduce Board size and critically look into the type of independent Board members employee while maintaining board affiliation in order to enhance financial stability
Keywords: Board Size, Board Independence, Board Members Affiliations and Financial Stability
INTRODUCTION
Board structure a mechanism of corporate governance refers to the size of the board, the level of independence of its members, and their affiliations. The size of the board refers to the number of directors, while board independence refers to the extent to which directors are free from any conflicts of interest. The Affiliations, on the other hand, refer to the connections and relationships that directors may have with other entities (Khalil & Chihi, 2020).
Bank structure specifies how the rights and responsibilities of various participants are distributed in the bank. The board, managers, shareholders and all other stakeholders are guided by specific rules and procedures for making decisions on corporate affairs (Karkowska & Acedański, 2020; Trinh et al., 2020; Abdelbadie & Salama, 2019; Abdul-Qadir & Kwanbo, 2012). Contrary wise, some scholars believe that corporate board structure directives motivate businesses to form and take disproportionate risks for short-term profit maximization, instead of addressing asymmetric information matters, controlling managerial opportunism, and redirecting management toward optimal behavior (Obamuyi et.al, 2011; Akindele et.al, 2012; Aguilera et.al, 2009; Kourtis et al., 2019).
Prior studies on board structure and bank stability are classified into two research directions. Firstly, researchers investigated the influence of board structure on banks operating in general or on bank performance, such as El-Chaarani and Abraham (2022); El-Chaarani et al. (2022); Bhatia and Gulati (2021); Choi and Hasan (2005); and Liang et al. (2013). Secondly, research examined the relationship between board structure and bank stability. With studies in the second direction, several researchers only considered the role of some aspects of board structure on financial stability, such as Bart and McQueen (2013), who considered the role of women on the board, or King et al. (2016), who investigated the impact of the board members’ education on bank performance, but some others researched the impact of board structure on bank stability, for example, Abdelbadie and Salama (2019); Anginer et al. (2018); Marie et al. (2021); and Mihail et al. (2021). However, these studies were performed in some advantageous countries (the US, Egypt, etc.) rather than developing economies, such as Nigeria. So, this study examined the level and direction of influence of board structure on bank stability, using the sample data of Nigerian commercial banks in the period from 2010 to 2022.
A study conducted by Okafor and Obamuyi (2011) indicated that poor structure of banks was implicated in most known cases of bank distress in the country. Weak structure manifested in the form of weak internal control system, excessive risk management, insider abuses and fraudulent practices, absence of or non-compliance to credit limits given by the authority, deliberate disobedient to the principles of prudent lending. This claim was supported by the Nigeria Security and Exchange Commission (SEC) survey carried out in 2004, which showed that corporate governance a bench mark of the structure of banks was at a minimal stage, as only about 40% of quoted companies including banks had as at that date approved and operational codes of corporate governance (CBN, 2006).
Deep changes in this area are necessary to reinforce the banking sector stability. The boards of directors were further criticized for the diminution in shareholders’ wealth and corporate failure. They were said to have been in the highlight for the fraud cases that had resulted in the failure of major corporations, such as Enron, WorldCom and Global Crossing. It was in reaction to the poor governance structures in the Nigerian banking system that the CBN in 2006 came up with the code of corporate governance. Despite this code, a lot of governance structure issues have continued to challenge the stability of the banking system.
Banking administrators argued that the solution for addressing stability and controlling risk in the financial industry is a good mechanism for board structure (John, De-Masi, and Paci, 2016). Nevertheless, there exists a split decision on the subject, for some experts as financial stabilizers and for others as a source of instability, but for banking sector stability, the increment of the firm’s value is the absolute aim of the shareholders, which serves as a motivation for management executives to venture into riskier businesses and shaking up the stability of the banking system (Ferrarini, 2017).
The gap in this study then refers to the dearth of the existing research on the specific influence of board structure in terms of the board size, the board independence and the board affiliation on bank financial stability in Nigeria. While previous studies have explored the impact of board structure on financial stability in other countries, there is a dearth of empirical evidence specific to the Nigerian banking sector. This study filled this gap by providing empirical evidence on the relationship between board size, board independence, and board members’ affiliations, and their effect on bank financial stability in Nigeria. By addressing this gap, the study contributed to the existing literature and provided valuable insights for policymakers, regulators, and banking practitioners in Nigeria.
This next section provides the methodology of the research while the subsequent sections delved into the specific empirical analysis of board size, board independence, and board members’ affiliations on bank financial stability, each offering empirical findings, and subsequent discussion. The section concluded with a discussion on the limitations of the study. The findings have implications for practice and offer recommendations for further research in this area.
METHODOLOGY
The relationship between board structure and banks financial stability was examined using the principal-Agency Theory of Jensen and Meckling (1976), Stakeholders theory and Efficiency Wage Monitoring theory of Shapiro & Stiglitz, (1984) sited in Ologunwa, (2019). The aim of these theories is to concentrate on shareholders’ rights and the separation of ownership from control so that a company can maximise the wealth of its shareholders. The theories focus not only on board structure, but it has been expanded to take into account the interests of many different stakeholder groups (Clarke, 2004; Letza, Sun & Kirkbride, 2004). This is consistent with the views of the OECD principles (2004), which define board structure a component of corporate governance as set of relationships between company’s management, its board, its shareholders and other stakeholders.
To formalize this framework, as cited in Zikmund (2010), we assume that stakeholders’ utility function is represented by;
U (w,e) = w – Ψ (e*) (1)
Where Ψ = opportunity wage of stakeholder, w = Wage offered to stakeholder, e = effort put in production, e*= Required effort level, Ψ (e*) = Cost of effort to the stakeholder.
The major import of this framework is that Bank Financial Stability is a function of effective board structure through monitoring by external holders. The lower the fractional holdings of the manager in a bank the higher is his tendency to shirk and the lower his productivity or financial stability. Although the deficiency is that the cost of monitoring Bank financial stability paying efficiency wage may be excessively large.
The study adopted ex-post facto research design using secondary data collected from publications of the Nigeria Stock Exchange (NSE), the annual reports and accounts of the selected banks for the period of ten (13) year spanning 2010-2022. The listed banks in Nigeria, such as Eco bank plc 2006, Guarranty trust bank (gtb) plc 1996, Fidelity bank plc 2005, Stanbic ibtc plc 2005, Wema bank plc 1991, United bank for Africa (uba) plc 1970, First city monument bank (fcmb) plc 2004, Union bank plc 1970, Unity bank plc 2005, zenith plc 2004, Access bank plc 1998 based on accessibility, turnover ratio, profit margin and year of experience were used for the analysis based on accessibility, turnover ratio, profit margin and year of experience and the econometric representation was typically model as follow;
yi = αk + βk Xki + ei (2)
Where yj is the dependent variable representing each of the measures of performance, αk is the constant parameter, Xki is the vector of leadership structure measured with gradient βk and ei is the error term in equation i. The study used two measures of Banks financial stability (BSF) as entrenched in the literature by Ologunwa, (2019); the Sharpe ratio and z-score. Multiple regression models were derived using secondary data. The statistical methods adopted in this study were; frequency, correlation, and regression. The correlation coefficient takes values between 0 and 1 and zero (0) mean no correlation whereas 1 means perfect correlation. Meanwhile variance inflation factor (VIF) test was necessary to quantify the severity of multicollinearity problem for the regression analyses where the correlation coefficient among the independent variables were above 0.80 (Gujarat, 2003). In order to circumvent these problem, panel estimation techniques of fixed and random effects was adopted. The random effect estimator was used when the individual specific component is assumed to be random with respect to the explanatory variables.
The fixed effects estimator was also used when the individual specific component were not independent with respect to the explanatory variables. Decisions were made between the fixed and random effect models using the Hausman specification test whereas LM test was used to choose between pooled and random effect model (Gujarati, 1995). The Hausman test examines the null hypothesis that the estimated coefficients by random effect estimator are similar to those estimated by a fixed effect estimator that is consistent. In the entire regression analyses, panel corrected standard errors (robust standard error) are used, which are developed to tackle the existence of heteroscedasticity (Gujarati, 2003). The general empirical model were specified as;
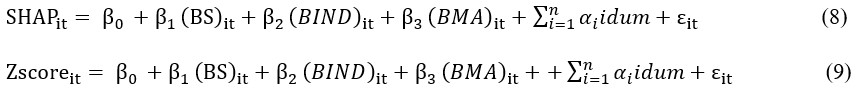
BFSit = β0 +β1 (BS)it + β2 (BIND)it + β3 (BMA)it + β4 BNKSZit + β5 (LEVG)it + εit (3)
BFS which is bank financial stability involved two measures for financial stability, the Sharpe ratio and the z-score, board size (BS), board independence (BIND), and board members’ affiliations(BMA) represents the board structure variables. Bank size (BNKSZ) and Leverage are the control variables. However, the subscript i represents the entity of each listed at time (t), while subscript t represents the year, t = 2010… 2022. The explicit models for Pooled, Fixed and Random effects models are presented below;
Pooled Panel Regression Models
The starting model was the pooled panel model where it assumed that any heterogeneity across firms has been averaged out. The pooled panel regression analysis were adopted based on secondary data, because panel study allows the measuring of the pattern of change and obtaining factual Information requiring collection of data on a regular basis (Greene, 2004). Thus the pooled estimation for the models are given as:
SHAPit = β0 +β1 (BS)it + β2 (BIND)it + β3 (BMA)it + εit (4)
Zscoreit = β0 +β1 (BS)it + β2 (BIND)it + β3 (BMA)it + εit (5)
Where, Sharpe ratio and Zscore are proxies for Bank Fianacial Stability (BFS),β0 = intercept![]() = coefficients and = ε error term
= coefficients and = ε error term
Random Effect Regression Model
The random effect model assumes that the individual heterogeneity is uncorrelated with (or, more strongly, statistically independent of all the observed variables (Gujarati, 2003). Going by this assumption the following model are specified;
SHAPit = β0 +β1 (BS)it + β2 (BIND)it + β3 (BMA)it + Vit (6)
Zscoreit = β0 +β1 (BS)it + β2 (BIND)it + β3 (BMA)it + Vit (7)
Where Vit = αi + εit is often called the composite error.
Fixed Effect Regression Model
The fixed effect model assumes that individual heterogeneity is captured by the intercept term. This means every individual was assigned to its intercept while the slope coefficients are the same, and the heterogeneity was associated with the regressors on the right hand side (Gujarati, 2003). In the model also we introduced a firm dummy so as to determine whether or not peculiarity exists in the results of same selected banks
Where αi idum is a dummy variable.
RESULTS AND DISCUSSION
This session presents the results of the model and discusses the findings, the specific objective was to explore into the possible relationship between board structure and financial stability in Nigeria banks. The Board structure considered in this study include Board size, Board independence and Board affiliation. Two proxies for financial stability were the Sharpe ratio and the z-score. The first section discussed the pattern of the variables, the second section discussed the relationship among the variables while the third section is devoted for the assessment of the effect of Board structure on Sharpe ratio and z-score respectively.
The pattern of board structure, a component corporate governance starting with the Board size showed that Access Bank and United Bank for Africa posted the highest board size (on average) between 2010 and 2022. Specifically, the Bank recorded an average of 18 Board members each in the year under review. Union Bank recorded an average of 16 Board members while Fidelity Bank posted an average of 15 members, one member less that of Union Bank and one member more than that of Ecobank. The Bank with lowest Board members in the period under review was Zenith, posting an average of 10 members in Figure 1. It can be observed that no Bank in Nigeria has less than an average of number 10 Board members between 2010 and 2022. It is also important to note that three of the Banks have more than an average of 15 Board members in the year under review.
In the case of Board independence, it is observed that none of Nigerian Banks had less than an average of a third of the Board being independent member. As can be observed, the Bank with the least independent Board member was Stanbic IBTC and it recorded an average of 0.39, indicating that on average, independent Board members account for 39% of the Board of Directors. Bank with the highest independent Board members was Zenith, recording and average of 0.71 or 71%, followed by Ecobank posting 0.69 or 69% and then Wema Bank with 0.58 or 58% independent Board members. Comparing Board size and Board independence, it was clear that Banks with large size of Board members are actually not the same with large share of independent Board members. In fact, it was interesting to note that Zenith bank and GTCO with the least Board size are among Banks with the highest independent Board members.
The last component of Board structure for this study was Board affiliation. Unlike the case of Board independence where Zenith Bank led, Ecobank had the highest share of affiliated Board members. In contrast to this, Union Bank had the least affiliated Board members as it recorded an average of 0.28 or 28% in the period under study. This implied that while 15% of Board members in Ecobank are from the inside, as much as 72% of the Board members in Union Bank are from inside. Fidelity bank had 0.6 or 60% of its Board size being affiliated while GTCO posted 0.51 or 51%. Generally, except for Union Bank, Banks in Nigeria employed in this study had a relatively satisfactory Board composition, in which case, none of the Banks had less than 30% of the Board size to be outsiders.
a: Board Size b: Board Independence
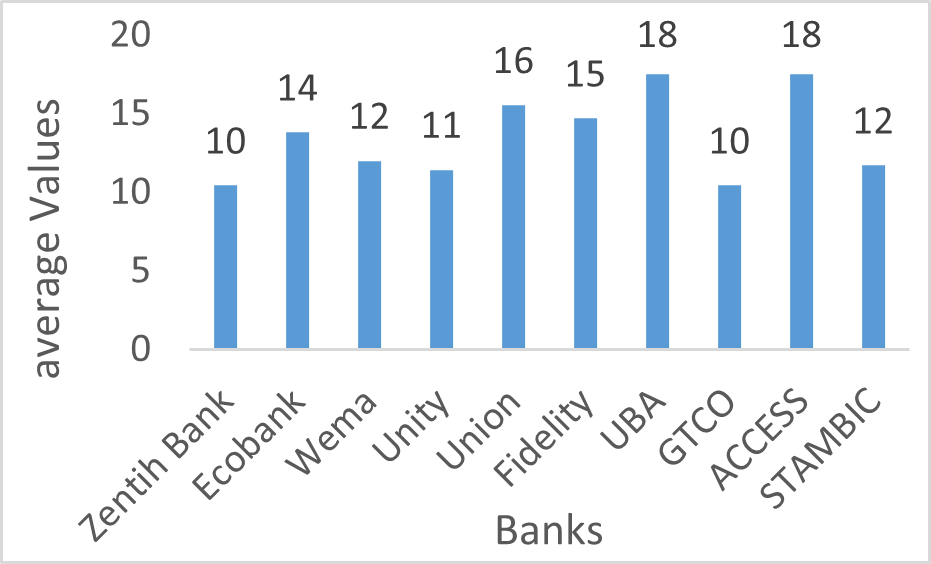
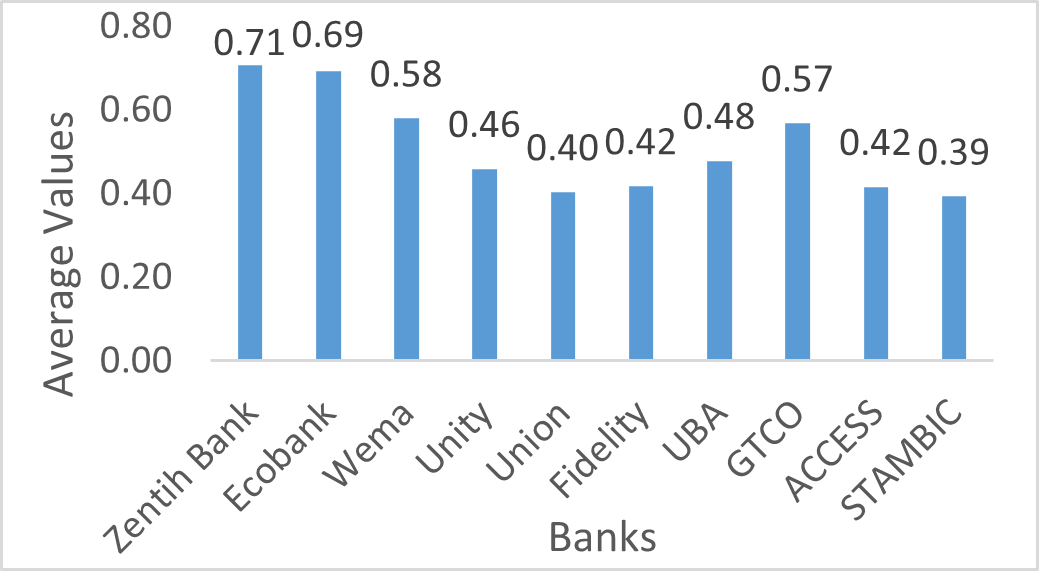
Figure 1: Nature of Board Structure of Deposit Money Banks in Nigeria (2010-2022)
Source: authors’ computation (2023)
Descriptive Statistics
Closely related to the pattern of the analysis is the descriptive statistics of the variables. The descriptive statistics provides information about the statistical properties of the variables. These statistical properties complement the graphical picture of the variables. The descriptive statistics do show some salient statistical properties of the series. For each series under this study, observation was 130 (Table 1), comprising 10 banks over 13 years (2010-2022). Unlike the bar chart that showed the position of each bank, the descriptive statistics puts the growth of average of Board size of all the banks under review to be 2.58, while board independence and Board affiliation posted an average growth of 0.51 and 0.74 respectively. z-score was over 50 points on average while Sharpe ratio was more than 5 points on average.
Table 1: Descriptive Statistics of the series
| Variable | Obs | Mean | Std. dev. | Min | Max |
| Board Structure | |||||
| Board Size | 130 | 2.58 | 0.27 | 1.79 | 3.09 |
| Board Independence | 130 | 0.51 | 0.19 | 0.00 | 1.14 |
| Board Affiliation | 130 | 0.74 | 0.45 | 0.00 | 1.79 |
| Financial Stability | |||||
| Zscore | 130 | 73.37 | 175.16 | -0.75 | 1481.65 |
| Sharpe | 130 | 7.18 | 12.68 | -1.35 | 93.81 |
Source: authors’ computation (2023)
Pairwise Correlation Coefficients of the variables
A weak relationship has a coefficient less than 0.5 while a strong relationship has a coefficient greater than 0.6. A coefficient with around 0.5 and 0.6 is said to be moderate. Negative coefficient indicates that the relationship between a pair of variables is negative while a positive coefficient indicates a positive movement or association. Another role correlation coefficient play is that it enables researchers to detect possible multicollinearity among independent variables so that an appropriate measure can be taken.
Looking at the relationship between board structure and financial stability; the board size, board independence and board affiliation have positive co-movement/association with z-score. Similar relationship with Sharpe ratio was also observed. This suggests that positive increase in board structure variable is associated with increase in z-score and Sharpe ratio. However, for virtually all the paired variables in this regard, the relationship was weak at the period of this study.
Table 2: Pairwise Correlation Coefficients of the variables
| Variables | Board size | Board Independence | Board affiliation | z-score | Sharpe ratio |
| Board size | 1.0 | ||||
| Board Independence | 0.4 | 1.0 | |||
| Board affiliation | 0.1 | 0.2 | 1.0 | ||
| z-score | 0.3 | 0.4 | 0.3 | 1.0 | |
| Sharpe ratio | 0.2 | 0.1 | 0.2 | 0.1 | 1.0 |
Source: author’s computation (2023)
The Regression Analysis of Board Structure Model
This section presents the empirical results of the effects of board size, board independence and board affiliation on the proxy of financial stability, that is, Sharpe ratio. A Bank will be financially stable if the Sharpe ratio is positive and greater than one. The higher the value, the stronger the financial stability. The alternative panel regressions are performed in a bid to select the most efficient and the most accurate model. The three panels performed are Panel Pooled Least Square, Panel least square (fixed effect) and panel least square (random effect).
The idea was to test whether individual firm characteristics matter or not. If pooled least square was favoured, it means that individual bank characteristics does not matter. If random effect was the most appropriate, then the characteristics of banks matter but only that such characteristics was similar across banks. Lastly, if fixed effect was favored, it means that individual characteristic was specific (not similar) to the bank.
The appropriate model was chosen with the help of model selection criteria, that is, Akaike information criterion, Schwarts information criterion, and the Hannan-Quinn information criterion. The model that produced the least value of each of these information criteria was considered appropriate. From the alternative models produced, fixed effect returns the least value for each of the information criteria.
Specifically, for the models that estimates the effect of corporate governance on Sharpe ratio, the values of Akaike information criterion 3.271, 2.515 and 3.589 respectively for pooled least square, panel fixed effect and panel random effect. In the case of Schwartz criterion, the values for pooled least square, panel fixed and panel random effects are 3.469, 3.231 and 4.154 respectively. Further, the values for Hannan-Quinn also reported least values for panel fixed effect being 2.806, a value that was smaller than the one associated with panel pooled (3.352) and panel random effect (3.194). Besides, the adjusted R-squared also indicated that the fixed effect model explained more of the variations in Sharpe ration being explained by the explanatory variables. Consequence upon this evidence, panel fixed effect model was the appropriate one and the explanation was based on this efficient model.
Measurement of Board Structure on Sharpe Ratio
This model measured the relationship between board structure variables on Sharpe ratio after controlling for banks characteristics leverage (LEVG) and bank size (FSIZE). The components of board structure, namely Board size, Board independence, and Board affiliation are considered in the research work. Board size was the number of Directors (Executive, non-Executive and Independence). Large Board size may affect financial stability positively or negatively. If positive, then it means that the Directors provide positive and easily implemented decision on the financing, monitoring and appropriate direction of the bank activities. However, the result indicated that Board size have negative and significant effect on the Sharpe ratio of Nigerian Banks. In particular, if the Banks increase Board size by 1%, financial stability, measured by Sharpe ratio will drop by 0.3%. Thus reward to volatility ratio of banks will fall by approximately 3% if Board size is raised by 10%.
This result showed that more numbers of Board directors in Nigeria banks could signal to wrong or inappropriate financial decision. This could happen if most of the Directors are not well aware of the internal dynamic of the bank operations in relation to things happening outside the banking sector. It could also be that decisions given are obsolete, not consistent with the modern banking operations. The fact that the magnitude is notable indicates that most Directors in Nigerian banks appear not to provide useful information that will ensure increased stability in the financial position. From the pattern of board size presented in Figure 1, first generation banks recorded the highest average board size. It is possible that perhaps most of the Board members are still using outdated banking policy and this tends to hit hard on the financial position of Banks. Further, looking at the Sharpe ratio of Banks, these first generation Banks with large number of board members recorded comparatively lower Sharpe ratio. Hence, it can be conjectured that perhaps the board size of the first generation banks (Union bank, United Bank for Africa etc) have over-blotted Board size.
Similar to the result of the financial stability effect of Board size, board independence also have negative and significant effect on financial stability, in this case, Sharpe ratio (Table 3). Unlike the case of Board size, Sharpe ratio of Nigerian banks is highly sensitive to the changes in Board independence. It must be recalled that Board independence is the share of independent Board members in Board size. the higher the share, the more there are independent members. The pattern of the board affiliation of the bank is such that the least was 0.28 (Union Bank) while the highest was 0.85 (Ecobank). Most Nigerian banks have more than 50% of the Board size to be independent members. Thus, the negative effect may arise from this nature of composition. That is, perhaps the reason for the Sharpe ratio falling following increase in the number of independent Board members is due to more independent directors on the Board list.
More independent directors could lead to communication barrier and of course causes agency problem. In the case of Nigeran banks, if the share of independent Directors in the Board size rises by 1%, Sharpe ratio will fall by approximately 2.3 percentage point (Table 3). This negative result is in support of the work of Rather (2009). The negative effect can be explained further by perhaps, not having clear idea about the issues facing the banks, consequently, making it difficult for them to come up with appropriate solution and this have negative consequence on the financial stability of the Banks. Most of the independent Directors may attain the position through political means, not necessarily on merit. Consequence upon this, there can be conflict of interest between the Executive Directors (the insiders) and the independent Directors (outsiders). Mollah and Zanan (2015) also found negative effect of Board independence on financial stability of banks.
Unlike Board size and Board independence, the third component of Board structure, that is, Board affiliation has positive and significant effect on the Sharpe ratio of the Banks. In this regard, a 1% increase in Board affiliation will engender 0.4% improvement in the financial stability of Nigeria Banks (Table 3). It should be recalled that Board affiliation are Board members who are probably retirees of the Bank or doing business with the Bank. They are in a position to influence the action of the Executives. The fact that Board affiliation increases financial stability, it follows that not only that the set of people made up of affiliated members are not over-blotted but also that their impact is positively felt in Nigeria Banks.
Table 3: Panel least square result showing the results of Board Structure and Financial Stability (Sharpe Ratio)
| Pooled(OLS) | Fixed(FE) | Random(RE) | |
| Constant | ==
== |
4.052**
(2.700) |
2.043**
(2.042) |
| Board Size | -1.277***
(-3.602) |
-0.380**
(-0.844) |
-1.769***
(-5.378) |
| Board Independence | -0.601
(-0.858) |
-2.285***
(-4.225) |
-1.249**
(-2.295) |
| Board Affiliation | 0.503*
(1.817) |
0.401*
(1.866) |
0.604***
(3.324) |
| Observation | 130 | 130 | 130 |
| R-squared | 0.284 | 0.848 | 0.296 |
| Adjusted R-squared | 0.234 | 0.794 | 0.239 |
| Akaike info criterion | 3.260 | 2.097 | 5.247 |
| Schwarz criterion | 3.457 | 2.813 | 3.362 |
| Hannan-Quinn criter. | 3.340 | 2.387 | 4.138 |
| Durbin-Watson stat | 1.429 | 2.121 | 0.439 |
| sigma_u | 1.198 | 1.076 | 1.198 |
| sigma_e | 0.747 | 0.747 | 0.747 |
| Rho | 0.720 | 0.675 | 0.720 |
Note: *,**,*** indicate significant at 10%, 5% and 1% respectively. Values in the parentheses are t-statistic Source: author’s computation, 2023
Measurement of Board Structure Model on Z-score
The second measure of financial stability, the z-score measured the ability of banks to have enough profits to cover its debt, or ability not to default at any time. Hence, the focus of z-score is not necessarily on the risk of taking up or not taking up investment, but just to be sure that banks are able to deal with their debts as at when due by making sure that there is enough profit to do so. Table 2 presents how selected variables of board structure affects the z-score of Nigerian Banks. Like the case of Sharpe ratio model, panel fixed effect was favoured in the z-score model.
The information criteria (Akaike, Schwartz and Hannan-Quinn) returned lowest values for the fixed effect model compared with pooled and random effects. Also, the value of Schwartz criterion for fixed effect was 3.281, much less than the values associated with pooled and random effects being 3.45 and 4.15 respectively. Similar result was observed for the Hannan-Quinn criterion where the values computed under pooled (3.552) and random (3.194) was higher than the one for fixed effect (2.81). Thus, the Bank characteristic is important to be considered when modelling financial stability of banks in Nigeria.
Table 4: Panel Least square results showing the results of Board Structure on Financial Stability (Z-Score)
| Pooled(OLS) | Fixed(OLS) | Random(OLS) | |
| Constant | ==
== |
7.939***
(4.292) |
0.148
(0.095) |
| Board Size | 0.810**
(2.270) |
1.086*
(1.957) |
0.774
(1.510) |
| Board Independence | 3.263***
(4.636) |
2.958***
(4.436) |
3.216***
(3.796) |
| Board Affiliation | 0.995***
(0.575) |
0.676***
(2.550) |
1.003***
(3.543) |
| Group | 10 | 10 | 10 |
| Observation | 130 | 130 | 130 |
| R-squared | 0.371 | 0.799 | 0.371 |
| Adjusted R-squared | 0.328 | 0.729 | 0.321 |
| Akaike info criterion | 3.271 | 2.515 | 3.589 |
| Schwarz criterion | 3.469 | 3.231 | 4.154 |
| Hannan-Quinn criter. | 3.352 | 2.806 | 3.194 |
| Durbin-Watson stat | 0.537 | 1.943 | 0.536 |
| sigma_u | 0.381 | 0.954 | 0.381 |
| sigma_e | 0.896 | 0.896 | 0.896 |
| Rho | 0.153 | 0.532 | 0.153 |
Note: *,**,*** indicate significant at 10%, 5% and 1% respectively. Values in the parentheses are t-statistic
Source: author’s computation, 2023
Unlike the case of Sharpe ratio result, Board size, Board independence and Board affiliation all showed positive and significant effect on financial stability. In specific term, a 1% increase in Board size will lead to 0.01% increase in the z-score of banks. Hence, although positive, Board size has slight effect on z-score. This outcome might be attributed to too many Board size in the sector. Like the case of Sharpe ratio model, z-score was also highly sensitive to changes in numbers of independent Board members. In this regard, a 1% increase in the size of independent Board members, will engender 2.96% increase in z-score. The fact that the magnitude of effect is positive suggests that more independent Board members is good for achieving higher z-score. It follows therefore that it appears the independent Board members are debt conscious, in which case, decision on how to offset debt (in order to avoid bank runs) is paramount. Implicatively, more profits may be reserved, not exploited (for possible investment) for the fear of inability to fall into debt trap. This is why Sharpe ratio may likely run at variant with z-score when it comes to the Board structure of banks.
Like it was observed in the Sharpe ratio model, the z-score model also suggests that Board affiliation is an enhancing factor of z-score of banks in Nigeria. Observably, if affiliated members of Board of Directors rises by 1%, z-score will increase by 0.7% approximately (Table 4). This, more affiliated individuals from outside the bank will improve the z-score and hence financial stability of banks. This result is in line with Klein (1994). CEO duality although it has insignificant effect on z-score, it suggests that separation of Chairman from Directors in the Board structure showed a sign of enhancement of financial stability
CONCLUSION
The study assessed the effect of board structure on the financial stability of banks in Nigeria. The motivation for the works stems from the fact that some Banks in Nigeria are characterized with weak financial stability such that a slight negative shock usually result to large shakeup in Banks. Specifically, the study assessed the nature and pattern of board structure and financial stability of Nigerian Banks. It also examined the relationship between variables, Board structure and financial stability. The components of Board of structure are Board size, Board independence and Board affiliation. The proxy for financial stability are Sharpe ratio and the z-score. The z-score focuses on the ability of banks to have enough profit to settle their debts as any point in time. The higher the value, the more banks are able to absorb debt. Sharpe ratio focuses on the risk attached to holding back profit or using the profit to carry out investment. It measures the reward to variability ratio. The higher the value, the more the risk adjusted performance of investment and the more stable the Bank is financially.
The study therefore concludes that banks in Nigeria exhibits diverse board structure characteristics. The average Board size across banks is 14, with the highest being recorded by the first generation banks, in this case, United Bank for Africa (UBA). In the case of Board independence, Zenith bank, a member of second generation bank has the highest value followed by another second generation bank, Ecobank and then another first generation bank, Wema. For Board affiliation, Ecobank has the highest affiliated Board members, on average. Board audit dichotomous of was computed to be 0.5, on average which is greater than the global best practice of 0.3. However, Ecobank had the highest ratio of non-Executive audit committee members in relation to Executive committee members.
The study also concludes that there was a positive relationship between Board size, Board independence, Board affiliation, and Sharpe ratio on one hand and z-score on the other hand. The coefficients of correlation was however weak. The summary of the effect of board structure on financial stability (Sharpe ratio) was that increase in Board size and Board independence inhibits financial stability of Nigeria Banks. It is also important to note that changes in financial stability was highly pronounced when the size of independent Board members increases. Finally, that the financial stability of Nigerian bank was diverse across banks with second and third generation banks having the highest financial stability. The relationship between financial stability and board structure variables was positive but seemingly weak.
REFERENCES
- Brenes, E. R., Madrigal, K., Requena, B. (2011) Corporate Governance and Family Business Performance. Journal of Business Research, 64(4) 280–285.
- Davidson III, W. N & Rowe, W. (2004) Intertemporal Endogeneity in Board Composition and Financial Performance. Corporate Ownership and Control 1 (4), 49 – 60.
- Eklund, J. E, Palmberg, J. & Wiberg, D. (2009) Ownership Structure, Board Composition and Investment Performance. CESIS Electronic Working Paper Series, Paper no. 172.
- Ghabayen, M. A. (2012) Board characteristics and firm performance: Case of Saudi Arabia’, International Journal of Accounting and Financial Reporting, 2(2): 168—200.
- Gillan, S.L. (2001) Has Pay for Performance Gone Awry? Views from Corporate Governance Forum. In Chew, D.H & S.L. Gillian (Ed.) Corporate Governance at the Crossroads, McGraw-Hil
- Gujarati, D (2003) Basic econometrics, McGraw Hill, New York, NY.
- Hausman, J.A (1978), Specification tests in Econometrics, Journal of the Econometric Society, 46(6): 1251-1271.
- Hermalin, B., Weisbach, M . S. (2001) Boards of Directors as an endogenously determined institution: A survey of economic literature. NBER Working Paper, 8161. Washington: National Bureau of Economic Research.
- Kajola, S. O (2008) Corporate governance and firm performance: The case of Nigerian listed firms, European journal of economics, finance and administrative sciences, 1(4), 16-28.
- Kashif, R. (2008) A comparison of corporate governance and firm performance in developing (Malaysia) and developed (Australian) financial market. Melbourne: Centre for Strategic Economic Studies.
- Khaled, O (2014) Corporate governance and Firm Performance in United Arab Emirate, College of Business, Victoria University of Melbourne Australia. 3(2) 156-164
- Khalil, A. and Chihi, S. (2020) Do board characteristics affect the financial soundness of Islamic banks Revenue. African Scientific Journal, 3(2), 85-104
- Kiel, G.C & Nicholson, G.J (2003) Board composition and corporate performance: How the Australian experience informs contrasting theories of corporate governance, Corporate Governance:
- Kumar, N & Singh, J (2012) Outside directors, corporate governance and firm performance: Empirical evidence from India, Asian Journal of Finance & Accounting, 4(2): 39-55.
- Lai O. & Bello S. (2012) The concept and practice of corporate governance in Nigeria: The need for public relations and effective corporate communication. International Journal of communication, 4(1):120-137
- Li, Wa & Tang, Y (2007), An Evaluation of Corporate Governance Evaluation, Governance Index (CGI[superscript NK]) and Performance: Evidence from Chinese Listed Companies in 2003,
- Mizruchia, M. S (2004). Berle and Means Revisited: The Governance and Power of U.S Corporation. Theory and Society 33, 579 – 617.
- Rashid, A. (2011). Board Composition Board Leadership Structure and Firm Performance: Evidence from Bangladesh. A Paper for Inclusion in the Accounting and Finance Association Australia and New Zealand Annual Conference Adelaide, July 5-7.
- Report of the Committee on Corporate Governance of Public Companies in Nigeria (2003)
- Siriwardhane, P. (2003). Broadening the Boardroom: Corporate Governance and Company performance in Sri Lanka. [Online] Available: pavithra.siriwardhane@rmit.edu.au.
- Ozkan, N. (2011) CEO compensation and firm performance: An empirical investigation of UK panel data. European Financial Management, 17, 260–285.
- Shleifer, A., Vishny, R. (1997) A survey of corporate governance. Journal of Finance, 52(2): 737-783
- Yusuff, WFW & Alhaji, I.A (2012) Corporate governance and firm performance of listed companies in Malaysia, Trends and Development in Management Studies, l(1) 4346.
- Zikmund, W. G (2010) Business research methods, 8th edn, South-Western Cengage Learning, Mason, OH.