
Business Success Based on Entrepreneurial Spirit, Business Ability, and Business Motivation
- Dwi Gemina
- Tini Kartini
- Ardelia Ulima Sunandar
- 150-160
- Feb 19, 2025
- Business Administration
Business Success Based on Entrepreneurial Spirit, Business Ability, and Business Motivation
Dwi Gemina, Tini Kartini, Ardelia Ulima Sunandar
Management Study Program, Faculty of Economics and Business, Djuanda University
DOI: https://dx.doi.org/10.47772/IJRISS.2025.914MG0012
Received: 06 January 2025; Revised: 15 January 2025; Accepted: 20 January 2025; Published: 19 February 2025
ABSTRACT
Business success is not merely the ultimate goal but also the starting point for achieving greater milestones, encompassing business scale expansion, personal development, and social contribution. Each success presents an opportunity to innovate, grow, and create a broader positive impact. This study aims to examine the direct, indirect, and total effects of entrepreneurial spirit and business ability on business success through business motivation as an intervening variable. The research sample consists of 105 MSME business actors in Cicurug District, Sukabumi Regency, selected using a non-probability sampling method with a saturated sampling technique. Data analysis includes descriptive and verification methods, as well as tests for validity, reliability, classical assumptions, path analysis, and Sobel tests for mediating variables. The findings of this research reveal that entrepreneurial spirit and business ability partially have a direct and positive effect on business motivation. Furthermore, entrepreneurial spirit, business ability, and business motivation directly and positively impact business success. Additionally, entrepreneurial spirit and business ability exert an indirect and positive influence on business success through business motivation.
Keywords— Entrepreneurial Spirit, Business Ability, Business Motivation, Business Success
INTRODUCTION
Indonesia is a country with a large population and abundant natural resources. These natural resources can serve as a source of benefit and livelihood, particularly in the economic sector. However, a significant portion of Indonesia’s population remains unemployed, which poses a pressing issue that needs to be addressed. The unemployment problem persists due to the imbalance between the number of available job opportunities and the influx of new labor across all educational levels (Saiman, 2014:22).
One effort to reduce unemployment is through entrepreneurship or establishing MSMEs (Micro, Small, and Medium Enterprises). According to Law No. 20 of 2008 concerning Micro, Small, and Medium Enterprises, MSMEs are defined as productive enterprises owned independently by individuals and are not subsidiaries or branches of larger companies, nor are they controlled or indirectly associated with large enterprises. MSMEs are characterized by their net worth or annual sales as stipulated in the legislation.
The important role of MSMEs in contributing to economic growth within a region has a positive impact on community welfare through the development of MSMEs. Increased employment opportunities lead to higher income levels, which in turn stimulate demand for goods and services. This demonstrates that the growth in the number of MSMEs significantly influences the economic growth of a region.
The selection of MSMEs in Cicurug District is based on the fact that the number of MSMEs in this district is significantly lower compared to other areas in Sukabumi Regency. Cicurug District is one of the 47 sub-districts in Sukabumi Regency. According to the Sukabumi Regency Central Statistics Agency (2023), Cicurug District has the fewest MSMEs, totaling only 105, or 1.96% of the total 6,400 MSMEs in Sukabumi Regency. (Badan Pusat Statistik Kabupaten Sukabumi, 2023, sukabumikab.go.id, accessed on February 5, 2024, at 15:55 WIB).
The phenomenon of the low number of MSMEs in Cicurug District, Sukabumi Regency, poses challenges in the development of MSMEs, particularly in the realization of business operations. The researcher conducted a preliminary survey on business success variables using an interview method to identify the obstacles faced by MSME actors in Cicurug District, Sukabumi Regency. This preliminary survey was conducted with 30 MSME actors in Cicurug District on September 4, 2023. Based on the survey results, it was found that MSME actors have not yet fully optimized their efforts to achieve business success, particularly in increasing sales volume. The business operators are not yet performing at their best. The level of MSME success in Cicurug District is relatively low, as indicated by the poor evaluation of several success indicators by the business operators themselves.
LITERATURE REVIEW
Business success in MSMEs is certainly a goal for entrepreneurs to effectively run their businesses. According to Suryana and Bayu (2014:256), business success is a condition that reflects an improved state compared to the previous one. Business success is the primary goal of a business, where all activities within it are directed toward achieving success. Suryana and Bayu (2014:256) identify the indicators of business success as implementation, time, cost, process, value, and standard. To evaluate business success, it can be assessed through various factors that influence it.
The factors influencing business success, according to Rachmat et al. (2023:27), are motivation, age, experience, and education. These factors are interrelated and play a significant role in determining how well entrepreneurs can achieve their business objectives. These factors are interrelated and play a crucial role in determining the extent to which entrepreneurs can achieve their business objectives. According to Saiman (2014:26), motivation is a willingness to strive optimally to achieve goals, influenced by the business’s ability to satisfy individual needs. Motivation is essential for entrepreneurs to achieve success, as it fosters a desire to work diligently, excel, and ultimately attain success. According to Saiman (2014:26), the indicators of motivation include profit, freedom, personal dreams, and independence.
According to Pratiwi (2022:4), other factors influencing business success are motivation, entrepreneurial spirit, and ability. An entrepreneurial spirit is essential for individuals to identify and seize opportunities in running a business. According to Suryana (2014:10), the entrepreneurial spirit refers to entrepreneurial behavior demonstrated through the traits, characteristics, or nature of an individual to manage a business optimally. In operating or sustaining a business, an entrepreneurial spirit is needed to manage it effectively and achieve significant profits. Furthermore, a business requires development or innovation to remain competitive in its industry. According to Suryana (2014:22), the indicators used to measure the entrepreneurial spirit include self-confidence, initiative, achievement motivation, leadership qualities, and risk-taking ability.
Another factor influencing business success, according to Suryana (2014:256), is ability and willingness, strong determination, hard work, opportunities, and chances. This indicates that ability is one of the factors that must be maximized for business success, as it is essential for entrepreneurs to ensure that their functional activities run as expected. The availability of ability can also inspire entrepreneurs to adapt to business developments. According to Robbins and Judge (2013:59), ability is an individual’s capacity to perform various tasks in a specific job. Entrepreneurial ability refers to the capacity of an individual or group to identify business opportunities, manage risks, and create and manage the resources needed to run a business that generates profit.
METHODOLOGY
Population
The population in this study of 105 MSME business actors in Cicurug District, Sukabumi Regency. The sampling technique employed is saturated sampling, whereby the entire population is include as the sample.
Data Collection
All data collection instruments (questionnaires) were tested for validity using corrected item-total correlation with the criterion (CIT ≥ 0.361). The reliability of the instruments was assessed using Cronbach’s Alpha (α ≥ 0.6). The measurement scale for entrepreneurial spirit, business ability, and business motivation employed a Likert scale ranging from 1 (strongly disagree) to 5 (strongly agree). The measurement scale for business success also used a Likert scale but ranged from 1 (strongly agree) to 5 (strongly disagree). A total of 51 items were found to be valid and reliable, with CIT ranging from 0.493 to 0.913, and reliability indices (α) ranging from 0.866 to 0.945
Data Analysis
The research design utilizes descriptive and verificative methods. Hypothesis testing was conducted using t-tests and Sobel tests. The data obtained were analyzed using path analysis supported by SPSS Version 25.00.
RESULT
57% of respondents are female, 35% are aged between 36-45 years, 100% are married, 62% have completed elementary school as their highest level of education, 38% have been running their business for 2-4 years, 100% have an annual income of less than IDR 2 billion, 100% have a business capital of less than IDR 1 billion, and 100% employ fewer than 5 workers.
The results of the classical assumption tests indicate that the data distribution is normal, free from multicollinearity, and not affected by heteroscedasticity.
Normmality Test
According to Ghozali (2018:160), the normality test aims to determine whether the regression model is normally distributed or not. This test is conducted using the Kolmogorov-Smirnov statistic on the unstandardized residuals from the regression results. Data is considered normal if the Kolmogorov-Smirnov probability value (sig) is greater than 0.05. Meanwhile, according to Sarwono (2012:68), data is normally distributed if it forms a bell-shaped curve. The following are the results of the normality test using Kolmogorov-Smirnov:
Table 1 Results of Normality Test for the First Equation Using Kolmogorov-Smirnov
| One-Sample Kolmogorov-Smirnov Test | ||
| Unstandardized Residual | ||
| N | 105 | |
| Normal Parametersa,b | Mean | .0000000 |
| Std. Deviation | 3.98207793 | |
| Most Extreme Differences | Absolute | .055 |
| Positive | .043 | |
| Negative | -.055 | |
| Test Statistic | .055 | |
| Asymp. Sig. (2-tailed) | .200c,d | |
| a. Test distribution is Normal. | ||
| b. Calculated from data. | ||
| c. Lilliefors Significance Correction. | ||
| d. This is a lower bound of the true significance. | ||
Source: Results of Statistical Data Processing with SPSS Version 25.00, 2024
Based on the table, it is shown that the research data is normally distributed with a Sig (2-tailed) value of 0.200. This indicates that the Sig value is greater than 0.05. Additionally, the normality of the research data can be observed in the histogram, which forms a bell-shaped curve, and the normal probability plot as follows:
Figure 1 First Histogram
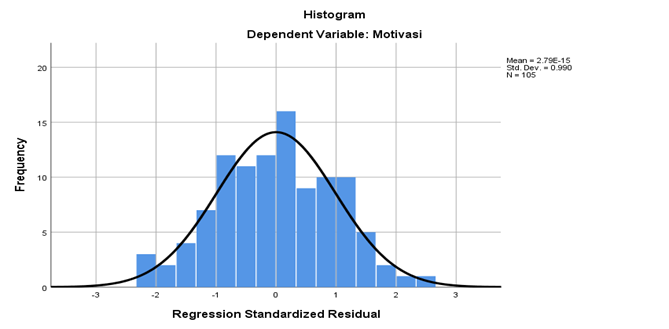
Source: Results of Statistical Data Processing with SPSS Version 25.00, 2024
Based on the figure, it can be observed that the lines on the histogram form a bell-shaped curve. This indicates that the research data for the variables of entrepreneurial spirit and business ability on business motivation are normally distributed, thus meeting the normality assumption. The first normal probability plot can be seen in the following figure:
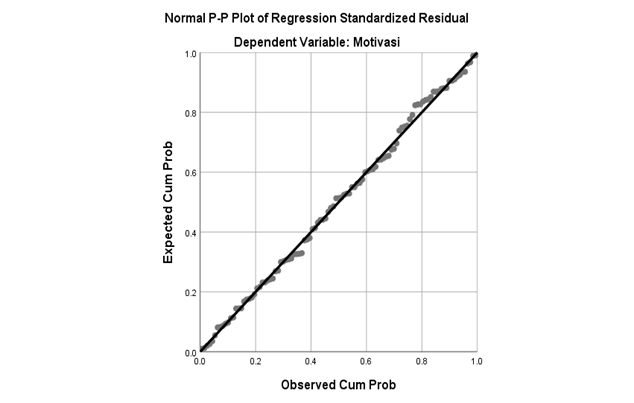
Figure 2 First Non-Probability Plot Graph
Source: Results of Statistical Data Processing with SPSS Version 25.00, 2024
Based on figure, the first non-probability plot graph shows that the straight line represents the diagonal line, while the points following the diagonal line represent the research data for the variables of entrepreneurial spirit and business ability on business motivation. In the non-probability plot graph, the data is distributed along the diagonal line, thereby meeting the normality assumption. The following are the results of the normality test for the second equation using Kolmogorov-Smirnov:
Table 2 Results of Normality Test for the First Equation Using Kolmogorov-Smirnov
| One-Sample Kolmogorov-Smirnov Test | ||
| Unstandardized Residual | ||
| N | 105 | |
| Normal Parametersa,b | Mean | .0000000 |
| Std. Deviation | 4.78568218 | |
| Most Extreme Differences | Absolute | .071 |
| Positive | .071 | |
| Negative | -.058 | |
| Test Statistic | .071 | |
| Asymp. Sig. (2-tailed) | .200c,d | |
| a. Test distribution is Normal. | ||
| b. Calculated from data. | ||
| c. Lilliefors Significance Correction. | ||
| d. This is a lower bound of the true significance. | ||
Source: Results of Statistical Data Processing with SPSS Version 25.00, 2024
Based on Table 2, it is shown that the research data is normally distributed with a Sig (2-tailed) value of 0.200. This indicates that the Sig value is greater than 0.05. Furthermore, the normality of the research data can be observed in the second histogram, which forms a bell-shaped curve, and the normal probability plot as follows:
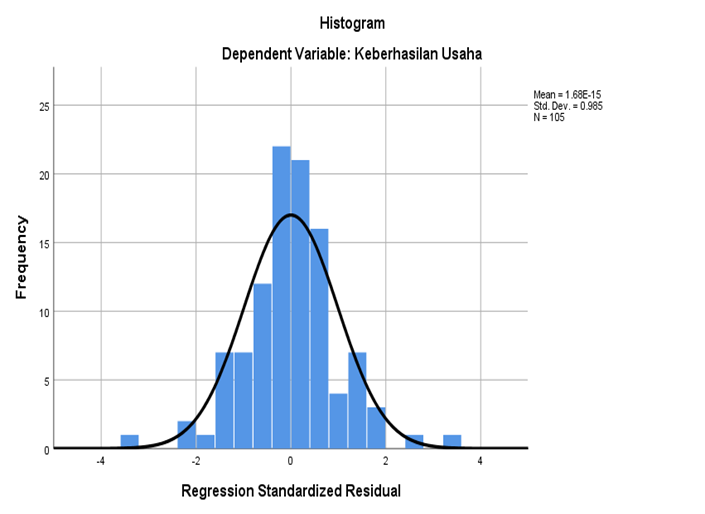
Figure 3 Seccond Histogram
Source: Results of Statistical Data Processing with SPSS Version 25.00, 2024
Based on Figure 3, it can be seen that the line in the histogram forms a bell-shaped curve. This indicates that the research data on entrepreneurial spirit, business ability, and business motivation toward business success is normally distributed, thus meeting the normality assumption. The second non-probability plot can be seen in the following figure:
Figure 4 The Second Non-Probability Plot Graph

Source: Results of Statistical Data Processing with SPSS Version 25.00, 2024
The results of the normality test using the second non-probability plot graph indicate that the straight line represents the diagonal line, and the points following the diagonal line represent the research data for the variables of entrepreneurial spirit, business ability, and business motivation on business success. In the non-probability plot graph, the data is distributed along the diagonal line, thereby meeting the normality assumption.
Multicollinearity Test
According to Ghozali (2018:105), the multicollinearity test aims to examine whether there is any correlation between exogenous variables in the regression model. Multicollinearity can be identified through the tolerance value and Variance Inflation Factor (VIF). According to Sunyoto (2009:82), if the tolerance value is > 0.05 and the VIF is ≤ 5, then multicollinearity is not present. The regression model must be free from multicollinearity to be used in the research. The following table presents the results of the first multicollinearity test:
Table 4 Results of the First Multicollinearity Test
| Model | Colinearity Statistic | Decision | |
| Tolerance | VIF | ||
| Jiwa Kewirausahaan | 0,787 | 1,270 | Free from Multicollinearity |
| Kemampuan Usaha | 0,787 | 1,270 | Free from Multicollinearity |
Source: Results of Statistical Data Processing with SPSS Version 25.00, 2024
The results of the second multicollinearity test are as follows:
Table 5 Results of the Second Multicollinearity Test
| Model | Colinearity Statistic | Decision | |
| Tolerance | VIF | ||
| Jiwa Kewirausahaan | 0,790 | 1,266 | Free from Multicollinearity |
| Kemampuan Usaha | 0,912 | 1,090 | Free from Multicollinearity |
| Motivasi Usaha | 0,812 | 1,231 | Free from Multicollinearity |
Source: Results of Statistical Data Processing with SPSS Version 25.00, 2024
Heteroscedasticity Testing
According to Ghozali (2018:139), a heteroscedasticity test is used to determine whether there is an inequality of variance in the residuals of one observation compared to another. If the variance remains constant, it is referred to as homoscedasticity; if it differs, it is called heteroscedasticity. A good regression model exhibits homoscedasticity or the absence of heteroscedasticity. The heteroscedasticity test in this study was conducted by examining the SPSS output through a scatterplot graph between the predicted values of the endogenous variable, ZPRED, and its residuals, SRESID. The first scatterplot graph can be seen in the following figure:
Figure 5 First Scatterplot Graph
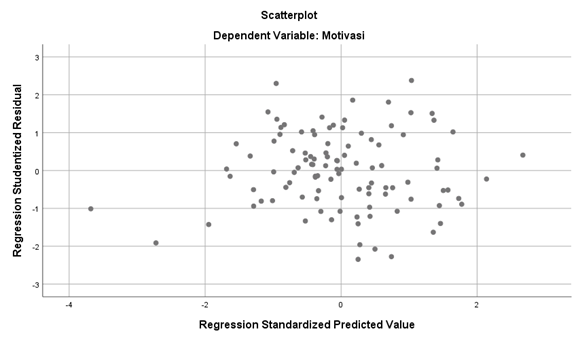
Source: Results of Statistical Data Processing with SPSS Version 25.00, 2024
Figure 6 Second Scatterplot Graph
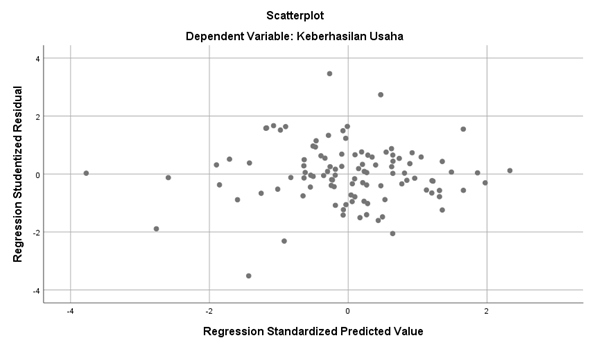
Source: Results of Statistical Data Processing with SPSS Version 25.00, 2024
The magnitude of the path coefficient and the t-significance value were obtained for path analysis using SPSS Version 25.00 at α = 0.05, resulting in a critical t-value of 1.660 (Table 6).
Table 6 Path Coefficients and Hypothesis Test Results
| No | Direct Effect | Coeffisient | Dk | T | T |
| α = 0,05 | |||||
| 1 | X1 to Z | 0,351 | 102 | 4,936 | 1,660 |
| 2 | X2 to Z | 0,542 | 102 | 7,617 | 1,660 |
| 3 | X1to Y | 0,566 | 101 | 7,840 | 1,660 |
| 4 | X2 to Y | 0,166 | 101 | 2,470 | 1,660 |
| 5 | Z to Y | 0,236 | 101 | 3,319 | 1,660 |
Source: Processed Data, 2024
Based on the results of hypothesis testing using SPSS Version 25.00, the diagram model and path coefficients for Entrepreneurial Spirit (X1), Business Ability (X2), and Business Motivation (Z) with Business Success (Y) are illustrated as follows:
Figure 7 Path Analysis of Research Model
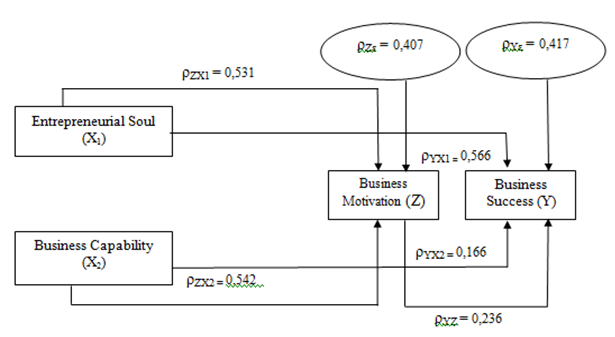
Source: Results of Statistical Data Processing with SPSS Version 25.00, 2024
Path analysis is a path diagram used to present problems in graphical form and to determine structural equations that represent the relationships between variables in the diagram. The path diagram can be utilized to calculate the direct effects, indirect effects, and total effects of exogenous variables on endogenous variables.
According to Sugiyono (2019:59), an intervening variable is a variable that theoretically influences the relationship between exogenous and endogenous variables, making the relationship indirect and unobservable or immeasurable. Mediation hypothesis testing can be conducted using the Sobel test procedure. The Sobel test in this study is used to determine the effect of the intervening/mediating variable, namely variable Z. The determination of the test results (acceptance/rejection of H₀) is conducted by calculating the Zvalue from the unstandardized Beta ab. The Zcount value is compared with the critical Ztable value. If Zcount > Ztable, it can be concluded that the mediating effect is significant. The absolute Ztable value is 1.96.
Table 7 Analysis Result of Sobel Output
| a1 | a2 | B | SEa1 | SEa2 | SEb |
| 0,478 | 0,976 | 0,317 | 0,097 | 0,128 | 0,095 |
Source: Results of Statistical Data Processing with SPSS Version 25.00, 2024
The calculation using the Sobel test is employed to determine the Zvalue. The following is the detailed calculation:
Figure 8 Sobel Test Calculator Results
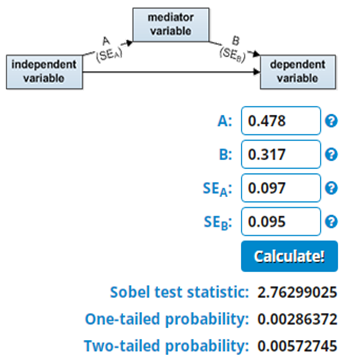
Source: Results of Statistical Data Processing with SPSS Version 25.00, 2024
The calculation results of the Sobel test statistic yielded a Z-value of 2.76. Since the Z-value exceeds the critical value (2.76 > 1.96), this result demonstrates that business motivation significantly acts as an intervening variable in the relationship between entrepreneurial spirit and business success.
Figure 9 Sobel Test Calculator Results
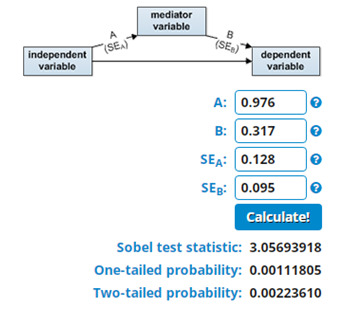
Source: Results of Statistical Data Processing with SPSS Version 25.00, 2024
The calculation results of the Sobel test statistic yielded a Z-value of 3.05 for the business motivation variable. Since the Z-value exceeds the critical value (3.05 > 1.96), this result demonstrates that business motivation significantly acts as an intervening variable in the relationship between business capability and business success.
CONCLUSIONS
The results of the study and hypothesis testing indicate the following entrepreneurial spirit has a direct and positive effect on business motivation, business ability has a direct and positive effect on business motivation, entrepreneurial spirit has a direct and positive effect on business success, business ability has a direct and positive effect on business success, business motivation has a direct and positive effect on business success, entrepreneurial spirit has an indirect and positive effect on business success through business motivation, business ability has an indirect and positive effect on business success through business motivation.
The recommendations that the author can provide based on this research are as follows:
Business Success
The business success of MSME actors in Cicurug Subdistrict, Sukabumi Regency, falls under the high criteria; however, there is a low score on the cost indicator. Business actors can maintain the financial stability and growth of MSMEs by fostering innovation and creativity. By combining cost management capabilities with innovative marketing strategies, business actors can achieve success in their ventures.
Business Motivation
The low-rated indicator for the business motivation variable is independence. Business actors are advised to trust their own abilities, not only focusing on short-term profits but also considering long-term goals. They should always be ready to adapt to changes in the business world and analyze various options before making decisions.
Entrepreneurial Spirit
The low-rated indicator for the entrepreneurial spirit variable is risk-taking. Aspiring entrepreneurs are encouraged to prepare themselves mentally for all possibilities before starting a business, study the intricacies of the intended business, and consult experts without hesitation. Established business actors should maintain their entrepreneurial spirit by exploring new opportunities and stepping out of their comfort zones. This approach enables them not only to pursue profits but also to make a positive impact on society, thereby ensuring a more sustainable and successful business.
Business Capability
The low-rated indicator for the business capability variable is intellectual ability. Business actors can enhance this by participating in training programs, such as data analytics courses or webinars. These programs are designed to equip MSME actors with practical skills essential for running their businesses, such as digital marketing, finance, or operational management. MSME actors should embrace lifelong learning. Staying updated with the latest developments enables them to remain competitive in an increasingly challenging market. Moreover, learning provides personal satisfaction and enhances quality of life.
Future Research
Future studies could include other variables that may influence business success, such as age, experience, education, skills, attitudes, and business knowledge. Additionally, other variables that might affect business motivation, such as entrepreneurial interests, aspirations, and environmental influences, could be considered.
ACKNOWLEDGMENT
We would like to express our deepest gratitude to all those who have contributed to the completion of this research. First, we extend our heartfelt thanks to Mrs. Dwi Gemina, SE.,M.Si, Mrs. Tini Kartini, SE.,MH.MM. for their invaluable guidance, insightful feedback, and continuous encouragement throughout this study.
We are also grateful to Management Study Program, Faculty of Economics and Business, Djuanda University for providing the necessary resources and support during our research process. Special thanks go to our colleagues and peers for their constructive discussions and suggestions that enriched this work.
Finally, we would like to thank our families and friends for their unwavering support and encouragement, which has been a constant source of motivation during this journey. This research would not have been possible without the support of all the individuals mentioned above, to whom we are sincerely grateful.
REFERENCES
- Ghozali, I. (2018). Aplikasi Analisis Multivariate dengan Program SPSS.Yogyakarta: Universitas Diponegoro
- Pratiwi, A. (2022). Kewirausahaan UMKM (Metode dan Implementasi Pemasaran UMKM). Surakarta: UNSRI Press.
- Rachmat, Z., Soepriyadi, I., Suprayitno, N. F., Pramularso, E. Y., Bilgies, A. F., Soputra, J. H., et al. (2023). Kewirausahaan. Jakarta: Global Eksekutif Teknologi.
- Robbins, & Judge. (2013). Perilaku Organisasi Edisi 16. Jakrta: Salemba Empat.
- Saiman, L. (2014). Kewirausahaan:Teori, Praktik dan Kasus-Kasus. Jakarta: Salemba Empat
- Sarwono, J. (2012). Path Analysis. Jarta: Elex Media Komputindo
- Sugiyono. (2019). Metode Penelitian Kuantitatif, Kualitatif R&D . Bandung: Alfabeta
- Suryana. (2014). Kewirausahaan : Kiat dan Proses Menuju Sukses. Jakarta: Salemba Empat.
- Suryana, Y., & Bayu, K. (2014). Kewirausahaan Pendekatan Karakteristik Wirausha Sukses. Jakarta: Kencana.