
Climate Change and Economic Instability in Nigeria
- Evelyn E. Esosuakpo
- 4690-4702
- Feb 22, 2025
- Climate Change
Climate Change and Economic Instability in Nigeria
Evelyn E. Esosuakpo
Department of Geography, Faculty of Environmental Sciences, Dennis Osadebay University, Anwai, Asaba, Delta State, Nigeria.
DOI: https://dx.doi.org/10.47772/IJRISS.2025.9010363
Received: 12 January 2025; Accepted: 20 January 2025; Published: 22 February 2025
ABSTRACT
Climate change poses to be a serious problem to different nations of the world especially developing nations like Nigeria. This change in climate leads to several changes in the environment. These various changes have direct and underlying effects on the economy of a nation and its sustainable development. Thus, the main objective of the study is assessing the impact of climate change on economic instability in Nigeria and also proffer ways to reduce its impacts and ensure sustainable development in the nation. The study employed meteorological data (mean annual rainfall and surface temperature) for 30 years (1994-2023) and economic data on GDP growth rate and inflation rate for 30 years also. Retrospective research was conducted, and archival data were collected for climate from Climatic Research Unit Gridded time series (CRU TS) version 4, while the economic data were collected from World Development Indicator (WDI) and Food and Agricultural Organization of the United Nations. Multiple regression analysis and time-series analysis with ARIMA modelling was employed. The results showed that while temperature increases are associated with minor GDP growth, they have negative effect on inflation, suggesting that higher temperatures can lower inflation rates. Variability in rainfall on the other hand has a modest negative effect on GDP but it does not significantly affect inflation. The findings indicates that climate change contributes to economic instability, with rising temperature and fluctuating rainfall patterns influencing inflationary pressures and productivity. Notably, the data underscores the need for comprehensive policy responses to mitigate climate-related economic disruptions. The research also points to the importance of further refining models to enhance the accuracy of climate-economic predictions and to account for the complexities of Nigeria’s diverse climate and economic landscape.
Keyword- Climate Change, GDP growth rate, Sustainable Development, Economic instability.
INTRODUCTION
The term climate change is the change in the mean of climate variables/elements or variability of its properties such as rainfall, temperature, humidity, wind, etc. over a long period of time, typically in decades [18]. Change in climate has effects on the environment and in turn has effects on the health of man [12], [14]. Some of the effects of climate change on the environment are consequences of climate extremes including soil erosion [10], low agricultural production [25] [15], flooding [24]. outbreak of diseases [11] [13], desertification [5] etc. These various effects of climate change on the environment directly or indirectly have effects on the economy of a nation. [22] therefore, opined that climate change is a serious problem to the society, environment, and the economy of a nation. This study main objective is assessing the impact of climate change on economic instability in Nigeria and also proffer ways to reduce its impacts and ensure sustainable development in the nation. The question is, can climate change have impact on economic instability of Nigeria? This study hypothesizes that there is a significant relationship between climate change and economic instability.
Change in climate is caused by certain factors which could be either natural or anthropogenic. According to [19] and [14], human activities have been the main drivers of the current climate change. Mainly the burning of fossil fuels and, the change of land use has led to an increase of greenhouse gases into the atmosphere, thereby warming it. These activities of man are continuously on the rise as population increases, industrialization increases, and further change in land use as a result of development [23]. These changes are more pronounced in the developing economies where the measures for sustainable development are not strictly adhered to. To avert the dangerous effects of climate change and promote sustainable development in our economies, the Paris Agreement and sustainable development goals (SDGs) are inevitable. Paris Agreement deals with mitigation and adaptation strategies while the SDGs are more focused on bringing prosperity to the people, thereby removing poverty, and ensuring the wellbeing of the people and simultaneously protecting the environment.
The change in temperature and rainfall patterns will be frequently experienced and be a problem to the vulnerable economic system of the developing countries and a problem to humans and their natural environment in both developed and developing nations [1] [21]. Although the negative impact of climate change is reduced in the developed nations than developing nations, its effects on these developed nations cannot be overlooked. According to [26], climate change is a sure threat, which is evident through drought, excessive rainfall, flood, heat waves etc., causing supply-side shocks which is a serious risk in price stability and when the weather conditions are severe and frequent, might push inflation beyond targeted levels.
[7] stated that all countries will experience the effects of climate change but the extent to which countries experience it depends on the size of the economy, the resilience of institutions to climate change and, the methods or technologies put in place to ameliorate the impacts of climate change. Inflation and real GDP according to [7], are significantly affected by climate change but the effects differ in terms of magnitude and direction depending on the hazard caused by climate change. Increase in temperature leads to low industrial output, low agricultural output, reducing growth rate which negatively affects the economy of developing countries [8].
Studies have shown that Nigeria as a nation has been prone to the far-reaching consequences of climate change [16] [9]. A study carried out by [21] used carbon emission, change in annual temperature and forest depletion as climate variables to depict climate change, while for economic growth, exchange rate; government expenditure; and domestic private investment were used as the economic variables. The findings of this study are, carbon emissions affect economic growth significantly both at the long and short run, and forest depletion only affects economic growth at the short run.
[2], used methane emissions, liquid emissions, aggregate emissions, and gaseous emissions as parameters for measuring climate change and the result showed that each of the emissions had negative effect on economic growth in Nigeria. [3] studied the interrelationship between climate change, human development, and economic growth. The study employed Carbon dioxide (CO2) emissions as the parameter for climate change, Human Development Index (HDI) and Poverty index for human development and GDP for economic growth and the study revealed that climate change affects human development which in turn has effect on economic growth.
[16] focused on climate change and food price inflation in Nigeria. The study employed data for 12 years, from 2011 to 2022 and the result showed that climate change significantly influenced agriculture and food production, and subsequently influence the price of food. [17], did a study on how climate affect output and inflation of the three largest economies in Africa (Egypt, Nigeria, and South Africa) for 19 years, from 2002 to 2020, and the study revealed that climate change led to reduction in real output which resulted to increase in food prices. The study stated that the effects of climate change on food prices are more in Nigeria and South Africa than in Egypt.
Several studies have been carried out on the effects of climate change on the economy of Nigeria [2] [16] [21]. Most of these studies employed variables such as methane emissions, liquid emissions, aggregate emissions and gaseous emissions, carbon emission (causes of climate change) and forest depletion (effect of climate change) as climatic variables. These variables are not climatic variables according to the Intergovernmental Governmental Panel on Climate Change (IPCC) instead they are causes of climate change (methane emissions, liquid emissions, aggregate emissions, and gaseous emissions etc.) and effect of climate change (forest depletion). For climate change to be detected, climatic elements must be studied for a long period to determine a change. According to Intergovernmental Panel on Climate Change, climate change is the change in the mean of climate variables/elements or variability of its properties such as rainfall, temperature, humidity, wind, etc. over a long period of time, typically in decades [18]. This therefore stipulates that the variables to be considered for climate change study, are rainfall, temperature, humidity, etc. In addition, most of the research were studied over a short period of time, less than a climatic normal. Based on these, this study tends to evaluate the role of climate change on economic instability in Nigeria, using GDP growth rate and inflation. The objectives of this study, therefore, is to assess the impact of climate change on economic instability in Nigeria and also proffer ways to reduce its impacts and ensure sustainable development in the nation.
Study Area
Nigeria, the area under study, comprises of thirty-six (36) states and a Federal Capital Territory in Abuja. It is one of West African countries, bounded in the south by the Atlantic Ocean, to the East it is bounded by Chad and Cameroun, to the North by Niger, and to the East by Benin Republic. It is located between latitude 4ᵒ N and 14ᵒ N of the equator and longitude 3ᵒ E and 15ᵒ E of the Greenwich meridian. The area occupies about 910770 sq. Km of land space [20]. The area has a tropical climate with wet and dry seasons which varies based on the location. The temperature in Nigeria is high throughout the year. It has the average annual temperature range of between 25℃-32℃ but varies across regions [4]. The climatic zones in Nigeria are tropical monsoon climate in the southern part, the tropical savannah climate and Sahelian hot and semi-arid climate in the northern part of the country [27].
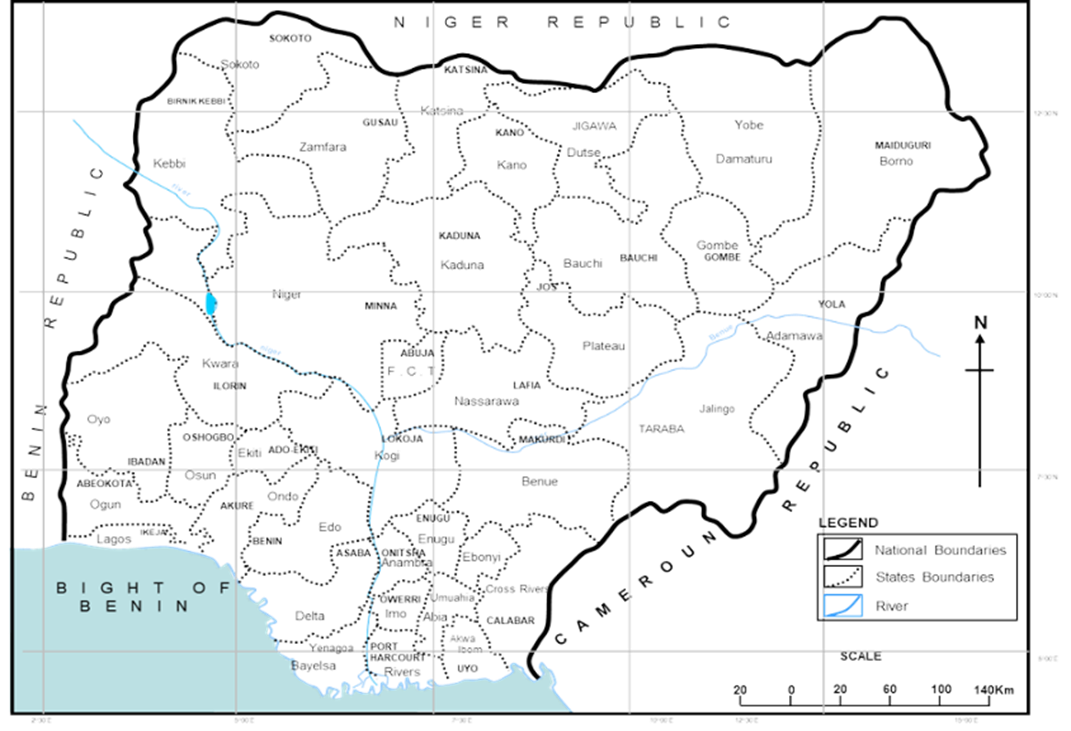
Fig.1: Location, Position and States in Nigeria
Source: Researcher, 2025
The monsoon has average annual rainfall of above 2000mm which reduces from the coastal regions to the inland regions [27]. In the dry season, the monthly temperature ranges from 23℃ at night-time and 31℃ at daytime. The wet season is from May to September and dry season is from October to April. In the tropical savannah has a mean annual rainfall of about 1200mm and mean monthly temperature ranges from 22℃ at night-time to 33℃ at daytime. In addition, the Sahelian hot and the semiarid climate have at daytime 35℃ and at night-time 21℃. The study area is made up two types of vegetations: forest (Montane, Mangrove Swamp, Fresh Water Swamp, Rainforest) and savanna (Guinea Savanna, Sudan Savanna, and Sahel Savanna). Apart from Montane Forest that are found in the elevated lands, the forests are in the southern part of Nigeria and the savannas found north of the forested lands.
Data Collection Techniques
Retrospective research was conducted in this study and the archival data collected was for climate and economic variable. Mean annual rainfall and ambient temperature were the meteorological data that were gathered, while the GDP growth rate at market prices and inflation as shown by the consumer price index were the economic statistics. The relationship between climate change and economic instability in Nigeria demands a broad and cohesive approach to data collection and analysis. To examine this connection effectively, the study focused on mean annual rainfall and ambient temperature as meteorological data, while GDP growth rate at market prices and inflation, measured through the consumer price index (CPI), were chosen as the economic variables. This national-level approach offers a unified perspective on the intertwined effects of climate and economic conditions. The choice of mean annual rainfall and ambient temperature as the primary climate indicators is rooted in their universal significance in tracking climate variability and its impacts. These metrics reflect shifts in weather patterns, which directly affect critical sectors like agriculture, energy, and water resources. In a country like Nigeria, where these sectors form the backbone of the economy, the implications of fluctuating rainfall and rising temperatures are felt across all regions. Capturing these variables at a national level allows for a more comprehensive understanding of how climatic changes impact the economy, rather than focusing narrowly on localized effects.
For the economic data, GDP growth and inflation through CPI were selected because they encapsulate the overall health and stability of Nigeria’s economy. GDP growth represents the broader economic trajectory, shedding light on how climate disruptions influence productivity, trade, and investments. Inflation, on the other hand, highlights the cost-of-living challenges arising from climate-induced disruptions to food production, energy availability, and commodity markets. These economic indicators provide a clear picture of the cascading effects of climate change on national economic stability. The decision to analyze data on a national rather than state-by-state basis was deliberate. Nigeria’s diverse climatic and economic conditions are interconnected, and isolating states might overlook the larger systemic patterns and spillover effects that occur across the nation. A national approach ensures that the analysis captures the aggregate impact of climate variability on the economy, which is essential for formulating policies and strategies that address the issue holistically. Additionally, national-level data tends to be more consistently available and reliable, reducing discrepancies that may arise from localized reporting. By focusing on these carefully chosen variables and maintaining a national perspective, the study seeks to provide a cohesive and actionable understanding of how climate change drives economic instability in Nigeria, fostering solutions that are both inclusive and sustainable.
The data for this study spanned 30 years, covering the period from 1994 to 2023. This timeframe was chosen because climate change studies require at least a climatic normal to provide a reliable basis for analysis. The annual climatic data used in this research was sourced from the Climatic Research Unit Gridded Time Series (CRUGTS) version 4, while the economic data was obtained from the World Development Indicators (WDI) and the Food and Agriculture Organization (FAO) of the United Nations. The statistical analysis was conducted using the Statistical Package for Social Sciences (SPSS) version 25, with multiple regression and timeseries analysis using ARIMA model employed to examine the relationship between the climatic variables (rainfall and temperature) and economic indicators (GDP growth rate). Moreso to create a future prediction of the anomalies This methodological approach follows the precedent set by earlier studies, such as the one referenced by [12].
DATA ANALYSIS
The This study hypothesizes that there is a significant relationship between climate change and economic instability in Nigeria. To establish this, the study employed the multiple regression analysis and timeseries analysis using the SPSS version 25. hypothesizes.
Table 1: Decadal Summary of Climate Variables and Economic Indicators in Nigeria (1994–2023)
| Decades | Average Temperature | Annual Rainfall | Mean GDP | Average Inflation |
| 1994-2023 | 27.15 | 12194.1 | 4.20 | 28.0 |
| 2004-2013 | 27.51 | 11870.1 | 6.74 | 12.1 |
| 2014-2023 | 27.49 | 12132.4 | 2.03 | 13.0 |
Source: Field Computation
Table 1 provides a decadal summary of climate variables and economic indicators in Nigeria from 1994 to 2023, highlighting significant patterns and shifts over time. The data reveals a gradual increase in average temperature, peaking at 27.51°C during 2004–2013 before slightly declining to 27.49°C in the subsequent decade. This subtle variation reflects Nigeria’s exposure to global warming trends, which can have widespread effects on agriculture and other climate-sensitive sectors. Annual rainfall also shows some variability over the decades. While rainfall decreased to 11,870.1 mm in 2004–2013, it rebounded to 12,132.4 mm during 2014–2023. These fluctuations in rainfall can impact water availability and agricultural productivity, further influencing economic stability.
The economic indicators demonstrate notable changes as well. Mean GDP growth was highest during 2004–2013 at 6.74%, likely reflecting a period of relative economic expansion driven by oil revenue and increased investments. However, this growth slowed significantly to 2.03% in 2014–2023, potentially due to declining oil prices, economic mismanagement, and increased climate-related disruptions. Average inflation, on the other hand, showed a significant decline from 28.0% during 1994–2023 to 12.1% in 2004–2013, followed by a slight increase to 13.0% in the most recent decade, indicating persistent economic challenges. This table underscores the intricate relationship between climatic changes and economic performance, with climate variability potentially exacerbating Nigeria’s economic vulnerabilities. The interplay between these factors highlights the need for strategic policy interventions to mitigate climate impacts while fostering economic resilience.
| Table 2: Model Summary relationship between climate change and economic instability in Nigeria | |||||||||||
| Model | R | R Square | Adjusted R Square | Std. Error of the Estimate | Change Statistics | Durbin-Watson | |||||
| R Square Change | F Change | df1 | df2 | Sig. F Change | |||||||
| 1 | .378a | .143 | .079 | 3.52658 | .143 | 2.250 | 2 | 27 | .125 | .830 | |
| a. Predictors: (Constant), Rainfall, Temperature | |||||||||||
| b. Dependent Variable: GDP | |||||||||||
Source: SPSS Output
Table 2 presents a model summary that examines the relationship between climate change and economic instability in Nigeria, using rainfall and temperature as predictors of GDP. The correlation coefficient (R) is 0.378, suggesting a weak positive relationship between the climate variables and GDP. The R Square value of 0.143 indicates that approximately 14.3% of the variation in GDP can be explained by changes in rainfall and temperature. However, the adjusted R Square value of 0.079 highlights that this explanatory power is reduced when accounting for the number of predictors and sample size. The standard error of the estimate, at 3.52658, reflects the average deviation of the predicted GDP values from the actual values. The change statistics show that the R Square change is 0.143, with an F-change value of 2.250. However, the significance value (Sig. F Change) is 0.125, which is above the conventional threshold of 0.05. This implies that the relationship between the predictors (rainfall and temperature) and the dependent variable (GDP) is not statistically significant within the sample. The Durbin-Watson statistic is 0.830, suggesting potential autocorrelation in the residuals, which could affect the reliability of the model. Overall, while the model provides some insight into the link between climate variability and economic performance, the weak explanatory power and lack of statistical significance indicate the need for further investigation, potentially incorporating additional variables or refining the methodology to capture the complexity of this relationship.
Table 3: ANOVA for GDP
| Model | Sum of Squares | df | Mean Square | F | Sig. | |
| 1 | Regression | 55.974 | 2 | 27.987 | 2.250 | .125b |
| Residual | 335.792 | 27 | 12.437 | |||
| Total | 391.767 | 29 | ||||
| a. Dependent Variable: GDP | ||||||
| b. Predictors: (Constant), Rainfall, Temperature | ||||||
Source: SPSS Output
Table 3 presents the results of the ANOVA analysis for the model examining GDP as the dependent variable, with rainfall and temperature serving as predictors. The regression sum of squares is 55.974, which represents the variation in GDP explained by the predictors. This is compared to the residual sum of squares, 335.792, which reflects the unexplained variation in GDP. Together, they result in a total sum of squares of 391.767. The mean square values for regression and residuals are 27.987 and 12.437, respectively. The F-statistic, calculated as 2.250, indicates the ratio of the explained variance to the unexplained variance in the model. However, the associated significance value (Sig.) is 0.125, which is greater than the commonly accepted threshold of 0.05. This suggests that the relationship between rainfall, temperature, and GDP is not statistically significant in this context. These findings imply that, while the predictors may have some influence on GDP, their impact is not strong enough to be considered statistically meaningful within the sample analysed. This could point to the need for additional variables or alternative modelling approaches to better capture the complex interactions between climate change and economic performance in Nigeria.
| Table 4: Coefficients for GDP | ||||||||||
| Model | Unstandardized Coefficients | Standardized Coefficients | t | Sig. | 95.0% Confidence Interval for B | Collinearity Statistics | ||||
| B | Std. Error | Beta | Lower Bound | Upper Bound | Tolerance | VIF | ||||
| 1 | (Constant) | -27.847 | 70.046 | -.398 | .694 | -171.569 | 115.876 | |||
| Temperature | 2.037 | 2.453 | .149 | .830 | .414 | -2.996 | 7.071 | .983 | 1.017 | |
| Rainfall | -.020 | .011 | -.328 | -1.828 | .079 | -.042 | .002 | .983 | 1.017 | |
| a. Dependent Variable: GDP | ||||||||||
Source: SPSS Output
Table 4 provides the coefficients for the regression model analysing the relationship between GDP and the predictors, temperature and rainfall. The constant, with an unstandardized coefficient of -27.847 and a p-value of 0.694, is not statistically significant, suggesting that the model does not provide a meaningful baseline GDP value when both predictors are zero. For temperature, the unstandardized coefficient is 2.037, indicating that for every unit increase in temperature, GDP is predicted to increase by 2.037 units, holding rainfall constant. However, the corresponding p-value of 0.414 demonstrates that this relationship is not statistically significant. Similarly, the standardized coefficient (Beta) of 0.149 reflects a weak positive relationship between temperature and GDP. Rainfall, on the other hand, has an unstandardized coefficient of -0.020, suggesting that a one-unit increase in rainfall is associated with a decrease in GDP by 0.020 units, holding temperature constant. While the p-value for rainfall (0.079) is closer to the 0.05 significance threshold, it still does not meet the standard for statistical significance. The negative standardized coefficient (Beta) of -0.328 indicates that rainfall has a stronger, though not statistically significant, inverse relationship with GDP compared to temperature.
The 95% confidence intervals for both predictors include zero, reinforcing the lack of significant relationships. Collinearity statistics show tolerance values of 0.983 and variance inflation factors (VIF) of 1.017 for both predictors, indicating no concerns about multicollinearity in the model. Overall, the results suggest that while rainfall and temperature may influence GDP to some extent, their effects are not statistically significant within this model. This implies that other factors not captured in the model may play a more substantial role in determining GDP, or that a more refined approach is needed to uncover the complex dynamics between climate variables and economic performance.
| Table 5: Model Summary for Inflation | ||||||||||
| Model | R | R Square | Adjusted R Square | Std Error of the Estimate | Change Statistics | Durbin-Watson | ||||
| R Square Change | F Change | df1 | df2 | Sig. F Change | ||||||
| 1 | .515a | .265 | .211 | 14.24699 | .265 | 4.867 | 2 | 27 | .016 | .937 |
| a. Predictors: (Constant), Rainfall, Temperature
b. Dependent Variable: Inflation Source: SPSS Output |
||||||||||
Table 5 summarizes the model analysing the relationship between inflation and the predictors, temperature and rainfall. The correlation coefficient (R) is 0.515, indicating a moderate positive relationship between the independent variables and inflation. The R Square value of 0.265 suggests that 26.5% of the variation in inflation can be explained by the combined effects of temperature and rainfall. When adjusted for the number of predictors and sample size, the Adjusted R Square decreases slightly to 0.211, which still reflects a moderate explanatory power. The standard error of the estimate is 14.24699, representing the average deviation of observed inflation values from those predicted by the model. The R Square change, also 0.265, corresponds to the amount of variance in inflation explained by the predictors. The F-statistic of 4.867 and its associated significance level (p = 0.016) indicate that the relationship between the predictors and inflation is statistically significant at the 5% level, highlighting the relevance of temperature and rainfall in influencing inflation dynamics. The Durbin-Watson statistic is 0.937, which suggests the potential presence of positive autocorrelation in the residuals, warranting further investigation to confirm the model’s reliability. Overall, the findings reveal that while temperature and rainfall significantly influence inflation, they only account for a portion of its variability, suggesting that other factors also play a critical role in shaping inflationary trends in Nigeria.
| Table 6: ANOVA for Inflation | ||||||
| Model | Sum of Squares | df | Mean Square | F | Sig. | |
| 1 | Regression | 1975.607 | 2 | 987.804 | 4.867 | .016b |
| Residual | 5480.372 | 27 | 202.977 | |||
| Total | 7455.980 | 29 | ||||
| a. Dependent Variable: Inflation | ||||||
| b. Predictors: (Constant), Rainfall, Temperature | ||||||
Source: SPSS Output
Table 6 provides the ANOVA results for the model examining the relationship between inflation and the predictors, temperature and rainfall. The regression sum of squares is 1975.607, indicating the portion of the variation in inflation explained by the predictors. This is compared to the residual sum of squares, 5480.372, which represents the unexplained variation. Together, they yield a total sum of squares of 7455.980, capturing the overall variance in inflation.
The mean square for the regression is 987.804, while the residual mean square is 202.977. The F-statistic for the model is 4.867, with a significance value of 0.016. This p-value is below the conventional threshold of 0.05, confirming that the relationship between temperature, rainfall, and inflation is statistically significant. In other words, the predictors collectively have a meaningful impact on inflation levels within the context of the model. These results suggest that temperature and rainfall play a significant role in influencing inflation, though the residual variance indicates that additional factors not included in the model likely contribute to inflationary changes. This highlights the complexity of inflation dynamics, which are influenced by both climatic conditions and other economic or structural variables.
Table 7: Coefficients for the Relationship Between Climate Variables and Inflation
| Model | Unstandardized Coefficients | Standardized Coefficients | t | Sig. | 95.0% Confidence Interval for B | Collinearity Statistics | ||||
| B | Std. Error | Beta | Lower Bound | Upper Bound | Tolerance | VIF | ||||
| 1 | (Constant) | 651.667 | 282.978 | 2.303 | .029 | 71.04 | 1232.29 | |||
| Temperature | -25.768 | 9.911 | -.433 | -2.600 | .015 | -46.10 | -5.431 | .983 | 1.017 | |
| Rainfall | .059 | .043 | .228 | 1.372 | .181 | -.029 | .148 | .983 | 1.017 | |
| a. Dependent Variable: INFLATION | ||||||||||
Source: SPSS Output
Table 7 presents the results of a regression analysis investigating the relationship between climate variables (temperature and rainfall) and inflation. The coefficients, significance levels, and other statistics help us understand the strength and direction of this relationship. For the constant, the unstandardized coefficient is 651.667, which represents the estimated inflation rate when both temperature and rainfall are zero. This coefficient is statistically significant, with a p-value of 0.029, indicating that the constant term is different from zero at the 5% level. Looking at the climate variables, the unstandardized coefficient for temperature is -25.768, meaning that for each unit increase in temperature, inflation is expected to decrease by about 25.768 units. The negative sign suggests an inverse relationship between temperature and inflation. This relationship is statistically significant with a p-value of 0.015, which is below the 0.05 threshold, confirming that the effect of temperature on inflation is unlikely to be due to chance. The standardized coefficient (Beta) of -0.433 further emphasizes the strength of this inverse relationship, as a 1 standard deviation increase in temperature would result in a 0.433 standard deviation decrease in inflation.
Rainfall, on the other hand, has an unstandardized coefficient of 0.059, which suggests a slight positive relationship between rainfall and inflation. However, the p-value for this variable is 0.181, which is greater than 0.05, indicating that the effect of rainfall on inflation is not statistically significant at the 5% level. The standardized coefficient for rainfall is 0.228, but the lack of statistical significance means that we should be cautious in interpreting this result as having any meaningful impact. The confidence intervals for both temperature and rainfall provide additional insight. The interval for temperature (-46.10 to -5.431) does not include zero, reinforcing the significance of its negative effect on inflation. For rainfall, the interval (-0.029 to 0.148) includes zero, suggesting that rainfall’s effect on inflation is not reliably different from zero.
Finally, the collinearity statistics show that the tolerance values for both temperature and rainfall are 0.983, and their Variance Inflation Factors (VIFs) are 1.017. These values indicate that multicollinearity is not a concern, as the tolerance values are well above the common threshold of 0.1 and the VIFs are below the commonly used cut-off of 10. In summary, temperature has a significant and negative relationship with inflation, while rainfall shows no significant impact. The absence of multicollinearity and the statistically significant temperature coefficient suggest a robust model for understanding how climate variables might influence inflation.
Table 8: Model Statistics for Temperature, Rainfall, GDP, and Inflation Models
| Model Statistics | |||||||
| Model | Number of Predictors | Model Fit statistics | Ljung-Box Q (18) | Number of Outliers | |||
| MAPE | Statistics | DF | Sig. | ||||
| Temperature-Model_1 | 0 | .622 | 25.389 | 11 | .008 | 0 | |
| Rainfall-Model_2 | 0 | 3.552 | 15.011 | 11 | .182 | 0 | |
| GDP-Model_3 | 0 | 69.571 | 23.685 | 11 | .014 | 1 | |
| Inflation-Model_4 | 0 | 24.777 | 11.244 | 11 | .423 | 3 | |
Source: SPSS Output
Table 8 offers a statistical summary of four models—temperature, rainfall, GDP, and inflation providing insights into their accuracy and reliability based on key metrics. These metrics include MAPE (Mean Absolute Percentage Error), Ljung-Box Q-statistic, and the number of outliers detected in each model. The temperature model (Model 1) stands out for its relatively low MAPE of 0.622, which indicates a strong fit with the observed data, implying that the temperature forecasts are highly accurate. Additionally, the Ljung-Box Q-statistic is significant (25.389, p-value = 0.008), suggesting some autocorrelation exists in the residuals of the temperature model. This could indicate that past temperature patterns have a lingering effect on the forecast, which may be important for fine-tuning the model further. The fact that there are no outliers suggests that the model’s predictions are consistent and stable over time, making it relatively reliable for forecasting temperature. For rainfall (Model 2), the MAPE is higher at 3.552, signalling that the model is less accurate in predicting rainfall compared to the temperature model. However, the Ljung-Box Q-statistic is not significant (15.011, p-value = 0.182), suggesting that there are no major autocorrelations in the residuals, which is somewhat reassuring in terms of randomness in the forecast errors. The absence of outliers indicates that the model does not suffer from extreme anomalies, though its overall prediction accuracy remains less precise compared to the temperature model.
The GDP model (Model 3) shows a significant MAPE of 69.571, indicating a substantial deviation between the forecasted and actual GDP values. This relatively high error suggests that the model may struggle to accurately predict GDP over time. The Ljung-Box Q-statistic (23.685, p-value = 0.014) is also significant, indicating autocorrelation in the residuals, meaning the model might need further refinement to address these trends. With one detected outlier, the GDP model also faces some irregularities that may need to be examined to ensure it does not skew the overall predictions. Inflation (Model 4) has a MAPE of 24.777, which suggests that the forecast for inflation is quite imprecise, though still more reliable than the GDP model. The Ljung-Box Q-statistic of 11.244 (p-value = 0.423) is not significant, indicating there is no autocorrelation present in the residuals, which may suggest the inflation model is not being unduly influenced by past inflation values. However, the presence of three outliers indicates that some extreme data points might be affecting the predictions, which could lead to misleading results if not handled properly. The implications of these findings are significant for how these models might be used in decision-making. The temperature model appears to be the most reliable, offering accurate forecasts without major anomalies, making it useful for long-term climate planning. In contrast, the rainfall model is less accurate, but it still provides valuable predictions without significant autocorrelation. The GDP model requires more attention due to its high MAPE and significant autocorrelation, which suggests that economic planners should be cautious when using this model for policy or investment decisions. The inflation model, while relatively stable, also needs to be scrutinized for its outliers, as these could distort the overall accuracy of the inflation predictions. These results highlight the need for refinement in certain models, particularly in the case of GDP and inflation, where outliers and high error rates are concerns. For effective forecasting and planning, decision-makers must take these factors into account and be prepared to adjust the models or consider additional data to improve their reliability.
Table 9: Forecasted Values for Temperature, Rainfall, GDP, and Inflation (2024–2040)
| Model | Temperature-Model_1 | Rainfall-Model_2 | GDP-Model_3 | Inflation-Model_4 | ||||||||
| Years | Forecast | UCL | LCL | Forecast | UCL | LCL | Forecast | UCL | LCL | Forecast | UCL | LCL |
| 2024 | 27.4 | 27.9 | 26.9 | 1170.07 | 1284.5 | 1055.63 | 0.34 | 4.39 | -3.72 | 9.93 | 18.61 | 1.25 |
| 2025 | 27.24 | 27.74 | 26.74 | 1155.48 | 1269.59 | 1041.36 | 2.7 | 7.27 | -1.87 | 19.6 | 28.99 | 10.21 |
| 2026 | 27.38 | 27.88 | 26.87 | 1249.26 | 1369.79 | 1128.74 | 4.08 | 8.94 | -0.77 | 7.7 | 17.25 | -1.85 |
| 2027 | 27.28 | 27.8 | 26.76 | 1261.12 | 1381.76 | 1140.48 | 2.01 | 6.88 | -2.86 | 19.11 | 28.71 | 9.51 |
| 2028 | 27.37 | 27.89 | 26.85 | 1177.66 | 1324.1 | 1031.23 | 0.77 | 5.84 | -4.31 | 7.45 | 17.11 | -2.21 |
| 2029 | 27.31 | 27.86 | 26.76 | 1188.72 | 1341.84 | 1035.6 | 3.25 | 8.71 | -2.21 | 18.99 | 28.74 | 9.24 |
| 2030 | 27.36 | 27.92 | 26.81 | 1214.93 | 1368.85 | 1061.01 | 2.53 | 8.03 | -2.97 | 7.41 | 17.2 | -2.38 |
| 2031 | 27.33 | 27.91 | 26.74 | 1216.42 | 1370.52 | 1062.31 | 1.73 | 7.23 | -3.78 | 18.99 | 28.88 | 9.1 |
| 2032 | 27.36 | 27.96 | 26.76 | 1203.17 | 1357.74 | 1048.59 | 2.37 | 7.91 | -3.18 | 7.44 | 17.37 | -2.49 |
| 2033 | 27.33 | 27.95 | 26.72 | 1202.81 | 1357.46 | 1048.15 | 3.09 | 8.79 | -2.6 | 19.02 | 29.03 | 9 |
| 2034 | 27.35 | 27.98 | 26.73 | 1207.92 | 1362.64 | 1053.21 | 2.51 | 8.2 | -3.19 | 13.08 | 23.15 | 3.02 |
| 2035 | 27.34 | 27.97 | 26.7 | 1208.61 | 1363.32 | 1053.89 | 1.83 | 7.55 | -3.88 | 30.17 | 40.31 | 20.02 |
| 2036 | 27.35 | 27.99 | 26.71 | 1206.36 | 1361.09 | 1051.63 | 2.36 | 8.09 | -3.37 | -3.62 | 6.58 | -13.81 |
| 2037 | 27.34 | 27.98 | 26.69 | 1205.99 | 1360.73 | 1051.26 | 2.97 | 8.77 | -2.82 | 46.13 | 56.4 | 35.86 |
| 2038 | 27.34 | 27.99 | 26.7 | 1206.9 | 1361.64 | 1052.16 | 2.5 | 8.29 | -3.3 | -19.53 | -9.21 | -29.86 |
| 2039 | 27.33 | 27.98 | 26.69 | 1207.12 | 1361.86 | 1052.38 | 1.93 | 7.75 | -3.89 | 46.13 | 56.52 | 35.74 |
| 2040 | 27.34 | 27.99 | 26.69 | 1206.74 | 1361.48 | 1052.01 | 2.36 | 8.18 | -3.46 | -19.5 | -9.05 | -29.95 |
Source: SPSS Output
Table 9 presents the forecasted values for temperature, rainfall, GDP, and inflation from 2024 to 2040, along with their respective upper and lower confidence limits (UCL and LCL). These projections provide insights into how each variable might evolve over the next two decades and highlight potential uncertainties surrounding these forecasts. For temperature (Model 1), the forecasted values are relatively stable, fluctuating slightly around 27.4°C in 2024 and maintaining a similar trend through 2040. The confidence intervals are narrow, indicating a high degree of certainty in the temperature predictions, which may suggest that the temperature will not deviate significantly from the forecasted trend. This is important as it signals a relatively stable climate scenario over the forecast period, at least for the region or conditions modelled. Rainfall (Model 2) shows more variability, with forecasted values ranging between 1.25 and 10.21. While the projections for rainfall also show some consistency, the confidence intervals are wider compared to temperature. This reflects greater uncertainty in rainfall predictions, which is not surprising given the complex and volatile nature of precipitation patterns. The UCL and LCL values for rainfall indicate that the actual future values could differ notably from the forecast, particularly as we move further into the future. This uncertainty is important for planning purposes, especially in sectors such as agriculture and water resources management.
For GDP (Model 3), the forecasted values are projected to be around 1170 to 1249 units in the early years, gradually rising toward 1207 to 1216 units in the later years of the forecast. The confidence intervals here are slightly wider, suggesting that the economic forecast is somewhat less certain than temperature predictions but still within a reasonable range of expectation. However, the significant fluctuations, especially in later years (like in 2035), where GDP could potentially reach values as high as 1363.32, emphasize the potential for substantial growth or contraction in the economy. Policymakers and businesses may need to prepare for such economic variability in the coming decades. Inflation (Model 4) exhibits even more volatility in its forecasts, with values ranging from positive figures such as 18.61% in 2024 to negative values like -29.95% in 2040. The wide range in the LCL and UCL underscores the unpredictability of inflation in this model, which can be influenced by various macroeconomic factors, including monetary policy, global events, and commodity prices. These drastic variations in inflation forecasts suggest that economic planners may face significant challenges in stabilizing prices, especially as the forecast approaches the later years. Overall, the implications of these findings suggest that while temperature predictions show a high level of stability, both rainfall and economic forecasts carry more uncertainty, particularly for rainfall and inflation. Decision-makers will need to account for these uncertainties, especially in areas that rely heavily on climate and economic stability, such as agriculture, infrastructure, and public policy. Preparing for a range of possible outcomes, rather than a single forecast, will be critical for managing potential risks in the coming decades.
DISCUSSION OF RESULTS
The results of the analyses presented in the tables suggest a complex relationship between climate change and economic stability in Nigeria, with varying levels of significance across different variables. The climate data indicates a gradual rise in average temperature over the decades, peaking during 2004-2013, which aligns with global warming trends. This shift, though small, could have significant implications for agriculture and other climate-sensitive sectors, potentially disrupting economic activities. Rainfall also fluctuated over the decades, with a decrease in the earlier period followed by a rebound in the later years, highlighting the unpredictability of precipitation patterns. These shifts in climate could impact water resources, agricultural productivity, and, in turn, economic stability. Economically, the data shows a notable decline in GDP growth after 2004–2013, which could be attributed to a combination of declining oil prices, mismanagement, and climate-related disruptions. Inflation patterns, while initially improving, showed only slight declines in the more recent decade, indicating that Nigeria continues to grapple with economic challenges despite some progress. These economic fluctuations underscore the vulnerability of Nigeria’s economy to both global and local factors, including climate variability. In examining the statistical models, the analysis of GDP with rainfall and temperature as predictors revealed a weak positive relationship, with the R-square value indicating that the climate variables explained only a small portion of the GDP variation. Moreover, the lack of statistical significance in the correlation, as indicated by p-values greater than the threshold, suggests that other factors might play a more substantial role in economic performance. This is further confirmed by the ANOVA results, which also failed to show a statistically significant relationship between climate variables and GDP.
In contrast, the relationship between inflation and climate variables was more promising. The moderate correlation and the statistical significance of temperature’s effect on inflation point to a meaningful, albeit partial, influence of climate conditions on inflationary dynamics. Specifically, an inverse relationship between temperature and inflation was observed, suggesting that temperature fluctuations could help explain some inflationary pressures in Nigeria. However, the effect of rainfall on inflation remained insignificant, further complicating the climate-inflation connection. Forecasting models for temperature, rainfall, GDP, and inflation from 2024 to 2040 reveal distinct patterns of uncertainty. While temperature projections were relatively stable with narrow confidence intervals, reflecting a high level of confidence in the future climate scenario, rainfall and economic indicators showed greater variability. The wider confidence intervals for rainfall suggest greater uncertainty in precipitation patterns, which could have serious implications for sectors dependent on water availability. For GDP and inflation, the forecasted values exhibited considerable fluctuations, indicating potential challenges for economic stability. The wide ranges, particularly in inflation projections, suggest that policymakers may face significant unpredictability in managing inflationary pressures, especially as global and local factors continue to influence the economy. Overall, the findings highlight the need for careful planning and policy interventions in response to both climate and economic challenges. While temperature trends appear stable, the volatility in rainfall, GDP, and inflation forecasts points to a complex, dynamic relationship that requires a comprehensive approach to manage the risks and uncertainties in the coming decades. Climate variability is likely to continue influencing economic performance, underscoring the importance of developing adaptive strategies for economic resilience in the face of changing environmental conditions.
CONCLUSION
In conclusion, the relationship between climate change and economic instability in Nigeria is both complex and multifaceted, with data indicating significant variability in both climate variables and economic performance over recent decades. The gradual increase in average temperature and fluctuating rainfall patterns highlight Nigeria’s vulnerability to global climate trends, which can severely affect key sectors such as agriculture, water resources, and food security. These climate changes, in turn, intersect with economic factors, creating a feedback loop that exacerbates economic instability. The economic indicators reveal that while periods of growth were driven by oil revenue and external investments, the slowdown in GDP growth, particularly in recent years, can be linked to various factors, including climate disruptions. Despite the weak statistical significance in the relationship between climate variables and GDP, there is a clearer connection between climate change and inflation. Rising temperatures are associated with reduced inflation, while rainfall seems to have a less direct effect. This suggests that while climate factors play a role in shaping economic outcomes, they are only part of a broader, more complex economic landscape that includes factors such as policy decisions, oil price fluctuations, and structural challenges within the Nigerian economy.
Additionally, the forecasted values for both climate and economic indicators for the coming decades indicate a high level of uncertainty, particularly in rainfall and inflation projections. This uncertainty underscores the need for adaptive policies that are resilient to climate variability and economic shocks. Policymakers must account for this unpredictability by developing strategies that can mitigate the impact of both climate and economic instability. In this regard, fostering a more diversified economy, investing in climate-resilient infrastructure, and strengthening governance frameworks will be key to ensuring Nigeria’s long-term stability and prosperity in the face of climate change.
ACKNOWLEDGEMENT
I want to sincerely thank everybody that has helped in one way or the other to make this research work a success. My special thanks to Prof. E. Jeroh and some others who helped during the period of data collection. I also want to tender my unreserved thanks to those who supported and encouraged me during this period. I truly appreciate you all, God bless you.
REFERENCES
- Adom, P. K., (2024). “The Socioeconomic Impact of Climate Change in Developing Countries in the Next Decades: A Review.” CGD Working Paper 681. Washington, DC: Centre for Global Development.
- Ajayi, I.S. (2024). Effect of Climate Change on Economic Growth in Nigeria. POLAC International Journal of Econs & Mgt Science (PIJEMS) 10(1), 335-346
- Akanbi, B.E. & Satope, B.F. (2014). Climate Change, Human Development and Economic Growth in Nigeria. International Journal of Humanities and Social Science, 4(13), 222-228
- Benali, A.; Carvalho, A.C.; Nunes, J.P.; Carvalhais, N.; Santos, A. (September 2012). Estimating air surface temperature in Portugal using MODIS LST data. Remote Sensing of Environment. 124: 108–
- Burrell, A. L., Evans, J. P., & De Kauwe, M. G. (2020). Anthropogenic climate change has driven over 5 million km2 of drylands towards desertification. Nature Communications, 11(1), 1-11. https://doi.org/10.1038/s41467-020-17710-7
- Callen, T. (2020). Gross Domestic Product: An Economy’s All. International Monetary Fund,1-2. http://www.imf.org/external/pubs/ft/fandd/basics/gdp
- Cevik, S. & Jalles, J.T. (2023). Eye of the Storm: The Impact of Climate Storm on Inflation and Growth. International Monetary Fund (IMF) Working Paper WP/23/87
- Dell, M., Jones, B.F., & Olken, B.A. (2012). Temperature Shocks and Economic Growth: Evidence from the Last Half Century. American Economic Journal: Macroeconomics 4(3): 66-93
- Ebele, N.E. & Emordi, N.V. (2016). Climate Change and Its Impact in Nigerian Economy. Journal of Scientific Research and Reports 10(6): 1-13 ISSN: 2320-0227
- Eekhout, J. P., & De Vente, J. (2022). Global impact of climate change on soil erosion and potential for adaptation through soil conservation. Earth-Science Reviews, 226, 103921. https://doi.org/10.1016/j.earscirev.2022.103921
- Efe, S.I., Esosuakpo, E.E. & Awaritefe, O.D. (2023). Correlation of Rainfall on Tuberculosis Distribution in South-Southern Nigeria. Journal of Management and Social Science Research, 4(1).
- Environmental Protection Agency (EPA) (2024). Climate Change and Human Health. https://www.epa.gov/climateimpacts/climate-change-and-human-health
- Esosuakpo, E.E., Efe, S.I. & Awaritefe, D.O. (2023). The Effects of Climate on the Occurrence of Diarrhoea in South-South Nigeria. International Journal of Research and Innovation in Social Science (IJRISS) 7(11), 1067-1081
- Esosuakpo, E.E., Olowo, F.J. & Nwambuonwor U.J. (2024). Spatial Variation of Climate in South-Southern Nigeria. World News of Natural Sciences (WNOFNS) 58, 111-129
- Habib-ur-Rahman M, Ahmad A, Raza A, Hasnain MU, Alharby HF, Alzahrani YM, Bamagoos AA, Hakeem KR, Ahmad S, Nasim W, Ali S, Mansour F and EL Sabagh A (2022). Impact of Climate Change on Agricultural Production; Issues, Challenges, and Opportunities in Asia. Front. Plant Sci. 13:925548. doi: 10.3389/fpls.2022.925548
- Ichoku, H., Anthony, I., Olushola, T. & Martins, A. (2023). Climate Change and Food Inflation in Nigeria. International Journal of Environment and Climate Change 13(11), 1200-1217
- Iliyasu, J., Mamman, S. O., & Ahmed, U. A. (2023). Impact of climate change on output and inflation in Africa’s largest economies. Climate and Development, 15(10), 864–875. https://doi.org/10.1080/17565529.2023.2172315
- Intergovernmental Panel on Climate Change (IPCC) (2014). Fifth Assessment Report (AR5), working group three (WG III)
- Intergovernmental Panel on Climate Change (IPCC) (2021). The Physical Science Basics. Sixth Assessment Report (AR6), Working Group 1 (WG1)
- Ndakara, O.E. & Eyefia, O.A., (2021). Spatial and seasonal variations in rainfall and temperature across Nigeria. Journal of Biodiversity and Environmental Sciences (JBES) 18;2, 79-92.
- Ogbuabor, J.E. & Egwuchukwu, E.I. (2017). The Impact of Climate Change on the Nigerian Economy. International Journal of Energy Economics and Policy, 7(2), 217-223.
- Rocha, J., Oliveira, S., Viana, C.M. & Ribeiro, A.I. (2022). Climate Change and Its Impacts on Health, Environment and Economy. One Health, 253-279.
- Sajini, I.F. (2022). Demographic Change and Economic Growth in Nigeria: Geographical and Health Perspectives. International Journal of Health Sciences 6(2), 965-971
- Tabari, H. (2020). Climate Change impact on Food and Extreme Precipitation Increases with Water Availability. Scientific Reports. 10:13768
- Tajudeen, T. T., Omotayo, A., Ogundele, F. O., & Rathbun, L. C. (2022). The Effect of Climate Change on Food Crop Production in Lagos State. Foods, 11(24). https://doi.org/10.3390/foods11243987
- United Nations, (2024). Prices on a Warming Planet – The Inflationary Effects of Climate. https://www.un.org/en/desa/prices-warming-planet-inflationary-effects-climate-change
- World bank Group (2021). Current Climate: Climate Change Knowledge Portal https://climateknowledgeportal.worldbank.org/country/nigeria/climate-data-historical