
Cognitive Engagement as Correlate of Academic Achievement among Form Four Students in the South East Region, Botswana
- Moji Rampete, Ma
- Josephine Mutua, Phd
- Edward Kigen, Phd
- 772-788
- May 27, 2024
- Education
Cognitive Engagement as Correlate of Academic Achievement among Form Four Students in the South East Region, Botswana
Moji Rampete, Ma1, Josephine Mutua, Phd2, Edward Kigen, Phd3
1Department of Educational Psychology,
Kenyatta University, Kenya
2Lecturer, Department of Educational Psychology,
Kenyatta University, Kenya
3Lecturer, Department of Educational Psychology,
Kenyatta University, Kenya
DOI: https://dx.doi.org/10.47772/IJRISS.2024.803051S
Received: 21 April 2024; Accepted: 27 April 2024; Published: 27 May 2024
ABSTRACT
Academic Achievement is an essential part of learning, and it is the most important factor that leads to the attainment of one’s goals. Good academic achievement by students at Senior High school is of paramount importance in every educational system. On the same note, poor academic achievement persists and requires more research. The purpose of this study was to determine how cognitive engagement predicts academic achievement in the South East Region of Botswana. The Self-Determination Theory of Richard Ryan and Edward Deci (1985) guided this study. This research utilized a correlational research design while purposive sampling, stratified sampling and simple random sampling were used to select 502 Form four students. Data was collected through self-report questionnaires which comprise adapted scales for Cognitive Engagement Learning Strategies which comprised 16 questions. The targeted population was Form four students in public secondary schools in the South East Region, Botswana. A pilot study using 50 students from one secondary school in the region was conducted to check the validity and reliability of the instruments before collecting the actual data. A sample of 502 participants was selected from 5 public secondary schools. Academic achievement was inferred from students’ academic records. Descriptive and inferential statistical methods were utilised in SPSS version 25 to summarise the collected quantitative data. Descriptive statistics such as means, percentages and frequencies were used to summarise the collected quantitative data. The data demonstrated a weakly positive correlation (r (500) =.32, p <.01) between academic achievement and cognitive engagement. Education trainers through pre-service and in-service training should consider implementing required courses to assist instructors in cascading the knowledge, skills and abilities needed by trainees to support students in cultivating cognitive engagement in objectively supporting students to reach their academic achievement goals. To fully comprehend the relationship between cognitive engagement and academic achievement at the secondary school level, similar studies using a mixed study design should be explored.
Keywords: Cognitive Engagement, Academic Achievement, Form Four, Botswana.
INTRODUCTION
According to Wentzel (2003), cognitive engagement refers to the level of psychological involvement of a student in their academic work. That is, considering their level of interest, sense of ownership, and learning methodologies. Students’ will, or how they feel about themselves and their work, as well as their abilities and the methods they use to master their work, determine how they are cognitively engaged (Metallidou & Viachou, 2007). Effort is a factor in both the behavioural and cognitive definitions of engagement, according to Pintrich (2003). To put it another way, cognitive engagement refers to the kind of participation students are making in class, whereas pure effort refers to quantity. School attendance, academic achievement, and the prevention of harmful teenage behaviour can all be improved through student cognitive engagement (Al-Alwan, 2014). Therefore, low or lack of cognitive engagement can result in low grades; hence lower academic motivation which impacts academic achievement negatively.
The three cognitive engagement learning strategies in this study focused on elaboration, organization, and critical thinking. These are deep learning techniques that greatly improve student comprehension and understanding of their assignments.
In Botswana schools, cognitive engagement is important in order to help high scholars achieve academically and qualify for tertiary education. Botswana, a still developing country is not exempted from this concern. Over the last two decades, there has been a decline in high school students’ final examination results in the country. Since independence in 1966, the government of Botswana has aimed to provide high-quality education. The government has worked very hard to ensure that high-quality education is available and accessible. Although teachers and students put in a lot of effort in teaching and learning, most young people who pass through the secondary school leaving examination – also known as the Botswana General Certificate of Secondary Education (BGCSE) – do not meet post-secondary education requirements. In the South East Region, national results have been lower than the national set target of 50% for several years now. As a lot of these senior high school completers have not qualified for the next level of education, many of them have been forced into the streets. This challenge also increased unemployment and irritability among both students and parents. Some of these underachievers who face unemployment frequently turn to unlawful and/or criminal means of surviving. From a legal perspective, such criminal behaviour has landed many in prisons and has become a burden as the national purse has to feed and provide health amenities for them. This study aimed to determine whether the academic achievement of Form 4 students in the Southeast Region of Botswana is influenced by cognitive engagement.
THEORETICAL REVIEW
The Social Cognitive Learning Theory (Bandura, 1989), guided this study. Between traditional learning theory (i.e. behaviorism) and cognitive approaches, social cognitive learning theory is often called “the bridge.” This is due to its emphasis on the mental (cognitive) aspects that play a role in learning. Bandura (1977), in contrast to Skinner, holds that people actively analyse information and consider the connection between their actions and their effects. According to Bandura, there is a process to learning, and learning interacts with the environment’s effect. The social learning method considers mental processes and acknowledges their role in determining whether or not a behaviour should be copied. As a result, by acknowledging the significance of mediational processes, this theory offers a more thorough account of how humans learn. That is motivation, reproduction, retention, and attention (McLeod, 2016). The behaviourist paradigm examines how extrinsic motivation, the environment, and external behaviour affect motivation. The cognitive model looks at how the environment and personal behaviour impact intrinsic motivation. For example, a student’s response to a learning problem is said to be influenced by external variables such as teacher support and negative outcomes, such as correctly solving tasks, and previous service, in addition to their personal efficacy beliefs.
The social-cognitive approach presupposes that behaviour is driven by objectives. In other words, individuals set goals for themselves and rely on those aims to direct their behaviour. Then motivation to accomplish such goals follows. They can be motivated in the classroom by goals like having a good GPA or being well-liked by peers. These goals thereby steer behaviour toward performance, and ultimately toward academic achievement.
This study adapted the Social Cognitive Learning Theory model but modified it to fit the study’s participants. In this study, the model used Elaboration, Organisation and Critical Thinking; to determine behaviour that can steer good performance and academic achievement.
Elaboration refers to the behaviour that students exhibit when they study worked-out examples. Organisation learning strategies are those methods that students use to organize their learning materials in a way that is particular to them and to create the strongest links possible between old and new information. Critical Thinking is frequently described as rational, reasonable, and thoughtful thinking with an emphasis on judgments that are trusted or implemented (Trilling & Fadel, 2009).
LITERATURE REVIEW
Most of the research on the relationship between academic achievement and cognitive engagement has been conducted in developed countries. Therefore, research on students’ cognitive engagement in underdeveloped nations, like Botswana, is seriously needed.
Stovall (2003) suggests that cognitive engagement is determined by a combination of students’ time on task and their willingness to engage in activities. According to Krause and Coates (2008), cognitive engagement is the degree to which students are engaged in learning-related activities that directly affect desired outcomes. Academic engagement, as defined by Chen et al. (2008), is the level of student involvement in their educational activities. It has been shown to be positively associated with several desirable outcomes, including excellent academic achievement, student happiness, and perseverance. Some studies define cognitive engagement as the interest, effort, motivation, and time spent on a task and argue that there is a causal link between engagement time or the time students spend to fully participate in their learning activities and succeed academically (Bulger et al., 2008).
A study conducted in Spain by Estévez et al. (2021) found that cognitive engagement has gained prominence in contemporary educational psychology research due to its ability to tackle issues like poor academic performance and high school dropout rates. The research examined the relationship between different profiles and academic achievement. There were found to be two distinct groups of under-engaged students: one with low behavioural engagement (5.02%) and the other with poor emotional engagement (6.55%). Most individuals demonstrated fairly high cognitive engagement (31.95%) or moderate cognitive engagement (56.48%). The findings revealed that highly cognitively engaged students performed better academically, better controlled their time and study environments, were more purposeful in their knowledge searching and displayed less maladaptive regulatory behaviour.
The purpose of a recent study by Sukor et al. (2021) carried out in Malaysia was to ascertain how student participation affected academic achievement. For the questionnaire, 84 students studying fields other than food science were chosen as a sample. Overall student engagement was found to be 3.63 (SD =.24) on average. The findings showed a strong correlation between overall student engagement and academic achievement (r =.312; p.001). Two aspects of student engagement, emotional engagement (r = 0.529; p.001) and cognitive engagement (r =.391; p.001), were favourably connected with academic performance. In this study, emotional engagement increased academic achievement more than cognitive engagement did.
Kenya’s Manga Sub-County and Nyamira County secondary school students were studied by Wara (2018). The research examined the relationship between students’ academic achievement and cognitive engagement. The basis of the inquiry was the theoretical perspective of self-determination. The survey included a random sample of 1,750 Form Four students. According to research results, high school students’ academic achievement was found to be closely linked to cognitive engagement (P = 0.01, r = 0.376). The study revealed that cognitive engagement was a significant predictor of academic achievement among secondary school students studied. (r = .376, N = 312, p = .01).
The researcher, therefore, found it appropriate to conduct a study on the relationship between academic achievement and cognitive engagement in the South East Region of Botswana, to determine whether cognitive engagement influences academic achievement.
METHODOLOGY
This section explains the research design, research variable, location of the study, target population, and sampling techniques. Parameters explained include sample size, data collection instruments, instruments validity and reliability, data analysis techniques and finally ethical considerations.
Research Design
The research design used in this study was correlational. Correlation studies examine the association between two or more variables. Researchers can establish if two variables change together and to what extent by using the outcomes of correlational studies (Tan, 2014). A positive correlation occurs when two variables change simultaneously and in the same direction. Moreover, it is possible for two variables to have no connection at all, in which case they are said to have zero association (Tan, 2014). To ascertain how cognitive engagement predicts academic achievement, correlational research methodology was deemed appropriate for this particular study.
Research Variable
In this study, the independent or predictor variable was students’ cognitive engagement. Cognitive engagement were measured at the interval level. The total scores compiled from the results of all the subjects that Form Four students wrote in the end-of-year examinations were averaged to determine how they performed. Using the formula T= 10(Z) + 50, the obtained scores were first converted to a standard Z-score and then to T scores. T-score values between 20 and 40 and 40 and 60 were viewed as representing low and average levels of academic achievement; respectively, 80 and 60 were regarded as representing a high level of academic achievement.
Location of the Study
This study was conducted in the South East Education Region of Botswana. Here is where Gaborone, the capital of Botswana, is situated. There are six public senior high schools in the area: three are in the city and three in nearby villages.
One of Botswana’s nine districts is the South East District, which is home to this educational zone. Despite having the highest population density, the South Eastern District is the smallest district in terms of geographical size. The population of this district is 111 440, according to the Botswana Central Statistics Office’s estimates for 2022. The district is located in a region that is 690 square miles or 1,780 square kilometres in size. This region was chosen for this research because it is considered the best region in the country yet does not yield outstanding academic results; even though it consistently outperforms other regions.
The tables below show some the poor performance experienced over some of the past years.
Table 1 Candidates in Government and Government Aided Schools Awarded 6 C’s or Better in the South East Region.
| 2021 | 2022 | VARIANCE | ||||
| CENTRE NO. | CENTRE NAME | Number of candidates awarded 6 C’s or better | % of candidates awarded 6 C’s or better | Number of candidates awarded 6 C’s or better | % of candidates awarded 6 C’s or better | |
| BW802 | Gaborone Senior Secondary School | 175 | 22.01 | 156 | 19.28 | -2.73 |
| BW803 | St Joseph’s College | 292 | 34.07 | 310 | 37.21 | 3.14 |
| BW804 | Moeding College | 92 | 13.81 | 117 | 15.54 | 1.73 |
| BW817 | Ledumang Senior Secondary School | 138 | 17.69 | 171 | 20.70 | 3.01 |
| BW819 | Kagiso Senior Secondary School | 87 | 17.86 | 106 | 18.93 | 1.07 |
| BW822 | Naledi Senior Secondary School | 207 | 24.79 | 218 | 27.56 | 2.77 |
Source: Botswana Examinations Council 2022 Summary of Provisional Results
Table 3 above shows the total number of candidates who scored 6 Cs or higher. According to the findings, Masunga has 34.17% of candidates with six Cs or better, while St. Josephs College has the most, with 37.21 (up almost 3% from the previous year). However, most schools show inconsistence performance compared to previous years. (Masunga Senior Secondary School is in a different Region).
A grade of C is regarded as the lowest pass symbol grade. Meaning that the best school in the country and in the South East Region had the best performance results at 37.21%. This without any further explanation depicts poor academic achievement at the national level. Table 3.2 below shows this poor performance.
Table 2 Overall Performance of Candidates in Government Schools for the Past Five Years.
| EXAMINATION YEAR | 6 G’S OR BETTER | 6 E’S OR BETTER | 6 C’S OR BETTER |
| 2022 | 95.45 | 62.59 | 21.37 |
| 2021 | 97.09 | 64.03 | 21.20 |
| 2020 | 96.39 | 65.36 | 21.17 |
| 2019 | 97.66 | 65.02 | 21.12 |
| 2018 | 97.99 | 61.31 | 19.29 |
Source: Botswana Examinations Council 2022 Summary of Provisional Results
For the five years in a row, performance has mostly stayed at around the same level in all grades. A negligible decrease of 1.64% is evident in the percentage of candidates obtaining 6 Gs or more, which is 95.45% as opposed to 97.09% in 2021. This shows that about 4% of candidates scored below 6 grades. There has been a little decrease of 1.44% in the percentage of candidates that received a score of 6 Es or above, from 64.03% in 2021 to 62.59% in 2022. However, the proportion of candidates scoring 6 or more Cs was 21.37%, compared to 21.20% in 2021, showing a negligible improvement of 0.17%.
Table 3 above shows that only 21.37% managed to score pass grades, while 78.63% could not reach the set pass mark. This depicts the trend of academic performance for the past five years in government or public schools.
The target population of the study included 3,807 form four students from five public high schools located in the Southeast Education Region. In this case, responders were form four students. The schools were chosen because they have the largest student enrolment in the country, which makes it intriguing to look at the reasons behind the 20-year fall in their academic achievement. This is one of the criteria for participation in the study. There is currently no literature to support this research conducted at secondary level in Botswana. Even though focus was on the results of terminal examinations. The only material that was available exclusively covered primary and tertiary school levels. Senior high school level starts at form 4, and so it is essential to academically motivate them at the beginning before they enter the final year (form 5) where they will be sitting for their final examinations.
Sampling Techniques
The researcher used purposive, stratified, and basic simple sampling techniques to determine the sample size. Using a purposive sample approach, the area and the schools were selected. In non-probability sampling, purposeful sampling is sometimes referred to as subjective sampling when the researcher uses their judgment to select factors for the sample group. When using stratified sampling, researchers create homogeneous subpopulations called strata from a population based on predetermined attributes such as location, gender identity, or race. In other words, every member in the population under study should belong to a single stratum. Proportional sampling was employed to guarantee an equal number of boys and girls in the study, and stratified sampling was utilized to divide the schools into two categories (day and boarding school). To guarantee that every participant had an equal and independent chance of being chosen, the students were sampled using simple random sampling technique (Cohen et al., 2017). There are two mixed boarding schools and three mixed day schools in the region. A sample of 502 participants was selected using basic random sampling procedures.
Table 3 indicates that the total sample size was 543 students (219 boys and 284 girls) among five public senior high schools. The actual sample size of the schools that took part as well as participants in the study, was 502 participants (205 boys and 297 girls).
Table 3 Sample size
|
Name of school |
Population |
Gender |
Sample from school |
||
| Boys | Girls | Male | Female | ||
| Gaborone SSS | 828 | 370 | 458 | 52 | 65 |
| Naledi SSS | 815 | 332 | 483 | 48 | 69 |
| St Joseph’s College | 835 | 370 | 465 | 53 | 66 |
| Kagiso SSS | 571 | 270 | 301 | 39 | 43 |
| Moeding College | 758 | 315 | 443 | 45 | 63 |
| Sub-totals | 1 657 | 2 150 | 237 | 306 | |
| Totals | 3 807 | (100%) 3 807 | (Approx. 14.3%) 543 | ||
Source: South East Regional Education Statistics Office 2022.
Based on the information presented in Table 3 above, the sample sizes for schools and students are approximately 14.3% male and 14. 3% female, respectively. Gorard (2001) states that a sample size of 10–20% is suitable.
Data Collection Instruments
Data collection tools used in this study were a Motivated Strategies for Learning Questionnaire (MSLQ), a questionnaire for students and evaluation of students’ academic performance in the exam of the second term or mid-year. A Likerk scale of 14 questions (5 for Elaboration, 4 for Organisation, and 5 for Critical Thinking), and five points showing; 5= Very True of me, 4 = True of me, 3 = Not sure, 2= Untrue of me, 1 = Very untrue of me. The respondents’ mean score was 51.68 (SD = 7.94) with a large standard deviation. The minimum score was 18 against a possible minimum of 14 while the maximum score was 69 against the potential highest score of 70. The skewness (Sk = -.51) and kurtosis (Kur = .69) were within the recommended values for normally distributed values. (See Table 3 below).
Table 4 Descriptive Statistics on Students’ Cognitive Engagement
| N | Range | Minimum | Maximum | Mean | Standard deviation | Skewness | Kurtosis |
| 502 | 51 | 18 | 69 | 51.68 | 7.94 | -.51 | .69 |
Instruments Validity
A group of specialists from the School of Education’s Department of Educational Psychology were given the tools to evaluate their face validity. Content validity was also determined through peer reviews. The adjustments suggested were included.
One South East Region public day school took part in the pilot study but was left out of the main study. The internal consistency of the two sets of questionnaires was employed in this study to determine the instrument items’ reliability. Cronbach’s alpha (α) was utilized to determine the research instrument’s reliability coefficient.
Data Collection Techniques
During the time stipulated by the school administration, the researcher administered the instruments. That is, during the afternoon study time for 40 minutes. The instructions for completing the Motivated Strategies for Learning Questionnaire were given to the participants. To determine the participants’ scores for the end-of-third-term examinations, concerned class teachers were requested for copies of their students’ academic progress records.
The data was coded and analyzed using SPSS version 25, a statistical software program for social science analysis. Both inferential and descriptive statistical procedures were applied. Descriptive statistics like mean and standard deviation were used to analyse the participant characteristics, whereas inferential statistics were used to test the null hypotheses. The researcher used Pearson’s product-moment correlation (r) to calculate the strength of the association between cognitive engagement and academic achievement. Pearson product correlation not only indicates the presence or absence of correlation between two variables, but it also determines the precise extent to which they are correlated and the direction of the correlation, which can be positive or negative (Schober et al., 2018).
Ethical Considerations
A week before the data collection, participants were given consent forms to their parents to read through and sign if they allow their children to take part in the study. On the day of data collection, after the participants were fully informed of the purpose of the study and allowed to give their consent, the researcher assured participants of the confidentiality and anonymity of their responses. The researcher also addressed the participant’s concerns about taking part in the study.
RESULTS AND DISCUSSIONS
Demographic Data
The age and sex of the respondents were the demographics that were cross-tabulated in this section. The findings showed that there were more females in the age categories of 15-16 years and the one of 17 years (19.3% and 66.8% respectively), compared to males who were (14.9% and 64% respectively). The results also showed that there were more male students in the age category of 18-19 years (21.2%) compared to females who were (13.9%). The results are shown in Table 5.
Table 5 Respondents’ Age by Gender
| Sex | Age In Years | Descriptive Statistics | ||||||
| N | N | M | SD | Sk | Kur | |||
| Male | 15 to16 | 33 | 222 (44.2) | 17.09 | .65 | .41 | 1.63 | |
| 17 Years | 142 | |||||||
| 18 to 19 | 47 | |||||||
| Female | 15 to16 | 54 | 280(55.8) | 16.96 | .62 | .48 | 1.19 | |
| 17 Years | 187 | |||||||
| 18 to 19 | 39 | |||||||
| Total | 502(100) | 17.02 | .64 | .45 | .91 | |||
Note. N=502. () Implies percentage; n = within age strata sample; N = sample by sex; M = Mean; SD = Standard deviation; Sk = Skewness; Kur = kurtosis
The mean age of the respondents was 17.02 (SD =.64) as shown in Table 4.2. 17-year-olds made up the largest percentage of responders (65.54%). Those who were 15 and 16 years old (17.33%) came next, closely followed by respondents who were 18 to 19 years old (17.13%). The mean age was 16.96 (SD =.621) years for females and 17.09 (SD =.650) years for males. This indicates that female respondents were slightly younger than male respondents. Most male respondents were aged 17 years (64.00%) followed by those aged between 18 and 19 years old (21.20%) and by those aged 15 and 16 years (14.90%). For female respondents, the majority were aged 17 (66.80%) followed by those aged between 15 and 16 years (19.30%) and lastly by those aged 18 and 19 (7.80%). The total number of female respondents was more (55.80%) than male respondents (44.20%) which reflects the ratio of male and female students across learning institutions in Botswana. Skewness and kurtosis values reflect a reasonably normal distribution (Skewness = .452; Kurtosis = .906). According to skewness values should range between -2 and +2 while kurtosis values range between – 10 and +10 for a distribution to be considered normal.
Return Rate of the Research Instruments
The intended return rate of the research instruments utilized in this study, comprising 237 boys and 306 girls, (543 participants); as displayed in Table 6. The researcher managed to collect 519 of the 543 questionnaires which were given. During data coding and cleaning, the researcher had to discard 17 of the questionnaires as they had more than 5 missing entries in one scale. Kang (2013) points out the importance that researchers should decide beforehand on unacceptable targets of missing values. The remaining scales missing values were populated using the linear interpolation option. The researcher could only analyse responses from 502 participants. In other words, the analysis of (92%) of the participants studied is shown in Table 6 below.
Table 6 Return Rate of Research Instruments
| Target Frequency | Actual Frequency | Return Rate % | |
| Male | 237 | 205 | 86.5 |
| Female | 306 | 297 | 97.1 |
| Total | 543 | 502 | 91.7 |
Note. N = 502.
Relationship Between Cognitive Engagement and Academic Achievement
This objective was to examine the relationship between students’ cognitive engagement and academic achievement. After presenting descriptive statistics on the academic achievement and cognitive engagement of the learners, hypothesis testing was conducted.
Description of Students’ Levels of Cognitive Engagement
Students answered a 14-item Motivated Strategies for Learning Questionnaire (MSLQ) developed by Primrich et al. (1991) to gauge their level of cognitive involvement. On a 5-point Likert scale, the responses ranged from “not true of me” (1) to “very true of me” (5). After adding up all 14 items’ scores, a summated score was produced.. Scores were expected to range between 14 and 70. Table 7 provides a summary of the cognitive engagement scores of the students. After analyzing the cognitive engagement scores of the students, the mean, standard deviation, skewness, kurtosis, minimum and maximum scores, and range were provided.
Table 7 Descriptive Statistics on Students’ Cognitive Engagement
| N | Range | Minimum | Maximum | Mean | Standard deviation | Skewness | Kurtosis |
| 502 | 51 | 18 | 69 | 51.68 | 7.94 | -.51 | .69 |
The respondents’ mean score in Table 7 above was 51.68 (SD = 7.94) with a large standard deviation. The minimum score was 18 against a possible minimum of 14 while the maximum score was 69 against the potential highest score of 70. The skewness (Sk = -.51) and kurtosis (Kur = .69) were within the recommended values for normally distributed values.
To group the scores for purposes of comparison, students’ reported scores were transformed into Z scores and then categorised as high, moderate and low based on whether scores fell higher or lower than the sample mean. A value below and over one standard deviation was classified as low and high respectively whilst those in between were classified as medium. Table 8 below illustrates this.
Table 8 Respondents’ Cognitive Engagement Levels
| Cognitive engagement Level | Frequency (%) | M | SD |
| Low | 67 (13.3) | 38.18 | 5.199 |
| Moderate | 334 (66.5) | 51.60 | 4.131 |
| High | 101 (20.1) | 62.86 | 2.237 |
Note. N = 502. M = mean; SD = Standard Deviation.
Data displayed in Table 8 above shows that nearly two-thirds (66.5 %) of the respondents had moderate levels of cognitive engagement, while 20.2% had higher levels of cognitive engagement, and a further 13.3% had low cognitive engagement levels.
Descriptive statistics were used to analyze participant range, mean, standard deviation, skewness, and kurtosis for each of the three subscales of cognitive engagement—elaborative, organizational, and critical thinking. Table 9 displays these statistics.
Table 9 Descriptive Statistics of the Subscales of Cognitive Engagement
| SubScale | Items | Range | Min | Max | M | SD | Sk | Kur |
| Elaboration | 5 | 4 | 1 | 5 | 3.76 | .65 | -.78 | 1.15 |
| Organization | 4 | 4 | 1 | 5 | 3.71 | .77 | -.48 | -.13 |
| Critical thinking | 5 | 3.6 | 1.4 | 5 | 3.59 | .72 | -.24 | -.19 |
Note. N = 502. Min = minimum statistic; Max= maximum statistic; M = mean; SD = standard deviation; Sk = skewness; Kur = kurtosis.
Table 9 above shows that the results ranged from 4 on all five subscales. 1 was the lowest score, and 5 was the highest mean score. The minimum score of 1.4 for the critical thinking domain was higher than the scores of elaboration 1 and for organization 1. Elaboration had the highest score of 3.76 (SD = .65) followed by Organization at 3.71 (SD = .77) and then Critical thinking at 3.59 (SD = .72). This implies that respondents rated themselves relatively highly on elaboration strategies than on organizational and critical thinking strategies. It was evident from the skewness and kurtosis readings that the distribution of all the subscales was fairly normal. As the majority of the self-reported scores were above the mean, all subscales were negatively skewed.
Hypothesis Testing
This null hypothesis was tested to investigate the relationship between academic achievement
and cognitive engagement.
H0: There is no significant relationship between cognitive engagement and academic achievement.
Using the Pearson Product Moment Correlation Coefficient, a bivariate correlation analysis was conducted. Following guidelines by Cohen (1988) an effect size of r2 = .10 is regarded as small, an effect size of (r2 = .30), medium and (r2 = .50) is considered large. A scatter plot was utilized to determine the linearity assumption; and as Figure 1 below shows, a linear relationship between academic achievement and cognitive engagement was established.
Figure 1 Cognitive Engagement
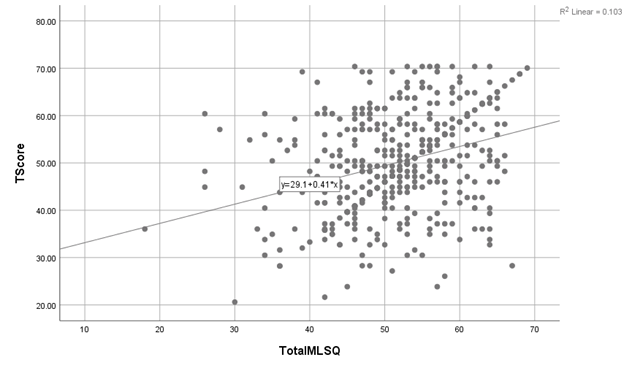
The level of cognitive engagement barely explained the variance in academic achievement (r2 = 10.3%), as illustrated in Figure 1 above.
Pearson product-moment correlation was conducted to evaluate the relationship between academic achievement and cognitive engagement. Table 10 below presents the findings.
Table 10 Correlation Between Cognitive Engagement and Academic Achievement
| ra | |
| Cognitive Engagement | .32** |
Note. N = 502.
aCorrelation with Academic Achievement.
**Correlation Significant at 0.01 level, two-tailed.
Table 10 displays the data, which suggests a weak positive correlation (r (500) =.32, p <.01) between academic achievement and cognitive engagement. The findings show that when students’ cognitive engagement increases, so does their academic achievement levels. As a result, the null hypothesis was rejected, and it was determined that there was a substantial and positive relationship between students’ academic achievement and their cognitive engagement.
Discussion of the Findings
Determining if academic achievement and cognitive engagement were related was the objective of this research. Descriptive analyses showed that most of the students had medium levels of cognitive engagement across the three sub-dimensions; organisation, elaboration and critical thinking. This indicated that most students thought they applied self-regulated learning strategies and engaged moderately in learning tasks with a defined strategy and goal. They also thought they applied cognitive engagement and self-regulated learning approaches.
Furthermore, the descriptive analyses were supported by the hypothesis testing results, which showed an intriguingly robust, moderate, and beneficial correlation between students’ academic achievement and cognitive engagement. This shows that the cognitive self-regulation techniques students employed to learn were correlated with their academic achievement in a relative sense.
The results of this investigation validate those of a previous study conducted by (Estévez et al. 2021). The study conducted among 717 fifth and sixth graders in Spain, found that the majority of the students demonstrated fairly high cognitive engagement (31.95%) or 24 moderate cognitive engagement (56.48%). Despite the variations in developmental characteristics of the samples the findings revealed that highly cognitively engaged students performed better academically, better controlled their time and study environments, were more purposeful in their knowledge searching and displayed less maladaptive regulatory behaviour.
The results of this stududy, which included a university sample, are consistent with those obtained by (Mehrdadian et al. 2020). The study demonstrated that informational identity style has a direct and on cognitive engagement via the intermediary function of mastering objectives, which resulted in better academic outcomes. The study established that the commitments students made to their learning related hctivities had an incremental association with the desired attitudes such as excellent academic achievement, resilience and students emotional wellbieng.
The results also align with the findings of Linnenbrink-Garcia et al. (2018), who found a substantial relationship between the academic achievement of students and their motivational beliefs. While this study focused on motivational beliefs rather than cognitive engagement, it highlights the interconnectedness of motivation and engagement in influencing academic achievement. Additionally, the study emphasized how self-efficacy beliefs enhance both motivation and cognitive engagement.
Moreover, the study findings in a Malaysian sample by Sukor et al. (2021) align with those of the current study. Academic achievement and overall student engagement, including cognitive engagement, were found to be positively correlated in a fairly significant way. This is in line with the current study’s findings, which show that cognitive engagement has a major impact on academic achievement. The study underlined once more how crucial it is to provide a stimulating learning environment to support student academic achievement.
Regionally, findings from a similar demographic sample of secondary school students in Kenya by Wara (2018) were found to align with those in the current study. Under the self-determination perspective, the study examined the relationship between students’ cognitive engagement and academic achievement. There is an approximately moderate relationship between student academic achievement and students’ participation and cognitive engagement in learning activities. The study also emphasised how interactions between teachers and students can foster cognitive engagement.
Conclusively, research has shown that cognitive engagement has a significant relationship with academic achievement in various settings. Variations in the strengths of the associations were recorded in line with the students’ developmental level with studies in elementary school learners having a stronger relationship to academic achievement than in secondary school and tertiary level samples.
SUMMARY, CONCLUSIONS AND RECOMMENDATIONS
Summary
The purpose of this study was to ascertain whether cognitive engagement has an influence on the academic achievement of Form Four students in the South East Region of Botswana. Finding the model for predicting the academic achievement of students determined by cognitive engagement was, in essence, the study’s main purpose.
The objective was to determine the connection between academic achievement and students’ cognitive engagement. The results indicated a positive correlation between academic achievement and cognitive engagement. The results indicated that levels of academic achievement increase with an increase in students’ cognitive engagement.
Conclusions
The study discovered a strong correlation between academic achievement and learners cognitive engagement. Additionally, the researcher discovered that student academic achievement was predicted by cognitive engagement. In other words, academic achievement increases with increased levels of cognitive engagement. Students with high levels of cognitive engagement scored high marks academically, while those with low levels of academic engagement scored low marks. The findings imply that, it is very essential that students be assisted and trained to enhance their cognitive engagement for better academic achievement.
Therefore, to enhance academic achievement students need to be more sensitized and guided more on cognitive engagement subscales that better predict academic achievement.
The study’s findings demonstrated that academic motivation and cognitive engagement—the two predictor variables in the equation for predicting academic achievement—both significantly impacted academic achievement. The findings revealed that, cognitive engagement subscales, Critical Thinking and Organization had the largest and most significant predictors of academic achievement. On the same direction, extrinsic motivation contributed less to the prediction of academic achievement.
Recommendations
The following recommendations were provided in accordance with the research findings.
- Policy Recommendation
The results demonstrated a favorable relationship between academic achievement and cognitive engagement. Results indicated that levels of academic achievement increase with students’ cognitive engagement. Therefore, the study recommends that education trainers through pre-service and in-service training should consider implementing required courses to assist instructors in cascading the knowledge, skills and abilities needed by trainees to support students in cultivating academic motivation and cognitive engagement in objectively supporting students to reach their academic achievement goals.
- Recommendations for Further Research
- In this study, data was gathered through questionnaires and the results thereof are based on quantitative data. To fully comprehend the relationship between academic motivation, cognitive engagement, and academic achievement at the secondary school level, similar studies using a mixed study design should be explored.
- High school students in Botswana’s South East Region participated in this study. Similar studies could be carried out in Botswana’s other educational regions to corroborate the findings of this research.
- In this study the overall score or grade a student received on their term two examinations was used to determine academic achievement. Even though the scores were standardized, to improve the validity and reliability of the outcomes, future research should employ a standard classroom test that is created and provided in a controlled setting. Additional studies should investigate connections between academic motivation and cognitive engagement in particular subject areas like Business studies, Mathematics, Information technology, Design and technology, and Setswana.
REFERENCES
- Al-Alwan, A.F. (2014). Modeling the Relations among Parental Involvement, SchoolEngagement and Academic Performance of High School Students. DOI:10.5539/ies.v7n4p47 https://doi.org/10.5829/idosi.mejsr.2014.21.10.85168.
- Bandura, A. (1977). Self-efficacy: Toward a unifying theory of behavioral change.Psychological Review, 84(2), 191-215
- Bandura, A. (1989). Social cognitive theory. In R. Vasta (Ed.), Annals of child Vol.6. Six theories of child development (pp. 1-60). Greenwich, CT: JAI Press.
- Bulger, M. E., Mayer, R. E., Almeroth, K. C., & Blau, S. D. (2008). Measuring Learner Engagement in Computer-Equipped College Classrooms. Journal of Educational Multimedia and Hypermedia,17 (2), 129-143
- Chen, P.-S. D., Gonyea, R., & Kuh, G. (2008). Learning at a distance. Journal of online education,4(3). http://innovateonline.info/index.php?view=article&id=438&action=login
- Cohen, J. (1988). Statistical power analysis for the behavioral sciences (2nd ed.). Hillsdale. NJ: Erlbaum
- Estévez, I., Rodríguez-Llorente, C., Piñeiro, I., González-Suárez, R., & Valle, A.(2021). School Engagement, Academic Achievement, and Self-Regulated Learning.
- Gorard, S. (2001). Quantitative Methods in Educational Research: The role of numbers Made easy. London: Continuum.
- Kang, H. (2023). The prevention and handling of the missing data. DOI: 10.4097/kjae.2013.64.5.402
- Krause, K.-L., & Coates, H. (2008). Students’ engagement in first-year university. Assessment & Evaluation in Higher Education, 33(5), 493–505. https://doi.org/10.1080/02602930701698892
- Linnenbrink-Garcia, L., Wormington, S.V., Snyder, E., Riggsbee, J., Perez, T., Ben- Eliyahu, A., & Nancy E Hill, N.E. (2018). Multiple pathways to success: An Examination of intergrative motivational profiles among upper elememntary and college students. Journal of educational psychology 110 (7), 1026
- McLeod, S. A. (2016). Bandura — Social Learning Theory. http://www.simplypsychology.org/bandura.html
- Mehrdadian, P., Rabiei, M., & Razieh Khosrorad, R. (2020). Fitting a Model to StudentsCognitive engagement: A Step Towards Accountable Education in Medical Education.
- Metallidou, P., & Vlachou, A. (2007). Children’s self-regulated learning profile in language and mathematics: The role of task value beliefs.
- Pintrich, P., Duncan, T., Smith, D., & McKeachie, W.J. (1991). Motivated Strategies for Learning Questionnaire (MSLQ) Manual. DOI:10.13140/RG.2.1.2547.6968
- Ryan, R.M., & Connell, J.P. (1989). Perceived Locus of Causality and Internalization: Examining Reasons for Acting in Two Domains. Journal of Personality and Social Psychology,57,749-761.
- Schober, P., Boer, C. & Schwarte L.A. (2018). Correlation coefficients: appropriate use and interpretation.Anesth Analg. 126:1763–1768.
- Stovall, I. (2003). Engagement and Online Learning. UIS Community of Practice for E-Learning. http://otel.uis.edu/copel/EngagementandOnlineLearning.ppt
- Sukor, R., Ahmad, F., Nor-Khaizura, M-A-R., & Farawahida A. H. (2021). Relationship Between Students’ Engagement with Academic Performance Among Non-Food Science Students Enrolled in Food Science Course. Journal of Turkish Science Education 18(4):638-648.
- Tan, L. (2014). Correlational Study. In Thompson, W.F. (Ed.), Music in the Social and Behavioral Sciences: An Encyclopedia (pp. 269-271). Thousand Oaks: SAGE Publications.
- Trilling, B. & Fadel, C. (2009). 21st Century Skills Learning for Life in Our Times. San Francisco: Jossey-Bass.
- Wara, E., Aloka, P. J., & Odongo, B. C. (2018). Relationship between cognitive engagement and academic achievement among Kenyan secondary school students. Mediterranean. Journal of Social Sciences, 9(2), 61-72.
- Wentzel, K.R. (2003). School adjustment. https://doi.org/10.1002/0471264385.wei0711
APPENDIX
APPENDIX A: CONSENT TO PARTICIPATE IN THE STUDY
I am a student at Kenyatta University in the Department of Educational Psychology. I am undertaking research to investigate how students plan to achieve their academic goals guided by motivation and cognitive engagement. The findings will help to provide better guidelines for; enhancing students’ academic motivation and; choice of appropriate cognitive engagement for passing examinations.
You will be required to answer questions about yourself. Your participation in this study is voluntary and you will not suffer any dire consequences for non-participation.
I would like to request you to complete this research questionnaire and help in this noble task. Remember that all the information you give will be treated with ultimate confidentiality.
Kindly sign in the space provided if you agree to participate in the study.
(…………………………………………) I agree to participate in this study.
Thank you very much for agreeing to participate in the study.
Yours Respectfully,
Rampete Moji
M. ED student, Kenyatta University.
APPENDIX B: Questionnaires for Students
Part I: Background Information
Please read the following questions carefully and fill in the blank spaces or put a
tick (√) in the brackets where appropriate.
- Admission no. _______________________________________
- Gender: Boy ( ) Girl ( )
- Age in years ( )
- Name of school__________________________________________
- Residential status:
A boarder ( ) A day scholar ( )
Part II: Motivated Strategies for Learning Questionnaire (MSLQ)(Cognitive Engagement)
The following questionnaire is about cognitive engagement. There are no wrong or right responses. Just answer as accurately as possible. Answer the questions about how you study as accurately as possible. The responses will be; 5= Very True of me, 4 = True of me, 3 = Not sure, 2= Untrue of me, 1 = Very untrue of me. Read the statement carefully and put a tick (P) against the statement that describes how you study.
| STATEMENT | RESPONSES | |||||
| ELABORATION | Very true of me | True of me | Not sure | Untrue of me | Very untrue of me | |
| 1. | I try to relate ideas in any subject to those in other subjects whenever possible. | |||||
| 2. | When reading for any subject, I try to relate the material to what I already know. | |||||
| 3. | When I study for any subject, I write brief summaries of the main ideas from the readings and the concepts from the subject. | |||||
| 4. | I try to understand the material in a lesson by making connections between the readings and the concepts from other lessons. | |||||
| 5. | I try to apply ideas from any subject readings in other class activities such as lessons and discussion. | |||||
| ORGANIZATION | Very true of me | True of me | Not sure | Untrue of me | Very untrue of me | |
| 6. | When I study the readings for any subject, I outline the material to help me organize my thoughts. | |||||
| 7. | When I study for any subject, I go through the readings and my class notes and try to find the most important ideas. | |||||
| 8. | I make simple charts, diagrams, or tables to help me organize any subject material. | |||||
| 9. | When I study for any subject, I go over my class notes and make an outline of important concepts. | |||||
| CRITICAL THINKING | Very true of me | True of me | Not sure | Untrue of me | Very untrue of me | |
| 10. | I often find myself questioning things I hear or read in lessons to decide if I find them convincing. | |||||
| 11. | When a concept, interpretation, or conclusion is presented in class or in the readings, I try to decide if there is good supporting evidence. | |||||
| 12. | I treat any subject material as a starting point and try to develop my own ideas about it. | |||||
| 13. | I try to play around with ideas of my own related to what I am learning in any subject. | |||||
| 14. | Whenever I read or hear an assertion or conclusion in any subject, I think about possible alternatives. | |||||
Thank you very much for responding to all the items in the questionnaire.
APPENDIX C: ACADEMIC ACHIEVEMENT PROFORMA TABLE
| CODE NO. | TERM 3 TOTAL SCORE | TERM 3 MEAN MARK |