
Comparative Analysis of Facebook Page Marketing: Case Study of Chinese and Norwegian Agricultural Companies in Myanmar
- Kyu Kyu Thin
- Tian Xi
- Moh Moh Zaw Thin
- 1871-1890
- Jul 17, 2024
- Digital Marketing
Comparative Analysis of Facebook Page Marketing: Case Study of Chinese and Norwegian Agricultural Companies in Myanmar
Kyu Kyu Thin, Tian Xi, Moh Moh Zaw Thin
College of Economic and Management, Nanjing Agricultural University, Nanjing, Jiangsu, China
DOI: https://dx.doi.org/10.47772/IJRISS.2024.803135S
Received: 20 May 2024; Revised: 12 June 2024; Accepted: 17 June 2024; Published: 17 July 2024
ABSTRACT
Facebook is powerful business tool that businesses to establish their online presence on one of the world’s largest social media platforms exploring foreign markets, accelerating internationalization, and improving performance in foreign markets. Facebook not only offers a range of advertising programs, but it also lets business customize their own profile and public relevant content to build their own community around their brand. The purpose of this study is to explore an effective Facebook marketing strategy applied by Chinese and Norwegian companies, identifying differences and similarities in their approaches. The study conduct data mining to track and summarize engagement activities on the official Facebook pages for a period of one-year (starting from January 1 to December 31, 2023) and analyzed total 191 posts of two foreign-based companies in Myanmar, 177 posts of a Norwegian company and 14 posts of a Chinese company. This total 191 posts, the authors manually entered into Microsoft excel sheet and then converted into a format for analysis. The analysis is conducted using Microsoft Excel to compare Facebook engagement and to apply Arman’s engagement rate formula for evaluating the quality of Facebook engagement. The results show that Chinese and Norwegian companies effectively used the product information text with images on Facebook is popular with customers, generating increasing likes, shares and comments and improving page engagement, which boosts customer purchases. Engagement Rate is vital for Facebook optimization, indicating a page’s influence on its followers, with the study revealing that Chinese Facebook page have higher engagement rate than Norwegian Facebook page. Additionally, Norwegian company effectively maintain customer relationships through live chat automated responses, providing timely information, reduction uncertainty, and increasing sales by understanding customer needs and potential purchasing behaviors.
Keyword: Social Media Marketing, Facebook Marketing, Engagement Rate, Comparative Analysis, Foreign- Based Companies, Myanmar
INTRODUCTION
Background of the Study
In the current dynamic global business environment, internet, mobile apps, and social media marketing tools have become as an approach to building a relationship between companies and customers in order improve the living standards of people globally (Dwivedi et al., 2021). In an increasingly digitized and connected world, businesses can boost their competitiveness, strengthen their relationships with customers, and achieve their business objectives by using social media effectively (Harvey, 2014). Furthermore, social media platforms have become vital tools for businesses to communicate with their target audiences, promote products, and create brand awareness. Thus, the social media marketing tools have a positive related to the performance scale of business, but not relationship with firm performance(Ivanova & Wang, 2014). Moreover, Chen, H., and Ma. D., & Wang. R., (2021) stated that Chinese entrepreneurs believe that the social media marketing tools are flexibility, sensitivity and better communication with consumers. Social media are regarded as platforms such as Facebook, Instagram, Twitter and others on which people build networks and share information. To implement a successful social media marketing strategy, a deep understanding of the user behavior towards different posts on social media platform (Tsimonis & Dimitriadis, 2014). It is crucial for social media marketer to enhance follower responsiveness and engagement rates.
In Myanmar, social media, the rate of mobile phone and internet used is increasing very fast and in 2023, 27.6% (15 million) of the total population has been used social media in Myanmar. In developing countries like Myanmar, Olanrewaju (2018) stated that social media played an important role in driving entrepreneur’s motivation to start businesses and in shaping their marketing strategies (Olanrewaju et al., 2018). But, agricultural companies in Myanmar are facing a range of issues, including ineffective sale and marketing strategies; lack of skilled sale mangers and technicians; weak marketing channel between the companies’ services and farmers (FAO, 2005). These issues have underpinned the development of agricultural sector in Myanmar. There is a need for the growth of market innovation and process innovation which will lead to improve revenue of agricultural companies in Myanmar.
There has been very limited research regarding effective sales strategies using social media marketing tools in Myanmar (Dwivedi et al., 2021, 2023). Therefore, the current study aims to fill this gap in the research by comparing social media marketing that Chinese and Norwegian companies use on their official Facebook page. China and Norway are among the world’s leading economies, and their corporate communication efforts play a crucial role in shaping their global brand presence. This study analyzed how agricultural companies in Myanmar such as Chinese and Norwegian agricultural companies undertaking business use social media marketing tools in order to influence the global customers.
Research Objectives
The main objectives of this research are to explore Facebook page marketing strategies of Chinese and Norwegian companies, identifying differences and similarities in their approaches. The goal is to provide insights and recommendations for optimizing Facebook marketing in diverse markets.
LITERATURE REVIEW
Social Media Marketing across Globalization
In the current dynamic global business environment, internet, mobile apps, and social media marketing tools have become as an approach to building a relationship between companies and customers in order improve the living standards of people globally (Dwivedi et al., 2021; Htut et al., 2022). Social media has plenty of applications in marketing, including building networks, participation of consumers, sales, and brand awareness. In an increasingly digitized and connected world, businesses can boost their competitiveness, strengthen their relationships with customers, and achieve their business objectives by using social media effectively (Harvey, 2014). (Kaplan & Haenlein, 2010) defined social media as “a group of Internet-based applications that based on technological and ideological foundations of Web 2.0, and that allow the creation and exchange of user-generated content. According to (Hurmelinna-Laukkanen et al., 2020), it affects several aspects of businesses’ internationalization processes, including the timing, speed, and rhythm of international expansion as well as choices about market entry strategies and locations, foreign market learning, and knowledge recombination. The ability of business to handle the difficulties of operation in foreign contexts is impacted by social media’s critical role in allowing access to resources and skills in both home and host markets (Hervé et al., 2020). The study by (Vestbro & Wilkinson, 2011), indicated that retailers, media organizations, consumer partners, and digital services may all engage and communicate with other with less cost and time when using social media for innovative marketing activities. Social media are regarded as platforms such as Facebook, Instagram, Twitter and others on which people build networks and share information. For business perspective, social media platforms offer unique chance to connect with their customers, build brand, influence customer attitudes, receive feedbacks, and drive sales (Andzulis et al., 2012). Moreover, Wang stated that Chinese entrepreneurs believe that the social media marketing tools are flexibility, sensitivity and better communication with consumer (Wang et al., 2020). Furthermore, social media offers a place for businesses to approach their brand and contribute in two-way communication with their customers. Due to the unique characteristic as ” vibrant, interrelated, transparent”, social media in marketplace bought the success of marketing campaigns with the help of social media’ insightful statistics and analytics. Therefore, by leveraging the power of social media, international business can expand competitive in today’ digital landscape. Todays, social media marketing have becoming as a brand sustainability strategy (Adwan & Altrjman, 2024; Dubbelink et al., 2021), a key to business success (This, n.d.). By addressing above statement, social media in globalization involved as cases of this study and is important as the social media marketing is a strategy for determining how different foreign-based companies influence customers across the global markets.
Word-of-Mouth (WOM) Marketing as a Viable Strategy
Word-of-Mouth (WOM) Marketing is defined as dialogues between customers on goods, services, brands, have become vital part of today’s marketing strategies (Meiners et al., 2010). The opinions and choices of one’s peers have a significant influence on consumer purchasing decisions, and peer-to-peer communication is a very valid and trustworthy source of product information. As a result, business can use these communication networks and online platforms to promote their brands through electronic forms of WOM. Since a wide range of social media platforms are growing in popularity and maturity and serving as essential resources for influencing decision-marker, WOM marketing is swiftly taking the forefront in all marketing strategies. According to (Brown, 2010), understanding customer talk and behaviors is the first step towards developing a successful social media strategy. When company can engage with and assists others, customers are more likely to respond to its social media approach. Brown (2010) explain that prior to developing a social media strategy, it is imperative for a company to attentively observe the opinions and discussions of existing online communities on their products and services. Therefore, the focus of user-generated content is on consumer dimension information, with the general public generating and disseminating this data more frequently than marketing personnel. Anyone can access and generate user-generated content through the internet, reflecting the creator’s effort. The process of user-generated content creation is driven by changes in perception, self-promotion, and personal satisfaction. Online brand communities have also emerged as platforms for popularizing and leveraging user-generated content to gain consumer insights.
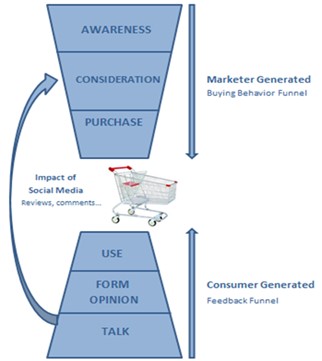
Figure 1: The Social Purchasing and Feedback Cycle, Celine ARCA,2012
Celine ARCA (2012) showed that user-generated media have impacted firm generated content. Moreover, investigation over the influences of the feedbacks by other customers is necessary for developing purchase intention and brand trust (Arca, 2012). In respect to the argument above, the study aims at comprehending the social media marketing of brands for interaction and engagement with the customers. Notably, the existing literatures are limited on the appropriate response strategies of brands on social media activities.
Social Media Marketing in Myanmar
Myanmar has an ethnically diverse population of approximately 54.38 million and nearly 70% of the total populations are living in rural area and they mainly rely on agriculture for their livelihoods. Since Myanmar’s transition to civilian rule in 2011, the use of smartphones has exploded. The country today has a smartphone penetration rate of 80 percent and app developers have been quick to create apps for everything ranging from healthcare to Myanmar parliament. Social media, the rate of mobile phone and internet used is increasing very fast and in 2023, 27.6% (15 million) of the total population has been used social media in Myanmar. In developing countries like Myanmar, Olanrewaju (2018) stated that social media played an important role in driving entrepreneur’s motivation to start businesses and in shaping their marketing strategies (Olanrewaju et al., 2018). The accessibility and speed of internet connection, changing consumer behavior, and social media as a promotional tool are all the significant elements affecting a business’s ability to succeed (Momen et al., 2020). Amid the growth of Internet access across the country, social media usage remains influential among farmers in Myanmar.
Recently, COVID pandemic have been encouraged people to stay at home to prevent the spread of virus. As a result, people are spent more time on internet and there promoted approximately 53% of internet users in 2021 (figure 2), representing approximately more than half of the country’s population. Among them, young people aged 13–35 years are the most prevalent users of social media[1]. This number is expected to rise as more people gain access to social media platforms and the Internet. Most of the local businesses are trying to launch online programs to sell and promote their products (Htut et al., 2022). While social media is often seen as a cost-effective marketing tool showing that businesses adopting digital media reduced their costs by 40%–60% and their five-year revenue growth was fivefold than that of competitors (Kirtiş & Karahan, 2011).
However, After February 2021 of military coup in Myanmar, with the social media ban, Myanmar internet users faced the challenge of increasing internet & communication costs (28.6%), and limited availability of news (28.3%) the most. On the other hand, VPN for the first time have observed an increase in their personal usage of this service. Even challenge on social media consumption, the actual number of internet users has still increased after coup. This indicates that despite the social media ban, people in Myanmar still depended on the internet for various activities and has thus attempted to connect to the internet more times.
According to a Telenor report, 78% of Myanmar Internet users have poor digital literacy skills due to their lack of previous experience with digital media. So, the internet users often faced with social media and monetary fraud. That why, at the heart of this investigation lays the pivotal role played by social media marketing in reshaping the business narrative.
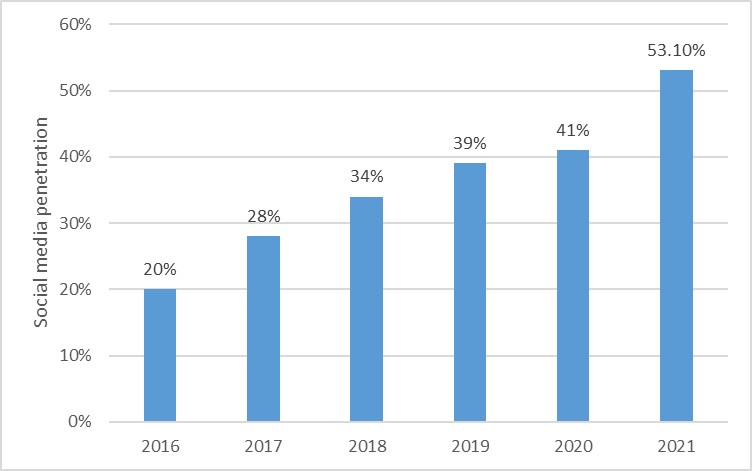
Figure 2: Active social media users as a share of the total population in Myanmar from 2016 to 2021
Social networking sites enhance communication, customer relationships, brand awareness, image building and sales in businesses (BİLGİN, 2018). Moreover, social media reduced dramatically geographical barriers, as well, allowing businesses to more easily conduct international business by influencing the timing and pace of internationalization, market entry decisions, and foreign market knowledge acquisition.
The study on marketing in the literature suggests that social media can be an effective tool for internationalization strategies, exploring foreign markets, accelerating internationalization, and improving performance in foreign markets. However, it is important for companies engaged in international activities to understand how social media works in an international environment and how it can be effectively utilized. Therefore, this research embarks on a journey to dissect the dynamic interplay between evolving global circumstances and the strategic maneuvers of businesses and also marketing manager how to penetrate brand awareness on the Myanmar situation as host country.
Social Media Platforms in Myanmar
Currently available in Myanmar are social media apps including Facebook, Instagram, YouTube, Pinterest, Twitter, LinkedIn. All of the apps need Android smartphones, and most of them require internet access, which might cost farms cash even though downloading the app is free. Facebook are the most widely used social media platforms in Myanmar. Farmers use Facebook not only to exchange market of planting information also to interact in ways structured by existing social, political and economic relations. Despite the country’s social media ban, Facebook usage increased the most in Myanmar, indicating the platform’s continued popularity (figure 3)(Ridout et al., 2020).
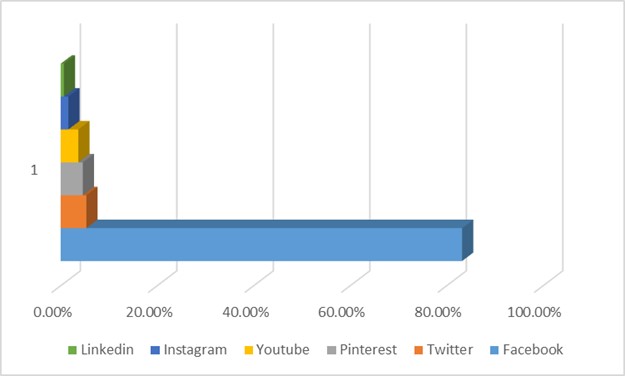
Figure 3: Social media Platforms in Myanmar (Ridout et al., 2020)
Social media generates and sells cost-effective goods, increases revenue, and supports rural families’ attitudes toward entrepreneurship (Jones et al., 2015). To assist tiny family farms in becoming successful, social media has developed Myanmar’s largest platform for agricultural services, including finance, advice, and farm technology. Social media platforms like Facebook, which are intended to provide agricultural information, have gained a lot of prominence among those involved in the agriculture value chain (eg., farmers, retailers, input suppliers, and staff members of agricultural extension) as an opportunity for communication and discussion on farming and related subjects. For instance, weekly talks on crop fertilizer management are organized by Yara and Know-You Seed Companies, which is Myanmar’s biggest producer and distributor of agricultural technology, including seeds and fertilizers.
At present, the agricultural Facebook page in Myanmar has developed into an active platform for stimulating discussions, resolving farming-associated problems, and serving as a network for knowledge sharing and networking between farmers and business players. Many internet users in Myanmar purchase products online mostly because they are good relative choices at low prices, which is the reason they accept the information they see online. Additionally, most farmers stated that they confirm the accuracy of the news they read on social media by visiting other Facebook pages or getting advice from friends and relatives (Bhattacharjee & Raj, 2016).
Based on this in-depth understanding, the study’s concept and purpose is to fill the gap in how international agriculture businesses use Facebook digital platform to interact with customers and stay relevant in the ever-changing business landscape. Further highlighting the need for specific studies is the lack of literature discussing successful Facebook marketing in the setting of Myanmar’s developing economy.
Facebook Business Page
Facebook is the most popular social networking site, with over 400 million active members(Dr. Shree Bhagwat, 2013) . Businesspeople created “Facebook page” to advertise their products for potential customers. Facebook page is powerful business tool that businesses to establish their online presence on one of the world’s largest social media platforms. Facebook page not only offers a range of advertising programs, but it also lets business customize their own profile and public relevant content to build their own community around their brand. Furthermore, it gives businesses the exceptional chance to target individuals very precisely and start two-ways communication with customers. It is possible to post several kinds of content such as text updates, images, videos, events, offers, and links to blog or website with scheduling tools. According to Balaji (2023), trust based on content and engagement is vital for the effectiveness of social media marketing (Balaji et al., 2023). To implement a successful Facebook marketing, a deep understanding of the user behavior towards different posts on Facebook page. It is crucial for marketer to enhance follower responsiveness and engagement rates. Each follower not only becomes a potential active user but also extends the company’s reach into their personal network through Facebook’s unique capabilities (Pereira et al., 2014). Therefore, this study extensively investigates how Facebook marketing engagement affects followers, it does so by analyzing and comparing the official Facebook pages of Chinese and Norwegian companies. The study aims to identify the strategies used in these two countries and understand their effectiveness in engaging and influencing their respective audiences. This comparative approach will shed light on the strategic differences in social media marketing, providing a comprehensive understanding of how to optimize Facebook engagement across diverse regions.
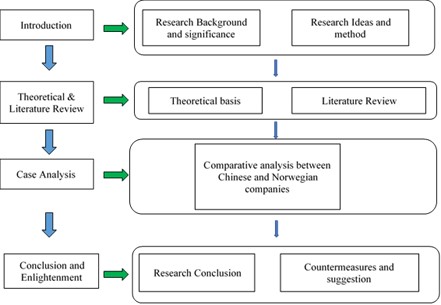
Figure 4: Initial Conceptual framework (Source: Author’s conceptualization)
The study is motivated by the need to understand how social media connects to global business landscape. The following section of the paper is structured as follows.
Table 1: Variable Clarification
| Name of variable | Characteristics |
| Product information | – refers to details and specifications about a particular product or service. This information typically includes features, benefits, usage instructions, technical specifications, pricing, and any other relevant details that help consumers make informed purchasing decisions. |
| organizational information | – refers to details and data about a company or entity, including its history, mission, values, structure, leadership, company anniversary, hiring staff, involvement – based activity information. |
| Ground information | – refers to firsthand knowledge or insights obtained from direct experience or observation in real-world settings including case studies, or demonstrations conducted on-site to showcase successful outcomes, best practices, or the effectiveness of products. |
| Recognition days | – refer to designated dates or events set aside to celebrate accomplishments, raise awareness about important issues, or show appreciation like farmer day, soil health day, world food day, global fertilizer day, LGBTQIA, Earth day, World environmental Day or International Women’s Day. |
| Knowledge sharing | – refers to sharing of knowledge to give farmer as an information related to weather patterns, market conditions, and agricultural practices. |
| Promotion | – refers to a marketing strategy to provide potential customers with necessary information that attract them to purchase the products. |
| image post | – cover pictures/profile post
– image post of products – post of company logo |
| Post with details of image | – image with details text about promotion
– image with details text about product information – image with details text about organization information – image with details text about ground information – image with details text about recognition days – image with details text about knowledge sharing – image with a link to another social site |
| video with details post | – video demonstrating all parts of a product
– video describing products’ technical issues – videos on company image – other product-related entertaining videos |
RESEARCH METHODOLOGY AND DATA ANALYSIS
Research Context
The choice of contexts for this research based on two factors: a well-known social media context and willing to participate (Etikan, 2016; Food et al., 2019). Choosing different firms for this research illustrated the complex relationships between theoretical constructs and empirical evidence and allowed to generalize the results back to theory rather than to the sample population. Table 5 indicates the detailed context of case study companies. The two companies are Known-You seed Co., Ltd., based in China and Yara Myanmar, based in Norway. Depending on number of foreign markets served, Known-You seed Co., Ltd. provides seed varieties over 12 foreign markets, and Yara international serves Agro-chemical fertilizers over 160 overseas markets. The Chinese and Norwegian agricultural firms applied Facebook Page as a social media marketing instrument and Facebook messenger used as conversation tools in Myanmar since 2021 and 2018 respectively. Facebook messenger is a messaging platform designed for direct communication and customer engagement, shared the same parent company with Facebook.
Table 2: Company Context
| Firms | Business Sector | Headquarters | Number of foreign markets served | Social Media currently used for marketing | |
| China | Known- You Seed | Seed production | Taiwan | 12 | Facebook Page, Facebook Messenger |
| Norway | Yara Myanmar | Agro-Chemical Fertilizers | Norway | 160 | Facebook Page, Facebook Messenger |
Data Collection
With the aim of comparation between the case study companies, the author used comparative analysis to obtain a consistent understanding about Facebook page engagement. For comparative analysis, the study manually performed data mining to track and summarize engagement activities on the official Facebook pages for a period of one-year (starting from January 1 to December 31, 2023). This study analyzed total 191 posts of case study companies in Myanmar,177 posts of a Norwegian company and 14 posts of a Chinese company. This total each 191 posts, the authors manually entered into Microsoft excel sheet and then converted into a format for analysis.
Measure of Facebook Engagement Rate
This study examined four types of comparations between Chinese and Norwegian companies: Facebook page content, types of Facebook posts, generation of likes, shares, comments based on post type and the quality of Facebook engagement rate. Microsoft Excel is renowned for its proficiency in data analysis and comparison, attributable to its intuitive interface, comprehensive analytical tools, and robust visualization features. Additionally, Excel’s automation features and its ability to import/export data from various sources enhance its efficiency and flexibility (Generales, 2019). Therefore, this study used Microsoft Excel as an analytical tool to compare Facebook page content, type of Facebook post, generating likes, shares, comments based on post type.
Improving the e-participation index score with social media is prudent strategy as numerous nations leverage these platforms to foster communication with their people. It’s imperative to ascertain the extent of citizen engagement with government social media beforehand, achieved through measurements to determine the engagement rate. Facebook’s 2011 EdgeRank algorithm consists of three parts: affinity, weight, and time decay. Affinity measures user interaction, weight assigns importance to post types, and time decay considers post recency (Ntalianis et al., 2013). Page moderators and brands should focus on these factors to boost engagement and brand recognition on social media. There are four methods by which a Facebook user can engage with a Facebook brand page: (1) posting content, opinions, or inquiries directly on the brand page, (2) liking moderator’s posts, (3) commenting on moderators’ posts, and (4) sharing moderators’ posts onto their own profile timeline. Therefore, this study focuses solely on these four methods of engagement to assess the overall online engagement of users for a specific brand page. A study to measure engagement was developed by Vadivu and Neelamalar in 2015 by formulating new to measure Facebook’s engagement (Vadivu & Neelamalar, 2015).
Engagement rate = (#likes+#comments+# shares)/(Post Reach) (1)
Vadivu and Neelamalar stated that the formula isn’t an ideal measure of engagement because it assigns equal importance to all engagement factors (likes, shares, and comments). Logically, the engagement level of a “like” cannot be equaled to that of a “comment’ or a “share”. According to him, Facebook ‘comments” are four times more valuable than ” likes”, so it is necessary to value different weights to all engagement factors. Thus, Azmi and Budi suggest a formula that assigns different weights to two types of engagement to calculate the engagement rate (Azmi & Budi, 2018). Comments, representing the highest level of engagement, are given a value of 2, while likes have a weighted value of 1. Combining these two types results in a total engagement value of 3, using the following formula.
Engagement Rate = ((Total Like ×1)+(Total comments ×2))/3 (2)
However, the measurement results using the above formula are still insufficient because the calculation only incorporates two variables (likes and comments) with weighted values, omitting the variables of posts and followers, which also impact the Engagement Rate. Additionally, the resulting Engagement Rate (ER) value lacks clarity regarding its lowest, highest, or ideal values. Based on the description above, Arman (2019) developed a new following formula to measure the engagement rate (Arman & Sidik, 2019). This formula is grounded in previous extensive studies and well-founded theories and accounts for the quality of engagement, aiming to provide more representative measurements for evaluating the engagement rate on Facebook. Additionally, to assess the quality of Facebook page engagement rate, Arman (2019) are divided into three levels, namely low engagement rate, good engagement rate and high engagement rate (Table 3). Therefore, for comparation of quality of Facebook engagement rate, this study used a formula (3) formulated by Arman (2019). By carrying out a comparative analysis, this study figured out the key differences and similarities in the implementation of Facebook page for sales purposes.
![]() (3)
(3)
Where:
Er = Engagement rate
L = like
C = Comment
n = Total posts
P = Probability for followers to see posts
F = Total followers
Following is an explanation of each variable contained in the formula based on literature studies as in Table 2 below.
Table 3: Formula variables based on literatures studies
| No. | Variable | Literature |
| 1 | likes (L) | According to Atmoko (2012) (15)[2], (Araujo et al., 2014) |
| 2 | comments (C) | |
| 3 | Weight Value (1 for likes, 2 for comments) | (Vadivu & Neelamalar, 2015), (Kim & Yang, 2017), (Version, 2024) |
| 4 | Weighting Value (3) | |
| 5 | Posts (n) | |
| 6 | Followers (F) | |
| 7 | Probability (P) | Twitter @ Instagram (2019) [18][3] |
| 8 | Indeks (100) | Supranto (1990) [19] [4] |
Table 4: Engagement Rate Value Range
| Number of followers | Average Engagement Rate | Range Engagement Rate | Quality of Engagement Rate |
| <5k | 7.58% | <7.58 | Low Engagement rate |
| 7.58 – 8.58 | Good Engagement rate | ||
| >8.58 | High Engagement rate | ||
| 5k – 20 k | 4.98% | <4.98 | Low Engagement rate |
| 4.98 – 5.98 | Good Engagement rate | ||
| >5.98 | High Engagement rate | ||
| 20k – 100 k | 2.65% | <2.65 | Low Engagement rate |
| 2.65 – 3.65 | Good Engagement rate | ||
| >3.65 | High Engagement rate | ||
| 100k – 300 k | 2.37 % | < 2.37 | Low Engagement rate |
| 2.37- 3.37 | Good Engagement rate | ||
| >3.37 | High Engagement rate | ||
| >300k | 1.72 % | <1.72 | Low Engagement rate |
| 1.72 – 2.72 | Good Engagement rate | ||
| >2.72 | High Engagement rate |
ANALYSIS AND FINDINGS
Comparation of Page Content between Chinese and Norwegian Company
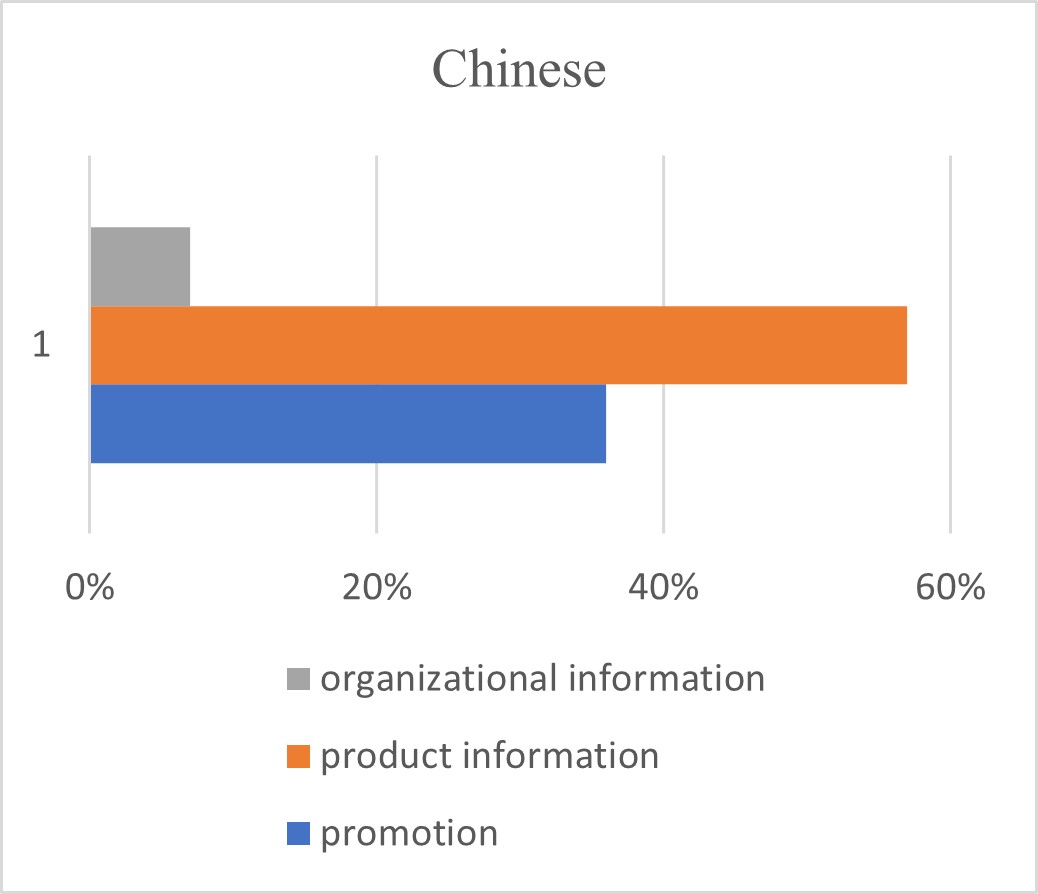
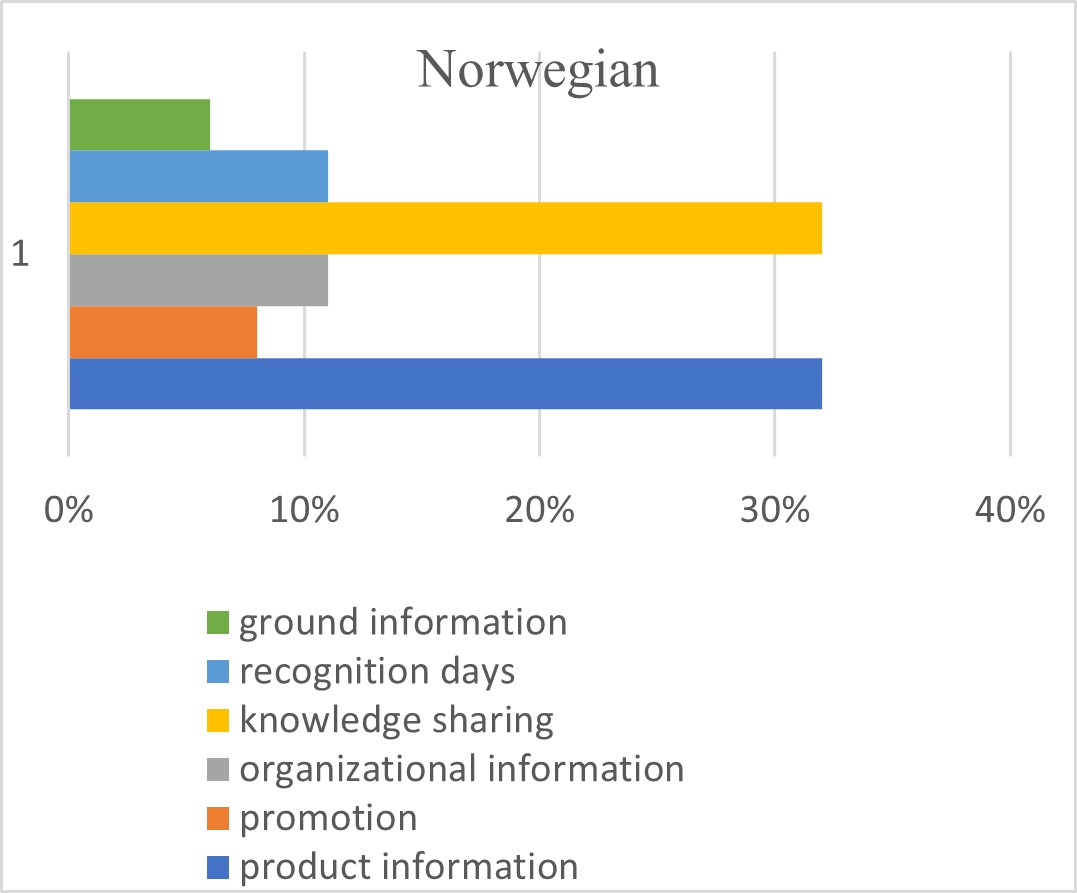
Figure 5: Percentage of Page Content between Chinese and Norwegian Companies
Figure 5 explains the comparison of page content between Known-You seed Co., Ltd. and Yara Myanmar. This study found that Chinese company created the post related with product information (57%), promotion information (36%) and organizational information (7%) on social media. On the other hands, Norwegian company sent the product information (32%), knowledge sharing (32%), recognition days (11%), organization information (11%), promotion information (8%), and ground information (6%) on Yara Myanmar’ official Facebook page. It can be observed that both companies in the study area preferred to share their product information in order to increase awareness, interest, and sales of their products. Moreover, this study demonstrates that Norwegian Facebook page places a strong emphasis on knowledge exchange in addition to product information to give farmers access to market pricing and sustainable farming practices.
Comparation of Content Type between Chinese and Norwegian Company
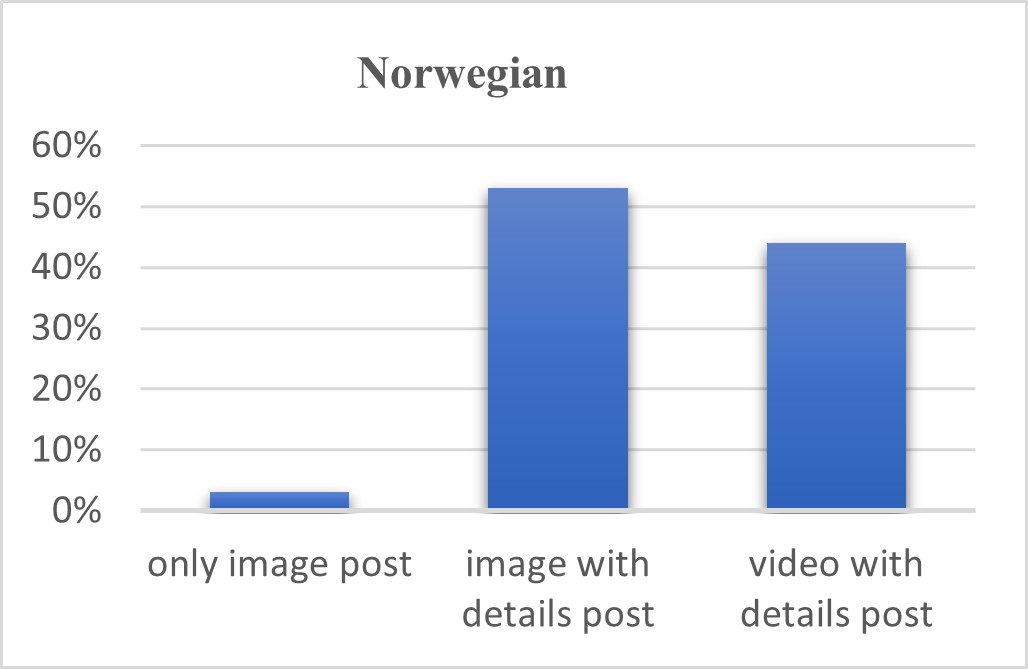
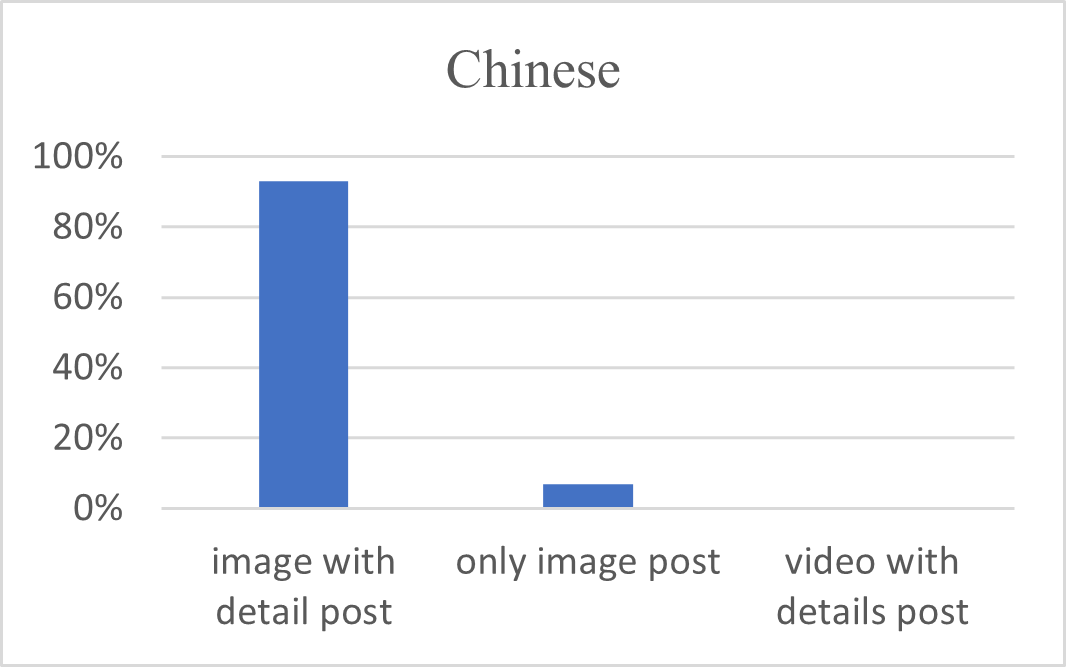
Figure 6: Comparation Percentage of types of post between Chinese and Norwegian Company
According the Facebook one-year data, the author found that the two foreign-based companies created three types of post on their Facebook, namely image with details post, only image post, and video with details posts. Figure 6 illustrates the comparison of percentage of types of Facebook post between Chinese and Norwegian Company in Myanmar. There are three types of post in Yara Myanmar Facebook page as the social media marketing including image with details post (53%), which was followed by video with details post (44%) and only image post (3%). On the other hands, Known-You Seed Co., Ltd. used the two main types of posts on their official Facebook page. As a result, 93% of image with detail post used as social media marketing for their seed. In addition, Known-You seed Co., Ltd. used 7% of only image post. The results show that both case study companies explored the image with details post to aware their brand.
Simultaneously, the author compared generating Likes, Shares, Comments based on types of post to show an effective user generated response between Chinese and Norwegian Company (see in figure 7). As a result of Norwegian Facebook page, an image with detailed post generated most of likes, shares, and comments among the types of post with the percentage of 83%, 79% and 81% respectively. A video with detailed post generated 16% of likes, 21% of shares, and 19% of comments. Additionally, only 1% of likes are generated by only image post in Norwegian Facebook page. Similarity, as an outcome of Chinese Facebook page, an image with detailed post showed most of likes, shares and comments among the post types with 95%, 98%, 99% respectively. Moreover, only image post generated 5% of likes, 2% of shares, and1% of comments.
Overall, an image with detailed post applied in both companies is the most effective content in in generating likes, comments and shares. (Rahman et al., 2016) also recommended that an image describing product feature and manuals is the most effective content in generating likes, comments and shares.
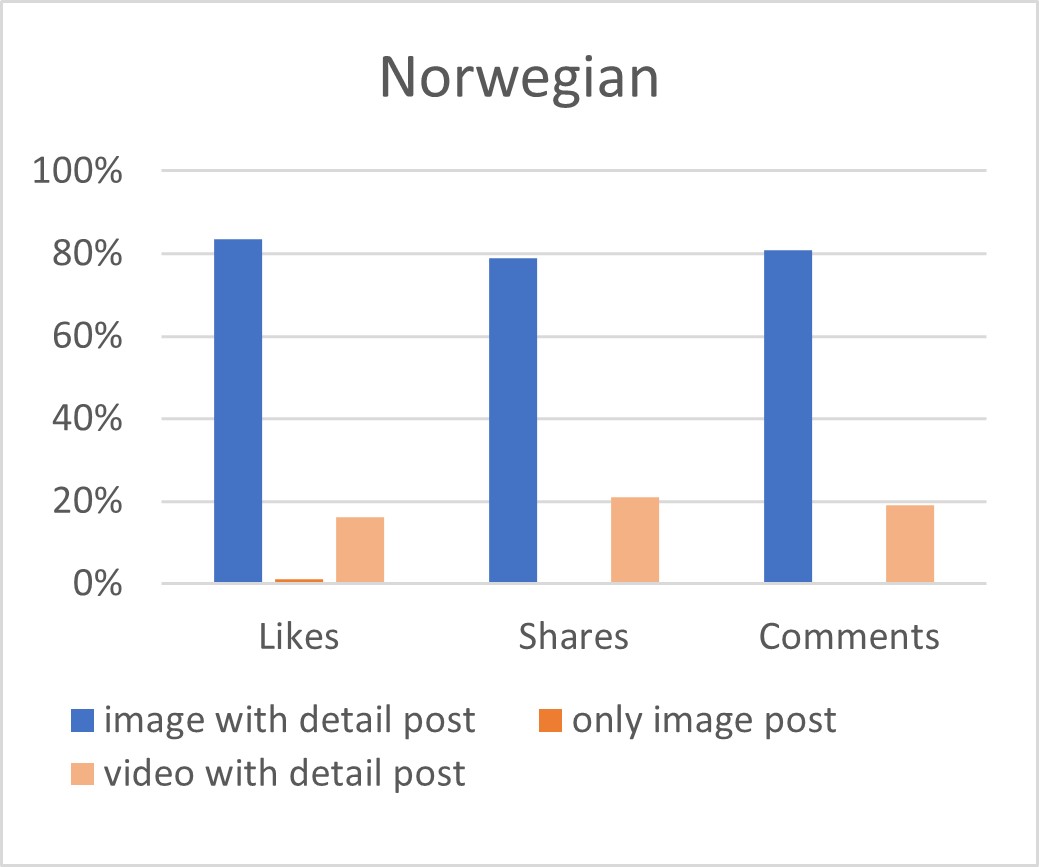
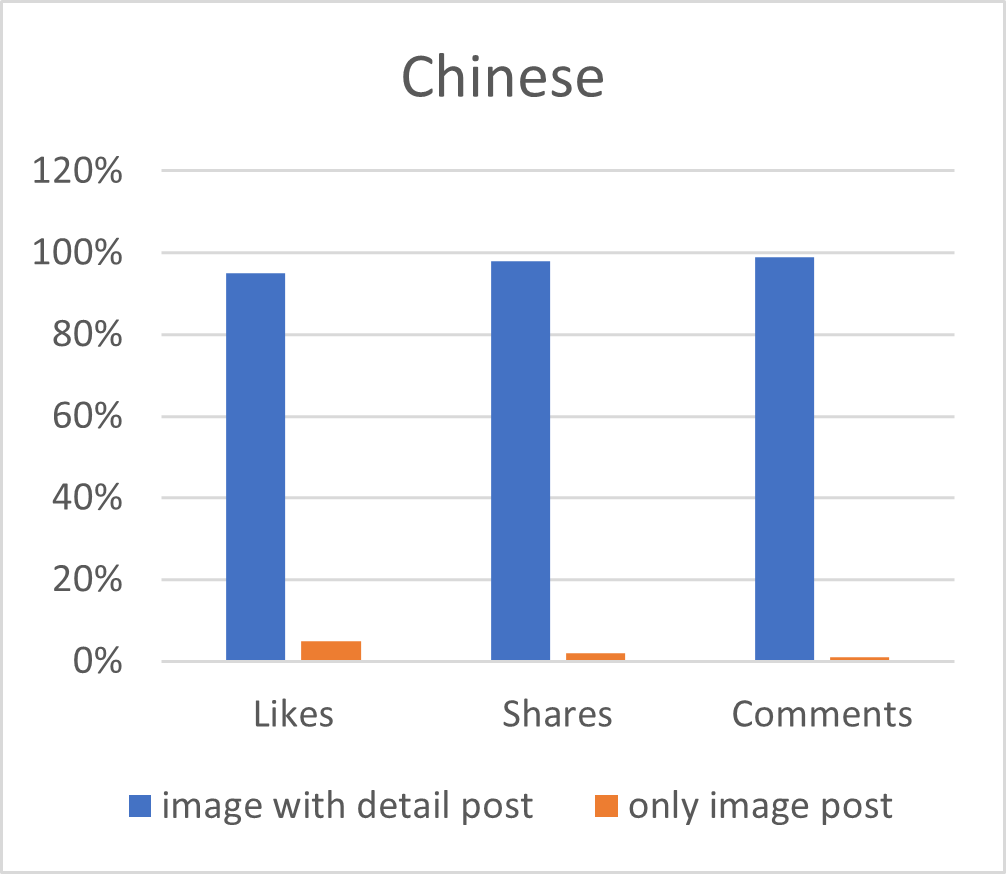
Figure 7: Comparation Percentage of generating Likes, Shares, Comments based on post types between Chinese and Norwegian Company
Comparation of Quality of Facebook Page Engagement Rate between Chinese and Norway Company
To compare the quality of Facebook Engagement Rate, data mining was conducted to summarize and track engagement activities on Facebook pages for a year, between 1 January – 31 December 2023.
![]()
Where:
Er = Engagement rate
L = like
C = Comment
n = Total posts
P = Probability for followers to see posts
F = Total followers
Norwegian company posts Yara Myanmar Facebook page period 1 January – 31 December 2023:
Post 1= Like: 208, Comment 7
Post 2= Like: 246, Comment 1
Post 3= Like: 184, Comment 4
Post 177= Like: 178, Comment 4
Followers = 418000
Er={[(L1+2C1)+(L2+2C2)+(L3+2C3)+⋯(L177+2C177)]/3nPF}*100
Er={[(208+2(7))+(246+2(1))+(184+2(4))+⋯(178+2(4))]/(3*177*0.1*418000)}*100
The above calculation implies adding all comments and likes for all posts by giving a weight of 1 for likes and 2 for comments, simplified as follows.
Er=(305563/22195800)*100
Er=1.37%
According to the engagement rate value range (table 4), the assessment of the quality of the engagement rate of Norwegian company with followers of 418000 is 1.37. According to this study, the Norwegian company’ page has a low engagement rate in the study area. Based on the findings of the research, the Facebook page has not been able to improve its followers’ potential to increase engagement more. Waqas, M., and Salleh, N.A. suggested that the brand content acts as a driver of consumer engagement with the products’ brand which finally leads to customers’ sense of effective community (Waqas et al., 2021).
Chinese company posts known-you seed Facebook page period 1 January – 31 December 2023:
Post 1= Like: 57, Comment 1
Post 2= Like: 42, Comment 10
Post 3= Like: 52, Comment 14
Post 14= Like: 42, Comment 0
Followers = 2800
Er={[(L1+2C1)+(L2+2C2)+(L3+2C3)+⋯(L177+2C177)]/3nPF}*100
Er={[(57+2(1))+(42+2(10))+(52+2(14))+⋯(42+2(0))]/(3*14*0.1*2800)}*100
The above calculation implies adding all comments and likes of all posts by giving a weight of 1 for likes and 2 for comments, simplified as follows.
Er=(1189/11760)*100
Er=10.11%
According to the engagement rate value range table 4, the assessment of the quality of the engagement rate of a Chinese company with followers of 2800 is 10.11. This study indicates that the Chinese company’ Facebook page had a high engagement rate during the study period than Norwegian company. It can be concluded that the Facebook page of the Chinese company performs excellently. This indicates that the Facebook page is well-liked by its followers, and has a significant impact on them, as evidenced by the high engagement rates. Because followers will engage with the page more frequently, a Facebook page with a higher engagement rate will also be of higher quality. The study conducted by Tan, W.B., & Lim, T.M. (2020) found that media and post content have an important, positive effect on customer engagement (Tan & Lim, 2020). Additionally, customers’ purchasing decisions will ultimately be influenced by their engagement and communication on the social media.
Comparation of Facebook Messaging Response between Chinese and Norwegian
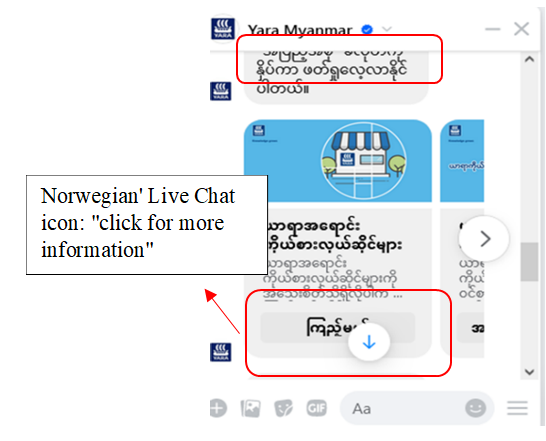
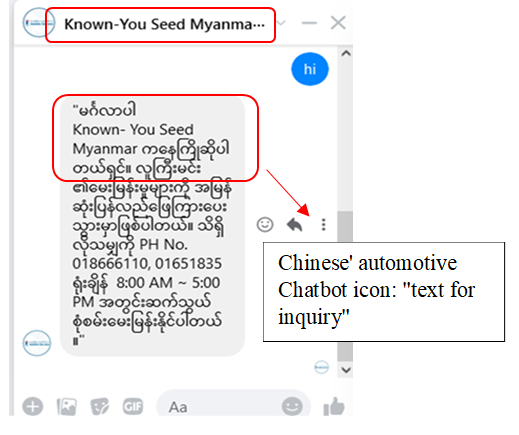
Figure 8: The message box of Norway company (Yara) Figure 9: The message box of China Company (Known- You Seed)
The author sent a message “Hi” to both companies to test their message response using Facebook messenger. Figure (10) indicates the conservation between customer and case study companies. As a result, both Chinese and Norwegian companies’ response immediately with automatic chatbot with introducing message, working hours and contact number. Moreover, the author found Chinese company used automotive chatbot to engage customer inquire and customer need to wait an admin online. Consequence, the Norwegian company also used automotive chatbot to introduce customer, besides, the author found that company embedded “Many Chat or Live Chat” as an intermediary platform in Facebook messenger with the aim of releasing prepared chat flow about products, agronomy service, nearest dealer address to increase customer service. The author examines how company’ use of Live Chat influences their online traffic conversion into sales by clicking the released chat flow (Figure 8). For example, “if you want to be dealer, click here for more details”, ” if you want to know more details information of products, click under the related products” “if you want to find nearest dealers’ shop and branch office, click here” “if you want to contact directly with admin, click here”. The author argues that Live Chat can increase online sales conversion by performing the functions of informing and persuading (Keller, 1987). As noted, live chat allows company to inform customers with timely and, thus, can decrease overall uncertainty and help customers better assess with their needs, which we defined as informing of live chat. Haoyan Sun suggested that live chat has a positive impact on conversion and that the strength of this positive effect depends on seller and product characteristics (Sun et al., 2021). Moreover, the author examine how admin enable real-time communication between customer inquiry sending with some questions to both companies’ messenger. The author found that Norwegian company replied the customer inquiry with their working hour, but Chinese company still not reply during the study. During the conversation, if the customer cannot quickly find answers to their questions, customers are likely to abandon their browsing and shopping carts (Rich et al., 2017). As contrast, this study found that Norwegian company’ conversation is more developing than Chinese company according to the following explanation.
The benefits of implementing chat flow on Facebook Messenger can be significant for businesses and organizations looking to enhance their customer engagement and streamline communication. Here are some key benefits:
Improved Customer Service: Chat flow on Facebook Messenger enables businesses to provide immediate responses to customer inquiries and support requests. Automated chatbots can handle common queries, freeing up human resources and reducing response times, leading to improved customer satisfaction(Harrington & Saloner, 2008).
Availability: Chat flow on Facebook Messenger allows businesses to provide round-the-clock support. Customers can reach out at any time, even outside of regular business hours, enhancing accessibility and convenience(Illescas-Manzano et al., 2021).
Personalized Interactions: Chatbots can be programmed to personalize interactions based on user data and preferences. By gathering information such as past purchases, browsing history, and demographics, businesses can tailor responses and recommendations to individual customers, creating a more personalized and engaging experience(Zumstein, 2020).
Increased Efficiency: Chat flow automation streamlines repetitive tasks and processes, such as answering frequently asked questions, collecting customer information, and processing orders (Nuruzzaman & Hussain, 2018). This improves operational efficiency and allows businesses to handle a higher volume of inquiries without increasing staffing levels.
Cost Savings: Businesses can reduce the need for human intervention and lower operational costs by automating routine customer service tasks (Huseynov, 2023). Chat flow on Facebook Messenger offers a cost-effective solution for handling customer inquiries and support requests compared to traditional call centers or email support.
Lead Generation and Conversion: Chatbots can proactively engage website visitors or Facebook users, initiating conversations and guiding them through the sales funnel (Ramaul, 2021).. By asking qualifying questions, providing product information, and offering assistance, chatbots can help generate leads and drive conversions, ultimately boosting sales and revenue.
Real-Time Insights: Chat flow analytics provide valuable insights into customer behavior, preferences, and pain points(Abbasi et al., 2018). Businesses can track metrics such as chat volume, response times, user interactions, and conversion rates, allowing them to identify trends, optimize chatbot performance, and make data-driven decisions to improve customer engagement.
Overall, implementing chat flow embedded in Facebook Messenger offers businesses a powerful tool for enhancing customer service, increasing efficiency, driving sales, and gaining valuable insights into customer behavior. By leveraging automation and personalized interactions, businesses can deliver seamless and engaging experiences that foster customer loyalty and satisfaction.
Moreover, the finding showed using automatic responses to provide crucial information regarding product ensures that potential customers are not overlooked, avoiding any response delays.
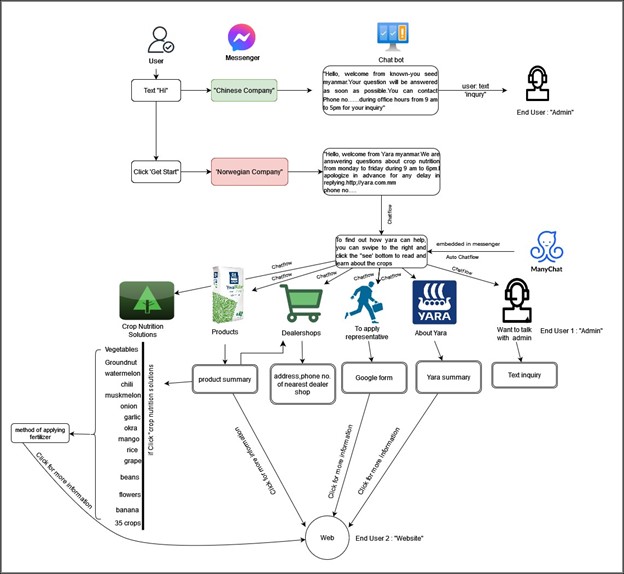
Figure 10: Comparison between Chinese and Norwegian’ conversations
DICUSSION AND CONCLUSION
Based on the comprehensive analysis conducted in this study, several key conclusions and discussion have emerged. Social networking managers can leverage our findings to strategically decide which content to publish in Facebook brand posts. New social networker will gain insights into the types of posts prevalent on agricultural Facebook pages and their corresponding posting frequencies. The study highlights the specific percentage of total viral actions generated by different types of posts, emphasizing that images paired with detailed posts are the most effective in driving likes, comments, and shares.
This research strongly recommends that Facebook page owners prioritize interactive content, particularly those featuring images, to maximize engagement metrics such as likes, comments, and shares. Given that shares carry significant weight in word-of mouth (WOM) marketing on Facebook, an image with details is crucial for enhancing this aspect of engagement.
Engagement Rate, a vital metric for Facebook optimization, provides insight into a page’s influence on its followers. Understanding and improving this rate is essential, as a higher engagement rate signifies superior performance and quality of the Facebook page. The study reveals that Chinese company exhibit higher engagement rates compared to Norwegian company.
Additionally, the research examined the nature of conversations between administrators and customers. Findings indicate that Norwegian company effectively maintain customer relationships through live chat automated responses. Live chat not only delivers timely information to customers, reducing uncertainty, but also helps in assessing customer needs, capturing potential purchasing behaviors and ultimately increasing sales.
In our analysis, we identified various types of posts published on Facebook pages, focusing on content data to evaluate their impact and engagement rates. Future research could delve deeper into examining customer behaviors through comments and message responses, providing a more detailed understanding of customer interactions.
ACKNOWLEDGEMENT
This research is funded and supported by Nanjing Agricultural University (NJAU), China. We would like to give our special thanks and gratitude to Nanjing Agricultural University for their financial, which enabled the publication of this paper.
BIBILOGYAPHY
- Abbasi, A., Zhou, Y., Deng, S., & Zhang, P. (2018). Text analytics to support sense-making in social media: A language-action perspective. MIS Quarterly: Management Information Systems, 42(2), 427–464. https://doi.org/10.25300/MISQ/2018/13239
- Adwan, A. Al, & Altrjman, G. (2024). The role of social media marketing and marketing management promoting and developing brand sustainability strategy. International Journal of Data and Network Science, 8(1), 439–452. https://doi.org/10.5267/j.ijdns.2023.9.011
- Andzulis, J., Panagopoulos, N. G., & Rapp, A. (2012). A review of social media and implications for the sales process. Journal of Personal Selling and Sales Management, 32(3), 305–316. https://doi.org/10.2753/PSS0885-3134320302
- Araujo, C. S., Correa, L. P. D., Silva, A. P. C. Da, Prates, R. O., & Meira, W. (2014). It is not just a picture: Revealing some user practices in instagram. Proceedings – 9th Latin American Web Congress, LA-WEB 2014, January 2016, 19–23. https://doi.org/10.1109/LAWeb.2014.12
- Arca, C. (2012). Social Media Marketing benefits for businesses Why and how should every business create and develop its Social Media Sites?
- Arman, A. A., & Sidik, A. P. (2019). Measurement of Engagement Rate in Instagram (Case Study: Instagram Indonesian Government Ministry and Institutions). Proceeding – 2019 International Conference on ICT for Smart Society: Innovation and Transformation Toward Smart Region, ICISS 2019, 1–6. https://doi.org/10.1109/ICISS48059.2019.8969826
- Azmi, A. F., & Budi, I. (2018). Exploring practices and engagement of Instagram by Indonesia Government Ministries. Proceedings of 2018 10th International Conference on Information Technology and Electrical Engineering: Smart Technology for Better Society, ICITEE 2018, 18–21. https://doi.org/10.1109/ICITEED.2018.8534799
- Balaji, M. S., Behl, A., Jain, K., Baabdullah, A. M., Giannakis, M., Shankar, A., & Dwivedi, Y. K. (2023). Effectiveness of B2B social media marketing: The effect of message source and message content on social media engagement. Industrial Marketing Management, 113(July), 243–257. https://doi.org/10.1016/j.indmarman.2023.06.011
- Bhattacharjee, S., & Raj, S. (2016). Social media: Shaping the future of agricultural extension and advisory services Internship Programme View project. GFRAS Interest Group on ICT4RAS, January 2019, 39. www.g-fras.org
- BİLGİN, Y. (2018). the Effect of Social Media Marketing Activities on Brand Awareness, Brand Image and Brand Loyalty. Business & Management Studies: An International Journal, 6(1), 128–148. https://doi.org/10.15295/bmij.v6i1.229
- Brown, E. (2010). How implementing social media strategies (the right way) attracts customer loyalty. April, 1–39. https://images.template.net/wp-content/uploads/2016/03/02131757/How-Implementing-Social-Media-Strategies.pdf
- Shree Bhagwat, D. S. B. (2013). Development of Social Networking Sites and Their Role in Business with Special Reference to Facebook. IOSR Journal of Business and Management, 6(5), 15–28. https://doi.org/10.9790/487x-0651528
- Dubbelink, S. I., Soria, C. H., & Constantinides, E. (2021). Social media marketing as a branding strategy in extraordinary times: Lessons from the covid‐19 pandemic. Sustainability (Switzerland), 13(18). https://doi.org/10.3390/su131810310
- Dwivedi, Y. K., Ismagilova, E., Hughes, D. L., Carlson, J., Filieri, R., Jacobson, J., Jain, V., Karjaluoto, H., Kefi, H., Krishen, A. S., Kumar, V., Rahman, M. M., Raman, R., Rauschnabel, P. A., Rowley, J., Salo, J., Tran, G. A., & Wang, Y. (2021). Setting the future of digital and social media marketing research: Perspectives and research propositions. International Journal of Information Management, 59. https://doi.org/10.1016/j.ijinfomgt.2020.102168
- Dwivedi, Y. K., Ismagilova, E., Rana, N. P., & Raman, R. (2023). Social Media Adoption, Usage And Impact In Business-To-Business (B2B) Context: A State-Of-The-Art Literature Review. Information Systems Frontiers, 25(3), 971–993. https://doi.org/10.1007/s10796-021-10106-y
- Etikan, I. (2016). Comparison of Convenience Sampling and Purposive Sampling. American Journal of Theoretical and Applied Statistics, 5(1), 1. https://doi.org/10.11648/j.ajtas.20160501.11
- FAO. (2005). Myanmar Agricultural Sector Review Investment Strategy Volume 1 – Sector Review. 1.
- Food, A., Franchise, R., & Entering, B. (2019). Challenges for Australian Food Retail Franchise Brands Entering China Challenges for Australian Food Retail Franchise Brands Entering China.
- Generales, D. (2019). Microsoft Excel 2019 Nivel.
- Harrington, S., & Saloner, G. (2008). Ashesi University. 1–3.
- Harvey, K. (2014). Social Media, Definition and Classes of. Encyclopedia of Social Media and Politics, January 2014. https://doi.org/10.4135/9781452244723.n485
- Hervé, A., Schmitt, C., & Baldegger, R. (2020). Internationalization and Digitalization: Applying digital technologies to the internationalization process of small andmedium-sized enterprises. Technology Innovation Management Review, 10(7), 28–40. https://doi.org/10.22215/timreview/1373
- Htut, K. P., Lall, M., & Howson, C. K. (2022). Caught between COVID-19, Coup and Conflict—What Future for Myanmar Higher Education Reforms? Education Sciences, 12(2). https://doi.org/10.3390/educsci12020067
- Hurmelinna-Laukkanen, P., Haapanen, L., & Holma, S. (2020). Social Media and Small Entrepreneurial Firms’ Internationalization. 141–168. https://doi.org/10.1007/978-3-030-43453-3_8
- Huseynov, F. (2023). Chatbots in digital marketing: Enhanced customer experience and reduced customer service costs Farid Huseynov. Contemporary Approaches of Digital Marketing and the Role of Machine Intelligence, 46–72. https://doi.org/10.4018/978-1-6684-7735-9.ch003
- Illescas-Manzano, M. D., López, N. V., González, N. A., & Rodríguez, C. C. (2021). Implementation of chatbot in online commerce, and open innovation. Journal of Open Innovation: Technology, Market, and Complexity, 7(2), 125. https://doi.org/10.3390/joitmc7020125
- Ivanova, A., & Wang, Y. (2014). Social Media Strategy in the Chinese Market – Weibo Platform Case Study.
- Jones, N., Borgman, R., & Ulusoy, E. (2015). Impact of social media on small businesses. Journal of Small Business and Enterprise Development, 22(4), 611–632. https://doi.org/10.1108/JSBED-09-2013-0133
- Kaplan, A. M., & Haenlein, M. (2010). Users of the world, unite! The challenges and opportunities of Social Media. Business Horizons, 53(1), 59–68. https://doi.org/10.1016/j.bushor.2009.09.003
- Keller, K. L. (1987). Memory Factors in Advertising: The Effect of Advertising Retrieval Cues on Brand Evaluations. Journal of Consumer Research, 14(3), 316. https://doi.org/10.1086/209116
- Kim, C., & Yang, S. U. (2017). Like, comment, and share on Facebook: How each behavior differs from the other. Public Relations Review, 43(2), 441–449. https://doi.org/10.1016/j.pubrev.2017.02.006
- Kirtiş, A. K., & Karahan, F. (2011). To Be or not to Be in social media arena as the most cost-efficient marketing strategy after the global recession. Procedia – Social and Behavioral Sciences, 24, 260–268. https://doi.org/10.1016/j.sbspro.2011.09.083
- Meiners, N. H., Schwarting, U., & Seeberger, B. (2010). The Renaissance of Word-of-Mouth Marketing: A “New” Standard in Twenty-First Century Marketing Management?! International Journal of Economic Sciences and Applied Research, 3(2), 79–97.
- Momen, M. A., Shahriar, S. H. Bin, Hassan, M. K., & Sultana, S. (2020). Determinants of Using Social Networking Sites Toward Entrepreneurial Success: Experience from a Developing Nation. Emerging Economy Studies, 6(2), 191–200. https://doi.org/10.1177/2394901520977425
- Ntalianis, K., Doulamis, A., Doulamis, N., & Tsapatsoulis, N. (2013). VIDEO ABSTRACTION IN SOCIAL MEDIA : AUGMENTING FACEBOOK ’ S EDGERANK ALGORITHM IN VIDEO CONTENT PRESENTATION Technological Educational Institute of Athens , Department of Marketing – Online Computing Group Technical University of Crete , Department of Pro. 2684–2688.
- Nuruzzaman, M., & Hussain, O. K. (2018). A Survey on Chatbot Implementation in Customer Service Industry through Deep Neural Networks. Proceedings – 2018 IEEE 15th International Conference on e-Business Engineering, ICEBE 2018, 54–61. https://doi.org/10.1109/ICEBE.2018.00019
- Olanrewaju, A. S. T., Whiteside, N., Hossain, M. A., & Mercieca, P. (2018). The influence of social media on entrepreneur motivation and marketing strategies in a developing country. Lecture Notes in Computer Science (Including Subseries Lecture Notes in Artificial Intelligence and Lecture Notes in Bioinformatics), 11195 LNCS, 355–364. https://doi.org/10.1007/978-3-030-02131-3_32
- Pereira, H. G., de Fátima Salgueiro, M., & Mateus, I. (2014). Say yes to Facebook and get your customers involved! Relationships in a world of social networks. Business Horizons, 57(6), 695–702. https://doi.org/10.1016/j.bushor.2014.07.001
- Rahman, Z., Suberamanian, K., Zanuddin, H., Moghavvemi, S., & Md Nasir, M. H. N. (2016). Social media engagement metrics analysis – “Study on fan page content.” Journal of Telecommunication, Electronic and Computer Engineering, 8(8), 71–76.
- Ramaul, L. (2021). Role of AI in marketing through CRM integration with specific reference to chatbots. 63. https://jyx.jyu.fi/handle/123456789/76485
- Rich, L., Lux, V. J., & Rich, L. (2017). ScholarWorks @ BGSU Reaching Additional Users with Proactive Chat By.
- Ridout, B., Mckay, M., Amon, K., Campbell, A., Wiskin, A. J., Seng Du, P. M. L., Mar, T., & Nilsen, A. (2020). Social Media Use by Young People Living in Conflict-Affected Regions of Myanmar. Cyberpsychology, Behavior, and Social Networking, 23(12), 876–888. https://doi.org/10.1089/cyber.2020.0131
- Sun, H., Chen, J., & Fan, M. (2021). Effect of Live Chat on Traffic-to-Sales Conversion: Evidence from an Online Marketplace. Production and Operations Management, 30(5), 1201–1219. https://doi.org/10.1111/poms.13320
- Tan, W. B., & Lim, T. M. (2020). A Critical Review on Engagement Rate and Pattern on Social Media Sites. 58–61. https://doi.org/10.56453/icdxa.2020.1002
- This, A. (n.d.). Concepción Varela-Neira Fac . CC . Económicas e Empresariais Universidade de Santiago de Compostela Avda . do Burgo , s / n , 15782 Santiago de Compostela , Spain Email : conchi.varela@usc.es ( Corresponding Author ) a Emerging Markets Research Centre ( E.
- Tsimonis, G., & Dimitriadis, S. (2014). Brand strategies in social media. Marketing Intelligence and Planning, 32(3), 328–344. https://doi.org/10.1108/MIP-04-2013-0056
- Vadivu, V. M., & Neelamalar, M. (2015). Digital brand management – A study on the factors affecting customers’ engagement in Facebook pages. 2015 International Conference on Smart Technologies and Management for Computing, Communication, Controls, Energy and Materials, ICSTM 2015 – Proceedings, May, 71–75. https://doi.org/10.1109/ICSTM.2015.7225392
- Version, P. (2024). Alma Mater Studiorum Università di Bologna Archivio istituzionale della ricerca Mariani , M . M ., Mura , M . and Di Felice , M . ( 2018 ) The determinants of Facebook social engagement f or National Tourism Organisations ’ Facebook pages : a at : Rights . April.
- Vestbro, D. U., & Wilkinson, N. (2011). R esearch R esearch. Global Journal of Business Research, 5(2), 27–40.
- Wang, Y., Hong, A., Li, X., & Gao, J. (2020). Marketing innovations during a global crisis: A study of China firms’ response to COVID-19. Journal of Business Research, 116, 214–220. https://doi.org/10.1016/j.jbusres.2020.05.029
- Waqas, M., Hamzah, Z. L., & Mohd Salleh, N. A. (2021). Customer experience with the branded content: a social media perspective. Online Information Review, 45(5), 964–982. https://doi.org/10.1108/OIR-10-2019-0333
- Zumstein, D. (2020). Chatbots – An Interactive Technology for Personalized Communication , CHATBOTS – AN INTERACTIVE TECHNOLOGY FOR PERSONALIZED COMMUNICATION ,. IADIS International Journal on WWW/Internet, 15(February 2018), 96–109.
FOOTNOTES
[1] https://datareportal.com/reports/digital-2023-myanmar
[2] Atmoko Dwi, Bambang. 2012. Instagram Handbook Tips Fotografi Ponsel. Jakarta: Media Kita.
[3] Instagram Tweet. @instagram. 2019. https://twitter.com/instagram/status/ 1087853297036275712, accessed on 10 May 2019.
[4] Supranto, J. 1990. “Statistik : Teori dan Aplikasi Jilid 2”. Jakarta:Erlangga.