Comparative Evaluation of US HCM & Malaysian HCM for a Multilane Highway
- Muhammad Akram Adnan
- Norliana Sulaiman
- Tuan Badrol Hisham Tuan Besar
- 134-151
- Nov 28, 2023
- Transport Management
Comparative Evaluation of US HCM & Malaysian HCM for a Multilane Highway
Muhammad Akram Adnan1 ,Norliana Sulaiman1 , Tuan Badrol Hisham Tuan Besar2
1School of Civil Engineering, Universiti Teknologi MARA, Sha, Alam, Selangor Malaysia
2Faculty of Business Management, UiTM Cawangan Selangor, Puncak Alam, Selangor Malaysia
DOI: https://dx.doi.org/10.47772/IJRISS.2023.7011010
Received: 12 October 2023; Revised: 24 October 2023; Accepted: 27 October 2023; Published: 28 November 2023
ABSTRACT
This study aims to measure the effectiveness of guidelines between US Highway Capacity Manual 2010 and Malaysian Highway Capacity Manual 2011 to evaluate the performance of multilane highway. The study was conducted based on field work by using Trax Appolyon Traffic Counter from 6 October 2016 to 10 October 2016 and the data were collected on four lanes – dual carriageways at Persiaran Mokhtar Dahari (B49) Puncak Perdana, Shah Alam. The field data were collected by considering one-way direction flow toward to Kuala Lumpur. The evaluation of performance measure for the multilane is based on the density obtained from both manual and compared with the empirical data. To measures the accuracy and effectiveness between US HCM 2010 and HCM 2011 Malaysia, the error distribution analysis on the traffic density values are evaluated by using Mean Squared Error (MSE) and Mean Absolute Error (MAE). The results show that MHCM 2011 more accurate to measure the density and evaluate the performance of the road compared to US HCM 2010.
Keywords: MHCM 2011, HCM 2010, Multilane Highway, Density.
INTRODUCTION
The rapid development of Malaysia increases the traffic demand volume in society. It influences the travel pattern of the community from their origin to any destination. Transportation system is also affected by the development by the increase in the number of vehicles on roads. At year 2015, the new registrations of motor vehicles in Malaysia has reach 26,301,952 vehicles which is 6.6% increase over the previous year. (Road traffic Volume Malaysia, 2014). [11]
The number of vehicles keep continue increasing over the past 10 years as shown in Table 1.1 (RTVM, 2014). The increasing of traffic demand volume has cause the traffic congestion especially during peak hour which mostly influenced the road network performance including multilane highway.
According to the Highway Capacity Manual (HCM) 2010, multilane highway is a road with a total of four or six lanes, including both directions. It covers speed limits of 40 to 55 mi/h or of 60 to 90 km/h and often with medians or two-way left-turn lanes (TWLTL). Typically, they are located in suburban communities to leading to central cities, or along high-volume rural corridors connecting two cities or two significant activities that generate a substantial number of daily trips. Multilane highway often has traffic signals but traffic signals spaced at 2.0 mi or less typically create urban street conditions and the traffic volumes on multilane highways vary but might range from 15,000 to 40,000 veh/day. [16]
Highway and traffic design in Malaysia for instant is using Malaysian Highway Capacity Manual 2011 (MHCM) where it is actually an improvised version of Highway Capacity Manual (HCM) developed by Transportation Research Board of United States (US). As to compare, the elements used in design and analysis for MHCM is appear to be taken directly from HCM with some adjustments to adapt with local environment and requirements. [6]
This paper deliberates the comparison of analysis of multilane dual carriageway highway and two-lane single carriageway highway upon empirical data compared to MHCM 2011 and HCM 2010. The main idea is basically to validate the reliability of both manuals in Malaysian road design and analysis.
Objectives of the Study
The objectives of this study are:
- To evaluate the performance (LOS) of a multilane highway based on MHCM 2011 and HCM 2010.
- To compare the results obtained using US HCM 2010 and MHCM 2011 by statistical analysis, paired t-test, MAE and MSE.
Problem of Statement
Currently, Malaysian Highway Capacity Manual 2011 has become the reference to design and evaluate the operational performance for various types of facilities including multilane highway. Basically the MHCM 2011, which is based on the method adopted from U.S. Highway Capacity Manual (HCM 2010). However, MHCM 2011 already incorporates the usage of the passenger car equivalent (pce) and adjustment factors that were calibrated based on Malaysian traffic conditions in determining of road capacity. These parameters have been derived according to local traffic observation which carried out throughout the study for the development of the manual. The consideration of the local traffic condition into the performance analysis will ensures a realistic understanding of vehicles in the multilane highway. However, it raised the doubt on the reliability to be directly implemented in Malaysian road design and analysis since the limitation of MHCM 2011 is to measure the performance of facilities only for rural and suburban highway.
Scope of The Study
In this study, the traffic data of four lanes-dual carriageways for multilane highway has been carried out at state road (B49) Persiaran Mokhtar Dahari, Puncak Perdana Shah Alam. The geometric properties for the multilane highway (lane width, shoulder, median, etc) as well as other related road features including access were observed. The traffic data was collected continuously for 5 days. Both lanes for one direction of traffic flow towards Kuala Lumpur were observed for the data collection using Trax Apollyon Traffic Recorder. However, for the data analysis purposed, only lane 2 (inner lane) considered for the worst case scenario. Due to the highest traffic volume recorded, data on day 2 (7 October 2016) has been selected to be used in analysis. It was found that the peak hour volume between 9 am to 12 noon. Using this data, the section of multilane highway was analysed using HCM 2011 (Malaysia), HCM 2010 (US) and then compared with empirical data. The findings from this study will be reliable to be used at other locations which have the same characteristics with this location.
Hypothesis of The Study
The MHCM 2011 is more effectively in evaluate the performance of Malaysian road compared to US HCM 2010.
LITERATURE REVIEW
Concept Of Traffic Density And Capacity
It is imperative that traffic density should be assessed in relation to road users as well as planner’s perspective. Early on 1960, the density was estimated using the traditional aerial photographic technique. Thereafter, density was estimated using different techniques by different researchers all around the world. Khanna et al. (1976) used fundamental traffic –flow relation to estimate density on one-way traffic road. Kumar (1994) observed total number of vehicles on a road stretch for every one-minute interval by deploying four persons on each end of road stretch which included time of entry, registration number and vehicle length simultaneously. Tiwari et al. (2008) showed that the continuity equation involving traffic flow expressing the relationship between density, flow, and speed can be made valid under non homogenous traffic condition by introducing certain adjustments in the equation. [1][8] [14]
The speed-flow characteristics on different types of multi-lane highways in India as well as capacity estimation had been studied based on traditional and microscopic simulation models by Manraj Singh et al. (2012). Another study was conducted in India by Arasan and Arkatkar (2011) to investigate the effect of variation of traffic composition, road width, magnitude of upgrade and its length on highways capacity. It was found that highway capacity significantly effects and changes with change in traffic volume composition, width of roadway, magnitude of upgrade, and its length. [9][2]
Level of Service (LOS)
According to U.S HCM 2000, level of service is defined as a qualitative description of operating conditions within a traffic stream based on service measure including travel flow, travel speed, freedom to maneuverer safely, driver comfort and convenience. Level of service are designated “A” through “F” from the best to worst, covering the entire range of traffic operating condition.
James Oliver Ensley is studied on Application of Highway Capacity Manual 2010 on the Methodologies for Planning Deficiency Analysis of Level-of-Service said that a multilane highway is in the most ways similar to the basic freeway segment. LOS can be evaluating after obtaining the road density by determining of speed and flowrate. [7]
The level of service (LOS) is used as a quantitative measure to describe the operational conditions in the traffic stream and their perception by drivers and passengers. It is also linked with operational parameters, which expresses the operating quality for the signalized intersection in certain grades (Tracz and Bohatkiewicz, 1994).
A study has been carried out by Semeida (2013) in Egypt to investigate the relationship between road factors and the operating speed at multilane highways. From the study, it was found that the most significant variables that affecting on operating speed are lane width, followed by median width and the existence of access along road section. Furthermore, it is also found that the posted speed limit has a very small effect on the operating speed. Another study conducted by Semeida (2013a) has been investigated the impact of road geometric characteristics and heavy vehicles on level-of-service and capacity in rural multi-lane highways in Egypt. Semeida found that the most influential variables were heavy vehicles, lane width, and existence of access which nearly similar to the previous study. [12] [13]
Another study carried by Hamdy Faheem and Ibrahim Hassan Hashim (2014), an analysis into traffic characteristics on rural multilane highways. The empirical data that obtained from study sites on Cairo-Aswan agriculture four-lane divided highway were used in the study. There are four analyses that have been presented in the study. The first analysis investigates the impact of lane position Shoulder Lane on Average Travel Speed (ATS). The second analysis was about the relationship between ATS and different traffic characteristics. The third analysis examines the impact of lane position on traffic stream relationships. The fourth and last analysis inspects the impact of lane position and traffic level on headway characteristics. It was found that the lane position and traffic level have a considerable impact on ATS traffic stream relationships and headway characteristics.
Hamid A. Awad and Hameed A. Mohammed (2013) has been conducted a study to analyses and evaluate the level of service (LOS) on section for multilane highway in Ramadi city. The study stated that the LOS multilane highway is based on density, which is calculated by dividing per lane flow by speed. The traffic data and geometric propertied has been collected through field surveys on the section for the multilane highway. The traffic volume data was collected manually and classified by vehicles types during each 15-minute interval. The Highway Capacity Software 2000 (HCS 2000) program is used in this study for analysis process to determine the level of service. From the study, it has concluded that the level of service on selected section for east bound is (A), and for west bound is (B). [5]
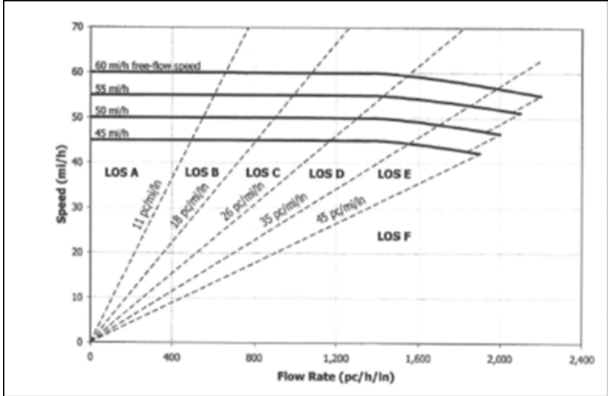
In MHCM 2011, LOS for a multilane highway can also be determined directly based on the density. HCM uses density in term of passenger cars per kilometre per lane as main parameter to measure (LOS) of multi-lane highways and also use Space Mean Speed (SMS) as the primary capacity measure for the same type of highways. In addition, for HCM 2010 and MHCM 2011 have similarity in estimation of density of the traffic stream for multi-lane highway. The density can be determined by using Equation 1. Figure 1 shows the criteria of LOS for multilane highway. [6] [16]
D = vp / S (1) Where vp is the demand flow rate and S is the space mean speed.
Figure 1: Multilane Highway Speed-Flow Curve (James, 2012)
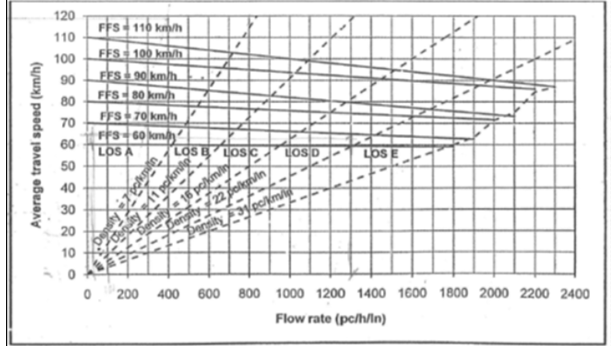
According to MHCM 2011, the criteria of level of service for multilane highway are based on the values of free flow speed and flow rate for each individual lane. The capacity values determined in the MHCM 2011 were adopted with slightly modifications from the values used in U.S HCM 2010. LOS for a multilane highway can also be determined directly from Figure 2.
Figure 2: LOS for Multilane Highway, source: MHCM 2011
The Several researches have been carried out to analyze the effect of road geometry and traffic composition on LOS and Capacity in evaluate the performance of multilane highway. Kerner (2004) confirmed that the determination of capacity and LOS for any highway is one of the most important applications of any traffic theory. Some previous theories and empirical researches (C.J. Hoban, 1987; M. Iwasaki, 1991; A.T. Ibrahim & F.L. Hall, 1994; V. Shankar & F. Mannering, 1998) focused on the interrelationships among the influence of capacity, traffic features, and geometric elements on uninterrupted multi-lane highways. Yang and Zhang (2005) have established based on their extensive field survey of traffic flow on multi-lane highways in Beijing and subsequent empirical model development that the average roadway capacity per hour per lane on four-lane, six-lane and eight-lane divided carriageways. [3][4] [17]
The Accuracy Of The US HCM 2010 And MHCM 2011 Method
Both MSE and MAE models are often applied in model evaluation studies. Adnan M.A (2005) suggested that MSE was not a good indicator when comparing with the MAE model as it appeared to be erroneous due to the existence of average error, hence, MAE would be a better indicator. The MSE model is more appropriate when representing data performance whilst MAE is used to predict error distribution. However, T. Chai, R.R Draxler (2014) found that estimating MAE and MSE to present their model evaluation statically are more beneficial.[15]
The equation adopted are as follows; –
According to N.A. Weiss (1997) upon calculating the error by using the equations (a) and (b), the model is considered good when getting small value as it proved the models can estimate good results. [10]
METHODOLOGY
Study Flowchart
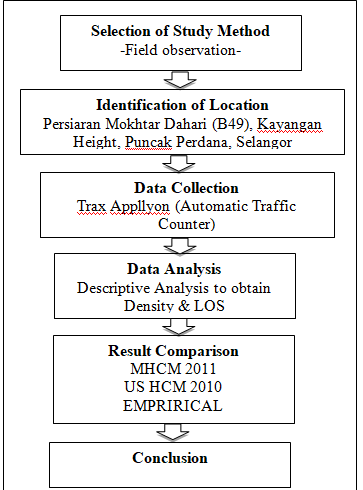
The Figure 3 shows the study flowchart during the observation, selection and analysis process.
Figure 3: Flowchart of Methodology
Description Of Site
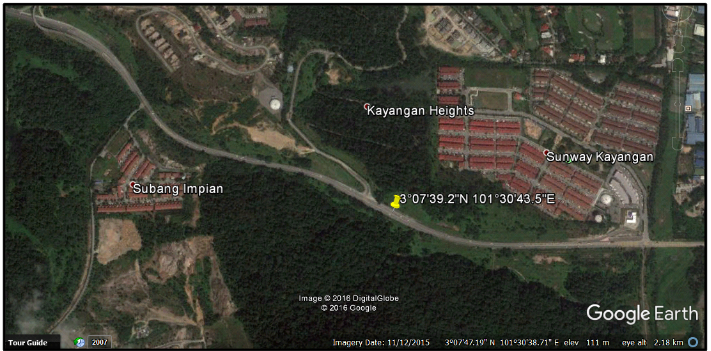
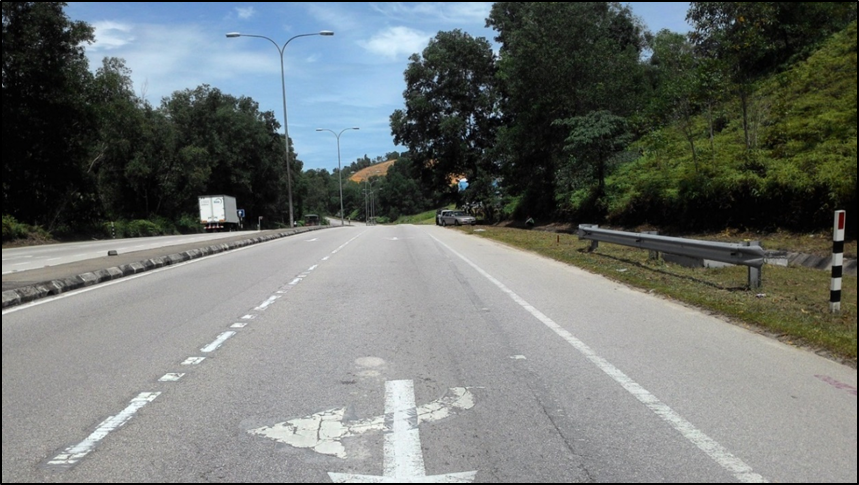
The selected site for this study is four lanes dual carriageway which located at State road (B49) – Persiaran Mokhtar Dahari (Puncak perdana). The AADT that obtained from the field observation is about 11603 vehicles per day. The proposed site of multilane highway, B49 (Puncak Perdana-Kayangan Height) as shown on Figure 4 and Figure 5.
Figure 4: Location of Site
Figure 5: View of Road Cross Section
The road is divided with physical median approximately 1.8 m and the road width measured is 3.20 m with 2.0 m paved shoulder. The multilane highway is classified as R5 standard with operating speed of 80 km/hr and has partial access controlled. There are three numbers of access points have been considered that connected to the main road as shown in Figure 3.4. The length of the road is estimated approximately 1.46km.
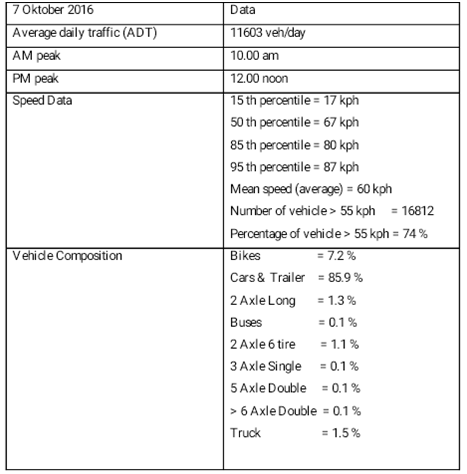
Table 1 are shows the specific details of site obtained from the report that produced by Trax Appolyon Traffic Counter. Detailed statistics from the report includes directional and hourly traffic counts, Average Daily Traffic Counts (ADT) and A.M and P.M peak volume reports.
Table 1 Detailed Statistics of Site Data
Field instrumentation
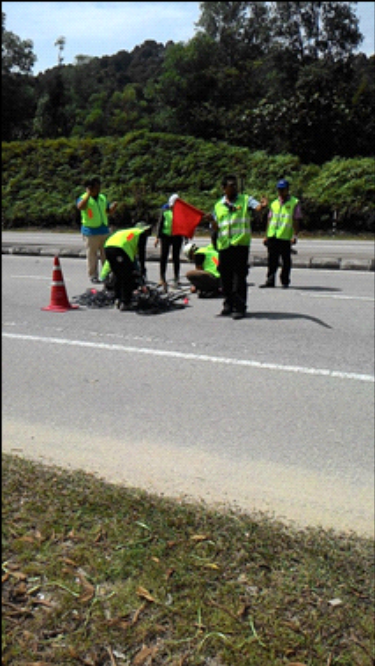
Traffic management was important during the installation of road tube on the road surface to ensure the safety of the observer and optimize work zone traffic operation. In order to relieve delays and disruption of traffic flow during the installation process, the traffic management have been done and supervised by JKR Petaling team. The first approach is to diverge the traffic from lane 2 to lane 1 and then install the road tube at lane 2. The process continues until the road tube fully installed. The traffic flows are separated by using physical traffic barrier and advance warning was installed before the site to inform the motorist before entering the work zone.
Figure 7: Traffic management during field work
Figure 8: The traffic flow between lane are separated by cone
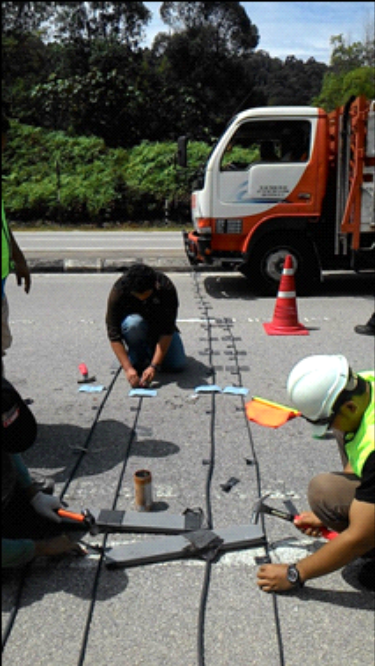
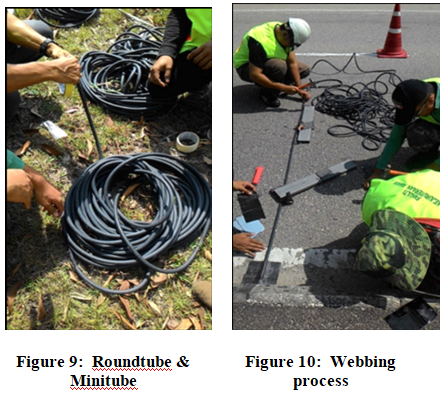
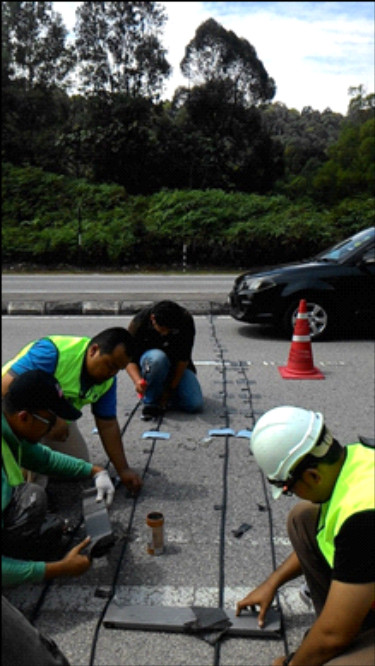
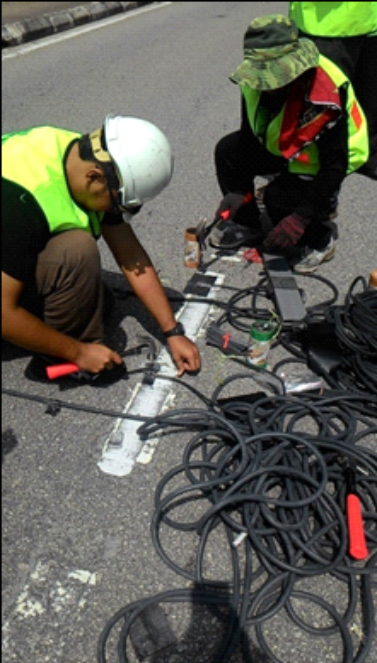
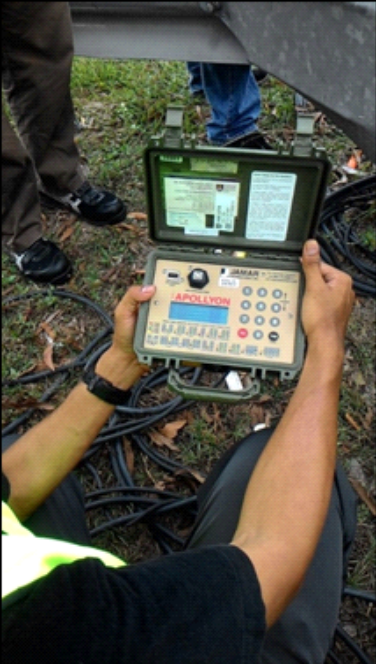
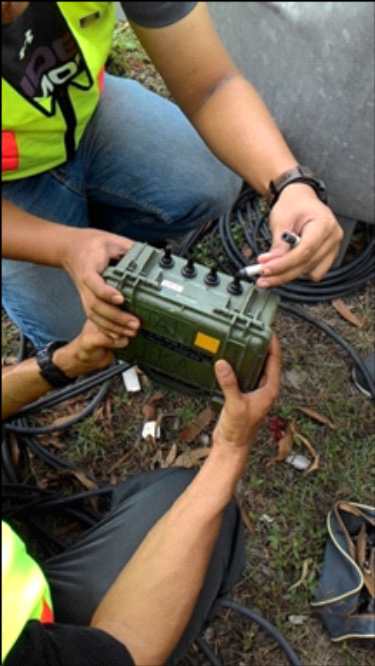
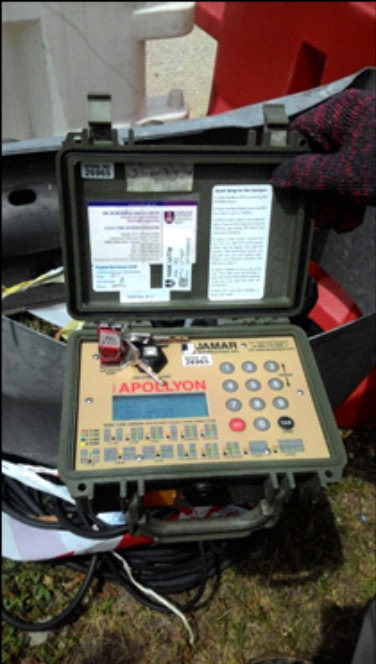
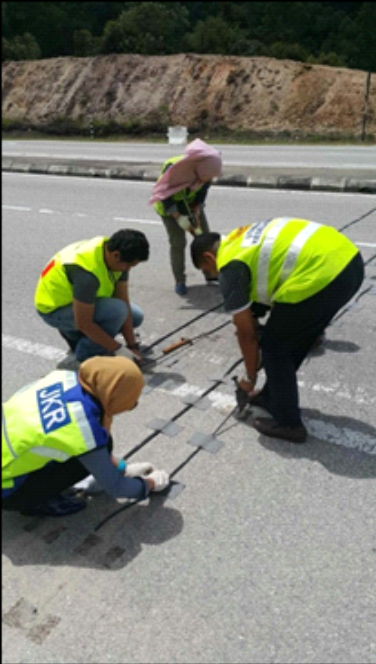
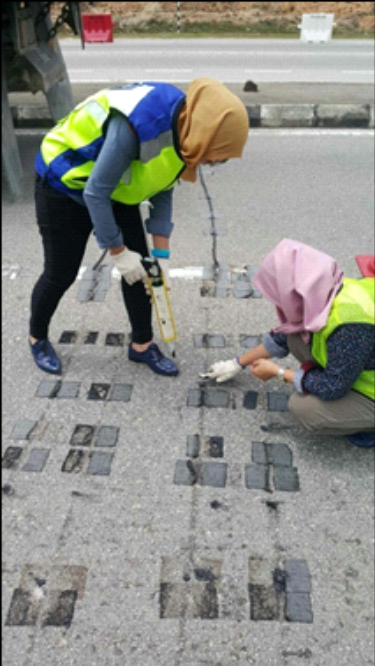
The data was collected by using Trax Apollyon Automatic Traffic Counter and the procedures to obtain the traffic data as shown in Figures 9 to Figure 17.
Figure 11: Laid out of tube
Figure 12: Spiked down of each tube (through the C‐clamps)
Figure 13: Trax Appolyon Traffic Counter
Figure 14: Setting up the traffic counter
Figure 15: Downloading data from Trax Appolyn Traffic Counter
Figure 16: During the uninstallation of road tube
Figure 17: Sealing process
Collection Of Data
The Trax Apollyon automatic traffic counter is installed for 5 days with consideration on peak hour. The data collected each of vehicle data, including the vehicle class, arrival time, gap, speed, and vehicle length. The vehicle classifications are listed Appendix A4. Data were collected from one directions traffic flow but the analysis purpose only for inner lane (Lane 2). The data sets for outer lane were excluded from the analysis because the data seemed irregular and inner lane is considered worst scenario of traffic flow. The traffic count was conducted from 6 October 2016 until 10 October 2016.
Data Analysis
The data arranged based on 5-minute interval from 9.00 am to 12.00 noon on the second day (7 Oktober 2016) with 36 sets of data. Then, the data was summarized into the graphic analysis (descriptive analysis) which describes the basic future of the data such as mean, mode, median, and others. In addition, all the data is analyzed by using Microsoft Excel and Minitab to obtain the Level of Service of the road based on MHCM 2011 and HCM 2010.
RESULT AND DISCUSSION
The data analysis begins with the descriptive statistics of performance measure. The descriptive statistic is to show in graphically and numerically the difference between MHCM 2011, HCM 2010 and Empirical data. The next procedure was to determine the different between the means for by using the paired T-test analysis. Then, the validation measure was carried out to determine the accuracy of HCM 2010 and MHCM 2011 in measuring the performance of multilane highway by determining Mean Square Error (MSE) and Mean Absolute Error (MAE).
Descriptive Analysis
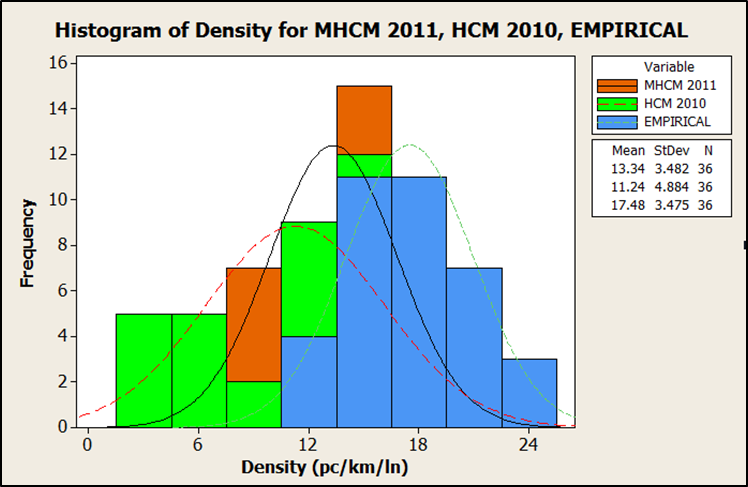
The frequency distribution of density for Empirical, MHCM 2011, and HCM 2010 is shown in Figure 18. The table shows that the mean density for HCM 2010 is lower than empirical and MHCM 2011. Meanwhile the mean density for MHCM 2011 is more closed to the empirical data. This indicates there is a potential different between the MHCM 2011, HCM 2010 and empirical data.
Figure 16 Histogram With Normal Curve of Density for MHCM 2011, HCM 2010 and EMPIRICAL
Table 4.1 Descriptive Analysis Of Density For MHCM 2011, HCM 2010 And EMPIRICAL
From the descriptive analysis in Figure 18, it shows the kurtosis value are close to zero means the curve have normal distribution curve.
Level Of Services (Los)
To determine the Level of service of the road with regards to existing geometric design and other surrounding road condition, the density is obtained by using of three methods which are HCM 2010, MHCM 2011 and empirical method.
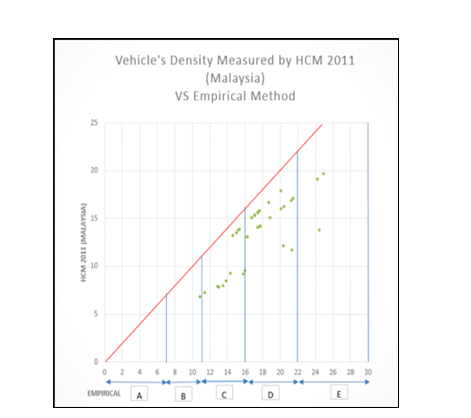
Figure 19: Road Density Computed by using HCM 2011 (Malaysia) VS Empirical Method
Road Density Computed by using HCM 2011 (Malaysia) VS Empirical Method are plotted to determine the relationship between the methods. The points were discovered to be randomly scattered below the 45° line as shown in Figure 19.
It shows that the points are found to be randomly scattered closed to the 45° line with value of density ranging from 11 pce/km/ln to 25 pce/km/ln. Its shows that the density obtained by using MHCM 2011 with regards to empirical data are falls between the LOS C, D and E.
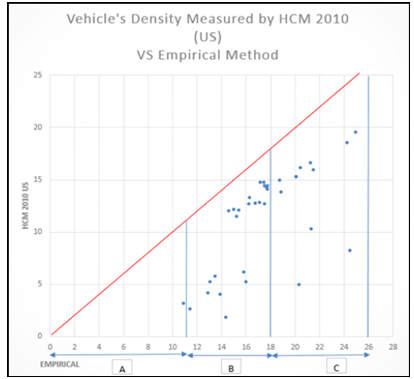
Figure 20: Road Density Computed by using HCM 2010 (Malaysia) VS Empirical Method
Based on the scattered plot shown in Figure 20, it is observed that the results from HCM 2010 methods for lane 2 are under designed. From the graph, it shows that the points which represent the density for both methods are found to be randomly scattered below the 45° line and the pattern of scattered plot are almost similar with the graph plot for MHCM method. Even though the Density that computed by using HCM 2010 (Malaysia) versus Empirical Method below the line, the density obtained shows ranging from 11-26 pc/mi/ln which fall within LOS B and C.
Table 4.2: Summary of Level of Services based on MHCM 2011
From the table 4.2, it shows that the worst LOS obtained at interval time 10.20-10.24, 10.50-10.54,11.15-11.19 and 11.30-11.34. The worst LOS are representing the peak hour period 10 am to 12 noon. During peak hour period, the LOS of the road have reaches LOS D. The traffic flow is considered as unstable flows with operating speed are being maintain and freedom to manoeuvre severely restricted
Distribution Error Analysis
The t-test is conducted for two sets of data to assess the differences of density means for MHCM 2011, HCM 2010 and Empirical methods. The hypothesis was conducted as below:
H0 = There is no significance different between the density mean of MHCM 2011, HCM 2010 and Empirical data
H1 = There is significance different between the density mean of MHCM 2011, HCM 2010 and Empirical data
The summary of the mean value for both methods is shown in Table 4.3. The mean density for HCM 2010 is higher than compare with empirical and MHCM 2011. Meanwhile the mean density for MHCM 2011 is lower and not much different to empirical method. This also indicates there is a potential different between the MHCM 2011, HCM 2010 and empirical method. This proves that the method approaches which have little different of mean with empirical method more reliable to use in evaluate Malaysia road performance. As shown in Table 4.3, by using t-test, it’s revealed that there is a statistically significant difference between the two data sets as P Values for both results measured in HCM 2011 and 2010 are less than 0.05.
Table 4.3: Paired t-test analysis between MHCM 2011, HCM 2010 and EMPIRICAL
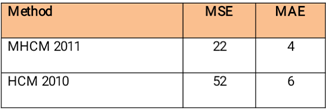
The density for MHCM 2011 and HCM 2010 is further validated in term of accuracy by determining the MSE and MAE as shown in Table 4.4. From the result obtained, it shows that the MSE and MAE value for HCM 2011 is lower compared to the values of MSE and MAE in HCM 2010. The results indicate that the MHCM 2011 is more effectively use to evaluate the performance of our road compared to Us HCM 2010 since the both values are more closed to zero.
Table 4.4: MSE AND MAE with regards to MHCM 2011 HCM 2010 (US) vs Empirical Method for Multilane Highway
CONCLUSION AND RECOMMENDATION
The performance measure for multilane highway based on the MHCM 2011 and HCM 2010regard with empirical data has been successfully evaluated in this study. Based on the data analysis carried out, MHCM 2011 is more accurate in measuring the density for multilane highway rather than HCM 2010 tend to underestimate the density at Peak hour period where the flow rate is considerably high.
From the analysis of LOS using both methods, it shows that MHCM 2011 more reflects to the actual condition of traffic flow of Malaysian road compare to HCM 2010. This is because HCM 2011 is been developed based the Malaysian highway geometrical, geographical, driver behaviour and data collections. It shows that during peak hour, the traffic is higher until it reaches LOS E. This is result from the location of study located nearby UITM Puncak Perdana and development area. By comparing the MHCM 2011 and HCM 2010 using t test, MAE, and MSE, MHCM 2011 has smaller value compared to HCM 2010. Thus, it is apparently that the HCM 2010 is less suitable to be used in evaluating level of service for Malaysia highway.
The outcomes from this study can be used as reference for enhancement into the current Malaysia Highway Capacity Manual 2011 since the limitation for the current MHCM 2011 to evaluate the performance of road facilities is only for rural and suburban Highways. Several recommendations are proposed for further research are as follows:
- It is recommended that the study should be done at different location and road classification instead of multilane highway.
- broad field data that corresponding to the study of vehicle interaction on multilane highway with considering of high traffic volumes, higher of heavy trucks and others.
ACKNOWLEDGMENT
The acknowledgement of this study goes to School of Civil Engineering, and Faculty of Business Management from Universiti Teknologi MARA for the support in completing the study including the technical staff in handling the tools and equipment. This study was supported with the grant collaboration between UiTM and Industry (100-TNCPI/PRI 16/6/2(031/2023)).
REFERENCES
- Ajinkya Mane, Pallav Kumar, Shiriwas Arkatkar, Ashish Bhaskar, Gaurang Joshi. “Comparative Evaluation Of Density Estimation Methods On Expressway: A Case Study Delhi-Gurgaon Expressway”, 117.
- Arasan, V. T., & Arkatkar, S. S. (2011). Derivation of capacity standards for intercity roads carrying heterogeneous traffic using computer simulation. Procedia-Social and Behavioral Sciences, 16, 218-229.
- B.S. Kerner, Three phase traffic theory and highway capacity, Physica A 333 (2004) 379–450.
- C. J. Hoban, Evaluating Traffic Capacity and Improvements to Road Geometry, World Bank, Washington, DC, 1987.
- Adnan M. A., USM Phd Thesis (2006) Development of entrance ramp merging density model based on an urban expressway traffic condition.
- Highway Planning Unit Ministry of Works Malaysia (2011).
- Highway Capacity Manual (HCM) 2011.
- James, O. E. (2012). Application of Highway Capacity Manual 2010 Level-of-Service Methodologies for Planning Deficiency Analysis. Trace: Tennessee Research and Creative Exchange. University of Tennessee, Knoxville.
- Khanna, S. K, Patel, L. M., Chari, S. R. (1976). Study of Traffic Flow Characteristics on Roorkee Hardwar Road During Kumbh-Mela. Indian Highways, 4(7), 22-29.
- Manraj S. B., Balaji Ponnua , Shriniwas S. A. (2012). Modeling of Traffic Flow on Indian Expressways using Simulation Technique. Procedia – Social and Behavioral Sciences 43( 2012 ) 475 – 493.
- N. A. Weiss. Introductory statistics.4th Alternate Edition, Addison-Wesley Publishing Company, United States of America, 1997
- ROAD TRAFFIC VOLUME MALAYSIA (2014). Kuala Lumpur, Wilayah Persekutuan: Ministry of Works Malaysia, Highway Planning Division.
- M.A Adnan, Sulaiman N and TBHT Besar, . Vehicle speed measurement technique using various speed detection instrumentation, Business Engineering and Industrial Applications Colloquium (BEIAC), 2013
- Semeida, A. M. (2013a). New models to evaluate the level of service and capacity for rural multi-lane highways in Egypt. Alexandria Engineering Journal, 52, 455–466.
- Tiwari, G.Joseph, P., Fazio, E., Chatteerjee, N. (2008). Continuity Equation Validation for Non-Homogenous Traffic. Journal of Transportation Engineering, ASCE, 134(3), 118-127.
- T.Chai, R.R Draxler 2014. Root Mean Square Error (RMSE) or Mean Absolute Error (MAE)?-Arguments against avoiding RMSE in the Literature. Published by Geoscientific Model Development.
- Transportation Research Board of The National Acadamies Washington, DC(2010). ‘’Highway Capacity Manual (HCM) 2010”
- X. Yang, N. Zhang, The Marginal Decrease Of Lane Capacity With The Number Of Lanes On Highway, EASTS 5 (2005) 739–749


