Comparison of 85th Percentile Operating Speed with different Median Segregation for Multilane Highways: A Case Study Kapar-Kuala Selangor
- Mohd Rhazef Che Sori
- Muhammad Akram Adnan
- Wardati Hashim
- 913-925
- Dec 9, 2023
- Transport Management
Comparison of 85th Percentile Operating Speed with different Median Segregation for Multilane Highways: A Case Study Kapar-Kuala Selangor
Mohd Rhazef Che Sori1, Muhammad Akram Adnan2, Wardati Hashim3
1Infra & Building Works, Sepakat Setia Perunding Sdn Bhd, Seri Kembangan, Selangor, Malaysia
2,3School of Civil Engineering, College of Engineering, Universiti Teknologi MARA, Shah Alam, Selangor, Malaysia
DOI: https://dx.doi.org/10.47772/IJRISS.2023.7011070
Received: 25 October 2023; Revised: 08 November 2023; Accepted: 13 November 2023; Published: 09 December 2023
ABSTRACT
This study was conducted to compare the 85th percentile operating speed with different median segregation for multilane highways at three locations which are road with physical median, road with marking road median (deterioration) and road with marking road median. The site survey for this roadway is located at Jalan Kapar-Kuala Selangor, Selangor which is a multilane highways and road design standard is R5. Site condition in this area is flat terrain. Laser meter detector was used to collect the spot speed data of the various vehicle classes at three different locations with three different median segregations. Linear regression and paired t-test analysis was employed using Minitab statistical software to identify the significant difference in speed at the different median segregations. The results revealed that there is significant difference in the vehicle speed at location 1 where the physical median is present where the speed is 90.81 km/hr. Meanwhile, at location 2 and location 3 there are no significant difference in the vehicle speed. The vehicle speeds at these locations are 85.59 km/hr and 103.3 km/hr respectively. This indicates that the present of the different median segregation at the location has influence on the vehicle speed. Therefore, it is suggested that physical median segregation should be present at the multilane highways to increase the safety of the road users.
Keywords: 85th percentile speed, median segregation, multilane highways, flow rate.
INTRODUCTION
Highway geometry is a significant factor that affects the efficiency and safety of highway system. The geometric design of highways involves designing the physical and visible features of the road. Highway geometric design include cross-sectional elements, sight distance, alignment, curve, super elevation, and other related features. It is important to consider the future traffic growth in planning and designing the geometric elements of a road or highway during the initial design stage. Good geometric design will provide an appropriate level of mobility and land use access for road users while maintain a high degree of safety (Fitzpatrick et al., 2003).
Speed is an important fundamental measurement in the geometric design of roads. Speed of vehicles can be influenced by various factors such as traffic density, driver’s behaviour, behaviour and types of vehicle, weather conditions, physical characteristics of the road etc. (Mishra et al., 2018). Normally, the speed limit of the highway is based on the 85th percentile speed. Operating speed refers to the highest overall speed which a driver can travel. In Malaysia, the ATJ 8/86 is used as the reference to the selection of design speed is based on the rural and urban standard.
Multilane highways exist in a number of settings from typical suburban communities leading to central cities or along high-volume rural corridors that connect two cities or significant activities generating a substantial number of daily trips (A. Awad & A. Mohammed, 2013). In Malaysia, multilane highways are very common and it can be undivided or divided. Divided highways are separated with a rigid or flexible barrier. These barriers may be paved or it might be a landscape median that separates each direction (Highway Capacity Manual, 2011).
In the present study, three different site locations, with different median segregation, were selected in order to compare 85th percentile speed. Three different median segregation were selected which are road with physical median, road with marking road median (deterioration) and road with marking road median.
PROBLEM STATEMENT
Driving is one of the individual skills that require a high level of concentration and efficiency. Several factors can affect the level of driving efficiency such as human factors, vehicle conditions, environmental conditions, and road geometry design factors (Wang et al., 2013).
Median segregation is one of the road geometry design for multilane highways. The function of median segregation is to separate the traffic flow in opposite direction. With the present of median, it can reduce the number of accidents such as head-on and angle collisions (Lanzaro & Andrade, 2018). It was found that the present of the median at the multilane highways has influenced on the vehicle speed. In the present study, the road design standard is R5 and the design speed for flat terrain is 100km/hr. Based on the road design standard and design speed, the posted speed limit should be 90 km/hr. However, based on the site observation the posted speed limit is 60 km/hr. The posted speed limit does not comply with the current road design standard which is R5. Hence, the present study was carried out to identify the actual 85th percentile speed at the three different median segregations.
OBJECTIVE
The objective of the present study is to evaluate the significant difference between different median segregation for multilane highways based on the 85th percentile speed. There are three median segregation; road with physical median, road with marking road median (deterioration) and road with marking road median. Parameter for this existing road geometric design standard is R5 with posted speed limit of 60 km/hr.
SCOPE OF WORK
The data collection was conducted at three different sessions and at three different locations during daytime. The first session was in the morning from 9.30am – 10.15am. The second session was from 10.45am – 11.30am. The third session was from 1.30pm – 2.15pm. Time allocated for each location to capture the spot speed and traffic counting was 45 minutes. Each location has different median segregation whereby the first location with physical median, second location with marking road median (deterioration) and third location with marking road median.
Three numbers of laser meter detector were used to capture the spot speed data. Each device was used at lane 1, lane 2 and lane 3. Lane 1 and lane 2 are the lanes from Kapar to Kuala Selangor while lane 3 is from Kuala Selangor towards Kapar. The present study is focusing on the lane 3 for all locations. The collected data was used to evaluate the significant difference of the median segregation by performing linear regression analysis and paired t-test analysis using Minitab 19 statistical software. The data also used to justify and provide recommendation on the geometric design parameters of the existing selected road.
LITERATURE REVIEW
Research Process
The research process to evaluate the influence of different median segregation on the speed at multilane highways is presented in Figure 1.
Figure 1: Research Process Flowchart
Speed Terminology
Speed is a fundamental measurement of the traffic performance on the road system. Speed is defined as the rate of movement of a vehicle in distance per unit of time. Speed terminology are explained in Table 1.
Table 1: Speed Terminology
| Type of Speed | Description of Terminology | ||
| Operating Speed | Highest overall speed at which a driver can travel on a given road under favorable weather and prevailing traffic conditions without any exceeding the design speed on a section-by-section basis (ATJ, 1986). | ||
| Design Speed | A speed selected to establish specific minimum geometric design elements for a particular section of highway. These design elements include vertical and horizontal alignment and sigh distance. Other features such as widths of pavement and shoulder, horizontal clearances, etc., are generally indirectly related to the design speed (ATJ, 1986). | ||
| 85th percentile speed | The speed of traffic is determined by measuring the speeds of a sizable sample of vehicles and it is usually within the “pace” or speed range used by most drivers at a particular road location or geometric features (AASHTO Green Book, 2011) | ||
Design Speed Criteria
The geometric condition is identified before deciding the design standard of a location. Design speed is the maximum safe speed that can be maintained over a specific of the road when conditions are so favorable that the design features of the road governs.
Table 2: Design Speed (Rural)
| Design Standard | Design Speed (km/hr) | ||
| Terrain | |||
| Flat | Rolling | Mountainous | |
| R6 | 120 | 100 | 80 |
| R5 | 100 | 80 | 60 |
| R4 | 90 | 70 | 60 |
| R3 | 70 | 60 | 50 |
| R2 | 60 | 50 | 40 |
| R1 | 40 | 30 | 20 |
METHODOLOGY
Location
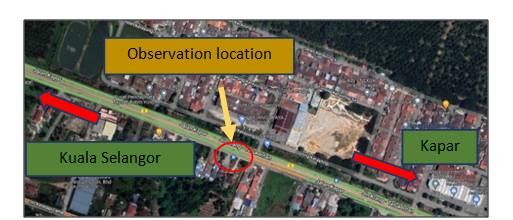
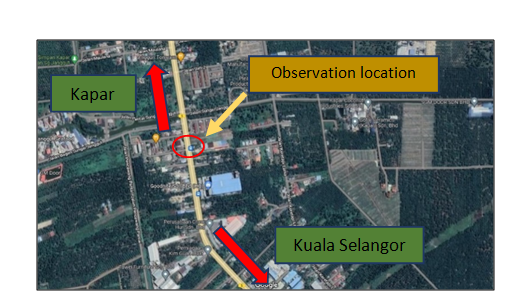
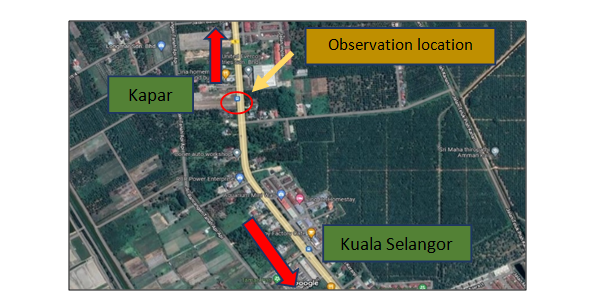
This study was conducted at Jalan Kapar-Kuala Selangor, Selangor. The road at Jalan Kapar-Kuala Selangor is a multilane highways and the design standard is R5. The posted speed limit signage at the site location is 60 km/hr. The geometric topography area for these three locations is flat terrain. The map of site locations are presented in Figure 2, Figure 3 and Figure 4. The actual site locations are presented in Figure 5, Figure 6 and Figure 7.
Figure 2: Location 1 (With Physical Median)
Figure 3: Location 2 (with marking road median (deterioration))
Figure 4: Location 3 (with marking road median)
Instrumentation
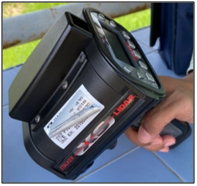
Spot speed data were measured using Laser meter detector (Figure 8). The technology in this detector provides aiming target capability to detect the vehicle speed and distance. This advance technology used invisible light waves and the frequency will be much higher. This instrument use infrared to measure the speed and distance of the target. When the trigger is pulled, infrared will measure the speed and distance of the target. From the elapsed time taken, distance of the target will be measured. A sophisticated algorithm then is used to derive the speed of the target from successive number of range calculation. Then, the speed of the target will be displayed in the gun. The speed and range were recorded to signify the data during data analysis.
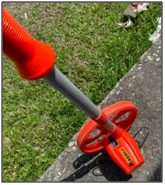
Other than that, traffic countering based on vehicles classes were recorded using the traffic count (Figure 9). Vehicle class are divided by class 1, 2, 3,4 and 5 based on the Highway Capacity Manual, 2011. The geometric lane width, median width and shoulder width were taken using a roller meter (Figure 10).
Figure 8: Laser meter detector

Figure 9: Traffic counter
Figure 10: Roller meter
Data collection
Data of the study area has been measured and recorded. The data collection was carried out at three locations which are location 1, 2 and 3 where these areas were the focus of this study. The geometric elements include the lane width, shoulder width, median width and speed limit signage were recorded. The speed data and traffic countering were collected at every 5 minutes interval for 45 minutes for each site location. The summary of the geometrical data of the study area is tabulated in Table 3.
Table 3: Geometrical data
| Item No | Geometric Component | Measurement Location 1 | Measurement Location 2 | Measurement Location 3 |
| 1 | Lane width | 3.5m | 3.5m | 3.5m |
| 2 | Median width | 2.3m | 3.0m | 3.0m |
| 3 | Shoulder width | 2.0m | 2.0m | 2.0m |
| 4 | Speed limit signage | 60 km/hr | 60 km/hr | 60 km/hr |
The first cycle of data collection was at physical median. The second cycle of data collection was at road with marking road median (deterioration) and the third cycle of data collection was at road with marking road median.
RESULTS AND ANALYSIS
Abbreviation and Acronym of Empirical Data Analysis
Abbreviations and acronyms need to be well-deliberated and addressed in data analysis. This is because the data need to have a clear understanding to the readers and give an ample indicator for further references. Table 4 shows the abbreviations and acronyms used for the data analysis.
Table 4: Abbreviations and acronyms of empirical data analysis
| RWPM | Road with physical median | ||
| RWMRM-D | Road with marking road median (deterioration) | ||
| RWMRM | Road with marking road median | ||
| V 85 | 85th percentile speed (km/hr) | ||
85th Percentile Speed Analysis
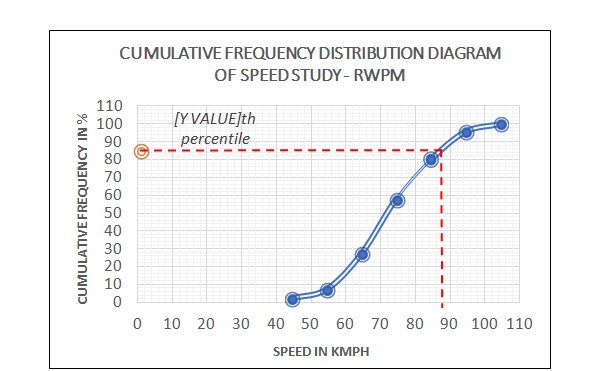
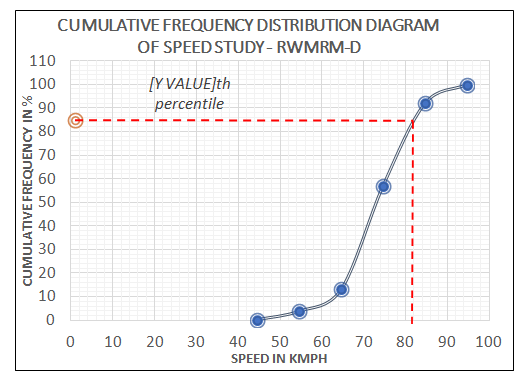
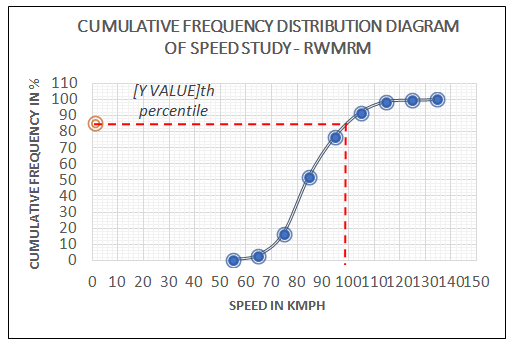
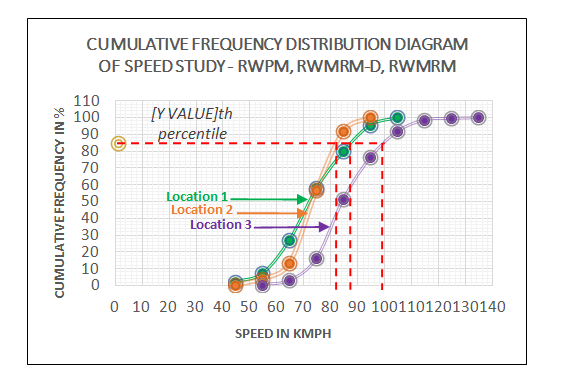
Spot speed data is recorded to perform the 85th percentile speed analysis. The samples of speed data were recorded. Posted speed limit for these three locations is 60 km/hr. Refer to the graph plotted in Figure 11, the 85th percentile data for RWPM condition is 88km/hr. Meanwhile 85th percentile data for RWMRM-D condition is 82 km/hr and 85th percentile data for RWMRM condition is 99 km/hr as shown in Figure 12 and Figure 13. Figure 14 shows the 85th percentile at three locations. Based on the site empirical data, it shows that the present of the median segregation has influenced on the speed of the vehicles.
Figure 11: 85th percentile for RWPM
Figure 12: 85th percentile for RWMRM-D
Figure 13: 85th percentile for RWMRM
Figure 14: 85th percentile for RWPM, RWMRM-D, RWMRM
Relationship between speed and flow rate
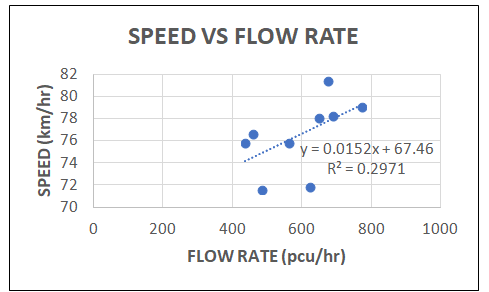
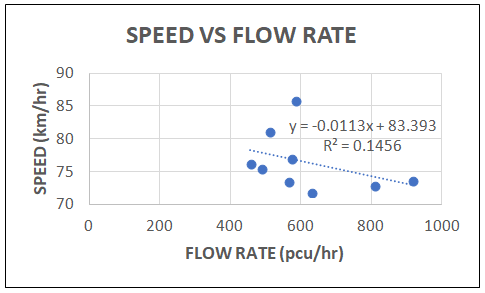
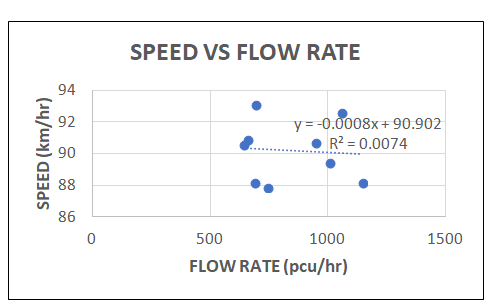
Flow rate is defined as the equivalent hourly rate at which vehicle pass over a given point or section of highways during a given time interval. Based on the empirical data collected at site location, the speed-flow relationship for RWPM as shown in Figure 15 indicates that the average travel speed increased with increasing flow rate. Meanwhile, the speed-flow relationship at RWMRM-D and RWMRM as shown in Figure 16 and Figure 17 indicate that the average travel speed decreased with increasing flow rate.
Figure 15: Speed vs Flow Rate at RWPM
Figure 16: Speed vs Flow Rate at RWMRM-D
Figure 17: Speed vs Flow Rate at RWMRM
Linear Regression Analysis
Linear regression analysis is Predictive Analysis that commonly used to modelling the relationship between two by fitting a linear equation to observe the data. There are two variables determined for regression analysis; (i) 85th percentile speed and (ii) flow rate. Equation 1, 2 and 3 below show the linear regression analysis for this study.
The linear regression equation for V85 model for RWPM is shown in equation 1. The equation shows that the coefficient for the predictor variable RWPM has a positive sign, implying that an increase in the flow rate, will lead to an increase in the V85 at RWPM.
V85 = 76.53 + 0.02403 flow rate (R2=0.576) (1)
Table 5 shows that the inverse square root of flow rate and V85 at RWPM is significant where the p-value is less than 0.05. This indicates that the predictor is significant. Based on the linear regression equation, the average V85 at RWPM is 90.81 km/hr.
Table 5: Regression Analysis for the final model for estimating V85 for RWPM
| Term | Coefficient | Standard Error | T-Value | P-Value |
| Constant | 76.53 | 4.71 | 16.25 | 0.000 |
| Flow rate (Pcu/hr) | 0.02403 | 0.0078 | 3.08 | 0.018 |
The linear regression equation for V85 model for RWMRM-D is shown in equation 2. The equation shows that the coefficient for the predictor variable RWMRM-D has a negative sign, implying that an increase in the flow rate, will lead to a decrease in the V85 at RWMRM-D.
V85 = 94.35 – 0.01421 flow rate (R2=0.228) (2)
Table 6 shows that the inverse square root of flow rate and V85 at RWMRM-D is not significant where the p-value is more than 0.05. This indicates that the predictor is not significant. Based on the linear regression equation, the average V85 at RWMRM-D is 85.59 km/hr.
Table 6: Regression Analysis for the final model for estimating V85 for RWMRM-D
| Term | Coefficient | Standard Error | T-Value | P-Value |
| Constant | 94.35 | 6.26 | 15.07 | 0.000 |
| Flow rate (Pcu/hr) | -0.01421 | 0.00989 | -1.44 | 0.194 |
The linear regression equation for V85 model for RWMRM is shown in equation 3. The equation shows that the coefficient for the predictor variable RWMRM has a positive sign, implying that an increase in the flow rate, will lead to an increase in the V85 at RWMRM.
V85 = 100.97 + 0.00277 flow rate (R2=0.016) (3)
Table 7 shows that the inverse square root of flow rate and V85 at RWMRM is not significant where the p-value is more than 0.05. This indicates that the predictor is not significant. Based on the linear regression equation, the average V85 at RWMRM is 103.3 km/hr.
Table 7: Regression Analysis for the final model for estimating V85 for RWMRM
| Term | Coefficient | Standard Error | T-Value | P-Value |
| Constant | 100.97 | 7.15 | 14.12 | 0.000 |
| Flow rate (Pcu/hr) | 0.00277 | 0.00831 | 0.33 | 0.749 |
Paired T-Test Analysis
A paired sample t-test was conducted on the different of median segregation to determine whether there is statistically significant mean difference in the V85 and flow rate. The findings show in Table 8 that there is significant difference in the mean where the p-value is less than 0.05. This indicated that road median segregation has influenced on the speed of the vehicles.
Table 8: Paired T-Test Analysis
| Sample | N | Mean | Standard Deviation | SE Mean | T- Value | P-Value |
| RWPM | 9 | 90.8 | 3.7 | 1.2 | -13.4 | 0.000 |
| RWMRM-D | 9 | 85.6 | 4.5 | 1.5 | -10.28 | 0.000 |
| RWMRM | 9 | 103.3 | 4.4 | 1.5 | -11.29 | 0.000 |
DISCUSSION
Based on the regression analysis, it has shown that the flow rate and 85th percentile speed is significant at RWPM. This indicates that the present of physical median at the multilane highways has influenced on the speed. Based on the regression equation 1, the average speed at RWPM is 90.81 km/hr. The speed is following the design standard for Jalan Kapar-Kuala Selangor which is R5. Based on this finding, it can be suggested that physical median should be used as separator for multilane highways as it has the potential to control on driver’s behavior when driving. Besides that, Lanzaro & Andrade (2018) stated that the usage of physical median as separator could reduce the number of road accidents.
For RWMRM-D and RWMRM, the regression analysis shows that the flow rate and 85th percentile speed is not significant. The average speed at RWMRM-D is 85.59 km/hr and RWMRM is 103.3 km/hr. This has implied the speed of the vehicle is not following the speed limit design standard for R5 which is 90 km/hr. Therefore, the design speed concept needs to be understood well especially in the multilane highways.
Based on the paired t-test, it portrayed that the different road median segregation shows a difference in the speed of the vehicle. The present of physical median segregation is more significance compared to the road marking median because the speed is within the speed limit when the physical median is present.
RECOMMENDATIONS AND CONCLUSION
Few recommendations can be suggested based on the site observations and findings of the study. One recommendation is to replace the current posted speed limit. The current posted speed limit is 60 km/hr which is not following the design standard for R5. The authority should replace the speed limit signage to 90 km/hr as per ATJ 8/86 (2015) design standard. It is important to put the correct speed limit signage as it is designed to communicate a set legal maximum or minimum speed that vehicle must travel. The second recommendation is to re-paint the median with road marking at location 2. The current median with road marking is deterioration. This is not safe for the drivers as they will confuse and will have the potential to enter the opposite lane especially at night. To avoid drivers’ confusion at RWMRM-D and RWMRM, it is recommended to provide reflectorised road studs at both sides of road median with road marking. This is to enable the road users to control the vehicles timely as the reflectorised road studs can highlight the boundaries of the median segregation and to enhance the visibility in the event of darkness. Additionally, it can be recommended to construct physical median at location 2 and location 3. Based on the present study, it has been proven the vehicle speed is within the speed limit at location 1 where the physical median is present. The speed at location 2 and location 3 can be controlled and within the speed limit if there is physical median at the location. Besides that, the present of physical median can enhance the safety of the road users as they will be more aware of the lane. The following recommendation is for the authority to re-check the width of the median segregation and road shoulder. Based on the observation, the width is not following the design standard R5 for multilane highways as stated by ATJ 8/86. Table 9 shows the difference between existing width and ATJ 8/86.
Table 9: Width difference between existing width and ATJ 8/86
| Item No | Geometric Component | Measurement Location 1 | Measurement Location 2 | Measurement Location 3 | ATJ 8/86 |
| 1 | Median width | 2.3m | 3.0m | 3.0m | 4.0m |
| 2 | Shoulder width | 2.0m | 2.0m | 2.0m | 3.0m |
In conclusion, the outcome from this study is valuable and can be used to implement and enhance into current guideline and standard in Malaysia. Few recommendations should be taken into consideration to increase the safety of the road users and to avoid accident such as vehicle “off” the control and head on collision.
REFERENCES
- AASHTO Green Book (6th ed.). (2011). American Association of State Highway and Transportation Officials.
- Awad, H., & A. Mohammed, H. (2013). Evaluating Traffic Operation for Multilane Highway (Ramadi – Fallujah) Highway as Case Study. Iraqi Journal of Civil Engineering, 9(1), 120–134. https://doi.org/10.37650/ijce.2013.80394
- ATJ 8/86. (2015). A Guide on Geometric Design of Roads. Ibu Pejabat JKR Malaysia.
- Fitzpatrick, Kay., National Cooperative Highway Research Program., & National Research Council (U.S.). Transportation Research Board. (2003). Design speed, operating speed, and posted speed practices. Transportation Research Board, National Research Council.
- Highway Capacity Manual. (2011). Highway Capacity Manual. Highway Planning Unit Ministry of Works Malaysia.
- Lanzaro, G., & Andrade, M. (2018). Influence of Traffic Flow Separation Devices on Road Safety in Brazil’s Multilane Highways Procedimento Para Auditoria De Seguranca Viaria Incluindo Avaliacoes Em Ambientes Virtuais View project Controladores Semafóricos Fuzzy View project. https://www.researchgate.net/publication/336813492
- Minitab Statistical Software (2023), Minitab Version 19.0. Microsoft Window 10 home single language, Minitab LLC of the United States.
- Mishra, U., Venkatesh, K., & Anshu, A. (2018). Study Of Speed Characteristics On Multilane Highway. International Journal of Pure and Applied Mathematics, 120(6), 7249–7258.
- Wang, J., Li, K., & Lu, X. Y. (2013). Effect of Human Factors on Driver Behavior. In Advances in Intelligent Vehicles (pp. 111–157). Elsevier Inc. https://doi.org/10.1016/B978-0-12-397199-9.00005-7


