
Consumption Pattern Analysis of Water Consumption For Commercial Connections in Davao City
- Verlie S. Tuyor
- Aristeo C. Salapa
- 157-162
- Mar 30, 2023
- Environment
Consumption Pattern Analysis of Water Consumption For Commercial Connections in Davao City
Verlie S. Tuyor1 , Aristeo C. Salapa2
1College of Development Management, University of Southeastern Philippines, Mintal, Davao City
2University of Southeastern Philippines, Mintal, Davao City
Received: 18 February 2023; Revised: 01 March 2023; Accepted: 04 March 2023; Published: 30 March 2023
ABSTRACT
This study applied the fundamental time series analysis to evaluate the distribution, trend, and later forecast of water consumption for commercial connections by classification of Davao City Water District (DCWD). As such, this study examined the relationship between time and the water consumption of Davao City’s commercial connections over time. The monthly water consumption of commercial connections, categorized by classification per water source systems, was the data source for this study, which ran from January 2015 to December 2019. The four categories of commercial connections’ time series statistics suggested that, from 24 million cubic meters in 2018, commercial consumption dropped to 20 million cubic meters in 2019. This decline is explained by a decrease in consumption of commercials 2.0 and 1.25 classification. The data showed that during the first quarter of the year, increases were observed within five years (short-term). For commercial type 2.0, in 2022, forecasted water consumption would reach 14 million cubic meters in some improved areas of operations. Hence, specific forecasting by type of connection requires in-depth analysis. Thus, further study is required for long-term forecasting.
Keywords: water consumption, time series analysis, commercial connections, commercial type of classification, water source systems, and trend.
INTRODUCTION
Sustainable development refers to the practice of satisfying current needs while preserving the ability of future generations to fulfill their own requirements. The Sustainable Development Goals (SGDs) outline in the 2030 Agenda for Sustainable Development constitute the most significant global framework for fostering international cooperation. Goal six of the SDGs, which involves access to clean water and sanitation, is critical for various facets of human existence, including socioeconomic advancement, food and energy production, and the welfare of ecosystems. Achieving this goal is essential for ensuring both human survival and sustainable development. Rapid population expansion, urbanization, and increased water needs from the agricultural, industrial, and energy sectors are all contributing to an increase in demand for water. Water shortage is primarily a problem for the community that provides food, shelter, electricity, and so on (Enbeyle et al., 2022). Davao City is one of the highly urbanized cities in the Philippines and is the most developed city in the Davao Region. It is envisioned to emerge as the main administrative, financial, and commercial core of the island, with primary urban centers, suburban centers, economic zones, and tourism development zones. This growth will result in additional businesses requiring water connections. It is anticipated that in the near future, the issue of allocating water resources among major users will become increasingly significant. By forecasting water consumption, the management and quality of the supply service can both be enhanced. (Enbeyle et al., 2022) claimed that forecasting for water consumption effectively can also assure the demand of water consumption and water management during various periods to service the quality of water supply consumption. Water resources management has always been a research hotspot, and has received widespread attention from scholars worldwide (Bian et al., 2022). {Sun, 2022 #167} argue that there is a high degree of confusion between the concepts water consumption, water use, water withdrawal and water demand. Water use refers to the actual amount of water resources used at a certain period of time or in a region or for a specific production activity. Water withdrawal generally refers to the amount of water extracted from a water source within a certain period of time or in an area for a specific production activity. Water demand refers to the amount of water resources required for a specific time or in a region for a specific activity (Gleick, 2003). Water consumption has two separated meanings: 1) The relatively narrow understanding, which refers to the amount of water resources that evaporate and infiltrate in an irreparable loss. 2) The widely understood concept of water consumption which refers to the actual water usage at a certain period of time for a specific production activity (Sun & Li, 2022). The concept of water consumption used in this study refers to the latter. The aim of this study is to analyze the distribution, trend, and forecast of water consumption for commercial connections based on the classification of Davao City Water District (DCWD), the primary water provider in Davao City. As the population of the city has grown over time, more residential, commercial, and industrial structures have been constructed, leading to an increase in demand for water. The rise in per capita consumption can largely be attributed to expanding economic activity, driven by the construction industry, including hotels, residential subdivisions, condominiums, shopping centers, parks, highways, and factories (Oh & Yamauchi, 1974). In the case of DCWD, the monthly average increase in consumption for commercial connections was 0.33% from 2015 to 2019. This type of analysis is necessary for planning water service expansion, which is the purpose of this study. The study aims to explore the relationship between time and water consumption of commercial connections in Davao City over time. The findings of this study will assist DCWD in strengthening its capacity to expand service coverage and manage water resources, essential for addressing future water supply concerns in Davao City.
Materials and Methods
Study Area
Davao City, located in the southeastern region of Mindanao, Philippines, is the world’s second-largest city. Its population has grown from 1,632,991 in 2015 to 1,776,949 in 2020 (Philippine Statistics Authority, 2022). The majority of the city’s barangays (64%) are served by the Davao City Water District (DCWD), which is known for providing some of the highest-quality drinking water in the country, exceeding the standards set by the Philippine National Standards for Drinking Water (PNSDW). DCWD’s service coverage is distributed among 11 water supply systems (WSS), including Dumoy, Tugbok, Toril, Panacan, Malagos, Lubogan, Riverside, Calinan, Cabantian, Tibungco, and Binugao-Sirawan. Currently, DCWD serves 73.69% of the city’s population, with the bulk of its consumption and connections coming from residential areas (74.70%), followed by commercial areas (21.97%) and government institutions (3.32%).
Scope and Limitations
The study is intended for the consumption pattern of commercial connections including its four (4) types of connection. Hence, the study is limited to the following factors:· tackled only the trends of the available data; · applied the basic time series analysis, hence, in-depth analysis such as best model fit (e.g., AR, MA, ARMA, ARIMA are excluded in the study);· limited access on the main reasons for the changes of its consumption pattern over time.
Data Collection
This study used a quantitative approach. Quantitative research is the process of collecting and analyzing numerical data. It can be used to find patterns and means, make predictions, test causality, and generalized a result to a wider population. For this study, time series data for the consumption of commercial connections are considered. Data were obtained from secondary sources and present monthly water consumption of commercial connections per type of classification from January 2015 to December 2019. Due to the impact of COVID-19, consumption data from 2020 to 2022 was considered outliers and not included in the analysis. The dataset includes 60 points, providing observations for time series analysis.
Methods Methods of Data Collection
The secondary data on water consumption for the four (4) water connections was collected by submitting a request letter to the Davao City Water District (DCWD) Office. An official letter of request was prepared to obtain the data, and once approved, the data was tabulated in Microsoft Excel by year and type of connection. The data on water consumption was based on monthly reading dates, and it was further analyzed using the Statistical Package for the Social Sciences (SPSS).
Methods of Data Analyses
The data analysis methods considered in the study were tested for time series, randomness, stationarity, trends, seasonality, and the fitness of the time series model. Each method will be discussed in the following section. Time Series. Since the data is the monthly consumption by type of commercial connections over time, time series analysis was considered. The time is considered as independent variable that affects the commercial consumption. Time series analysis seeks to understand patterns in changes over time. Test of Randomness. The term randomness in time series is referred to as observations that fluctuate around a constant value (such as mean-variance) and assumed to be statistically independent. Randomness is tested in this study to ensure that the series of data is non-random so that data can be modeled properly. Test of Stationarity. Stationarity means the data sets has no indication of trend, has a constant variance, a constant autocorrelation pattern, and no seasonal pattern. Trends. When trends are present in a time series, shorter lags typically have large positive correlations because observations closer in time tend to have similar values. Seasonality. Time series data depicts seasonality and it requires subject-area knowledge. Forecasting with seasonality component need to account its repeating cycle. When seasonal patterns are present, the autocorrelations are larger for lags at multiples of the seasonal frequency than for other lags. Time Series Model. For this study, to test randomness, stationary, trends, and seasonality, Both Auto and Partial Autocorrelation Functions (ACF and PACF) will be utilized. Both of these patterns for the autoregressive models tend to fit well in smooth time series.
RESULTS AND ANALYSIS
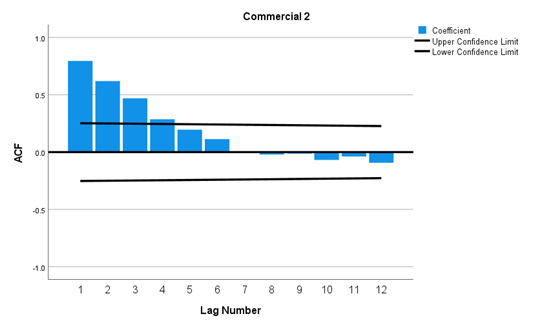
Time-series data on the four types of commercial connections shows that commercial consumption dropped from 24 million cubic meters in 2018 to 20 million cubic meters in 2019. This drop in consumption can be attributed to a reduction in consumption from Commercial 2 and 1.25. The monthly consumption of water for different types of connections does not show a consistent increasing trend over time. In 2015 and 2016, the third quarter had higher water consumption, but from 2017 to 2019, the fourth quarter had higher consumption. Therefore, the pattern changes over time, which is a characteristic of non-stationarity. To address this non-stationary characteristic of the time series data on commercial water consumption, it is recommended to transform the data using logarithms. The original data was analyzed using the Auto Correlation Function (ACF) and then transformed using the Partial Autocorrelation Function (PACF) after taking the logarithm.
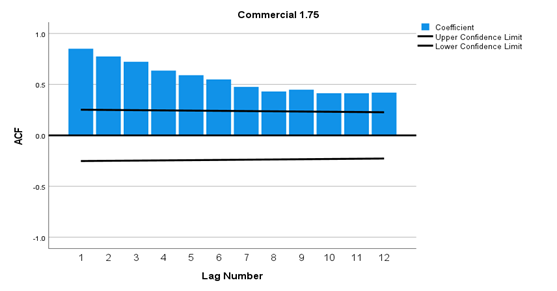
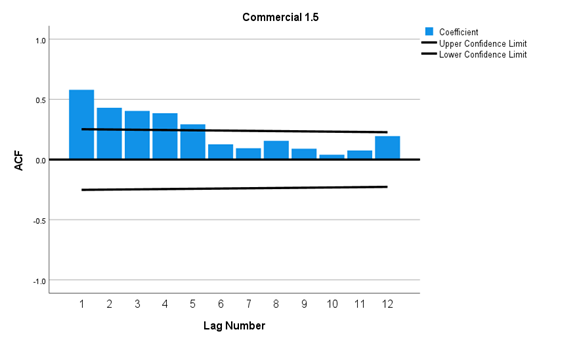
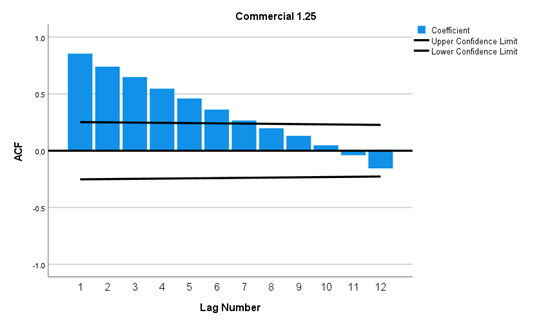
ACF
Among the different types of connections, Commercial 2.0 and 1.5 exhibit a similar trend. At lag 5, Commercial 2.0 slowly approaches zero until lag 7. On the other hand, Commercial 1.5 and 1.25 approach zero at lag 10.
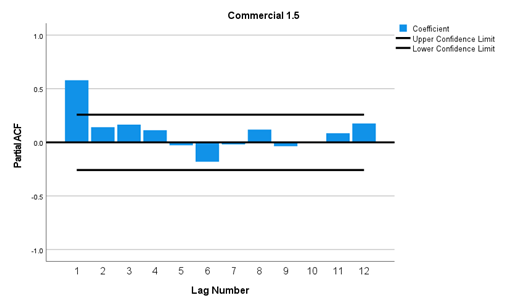
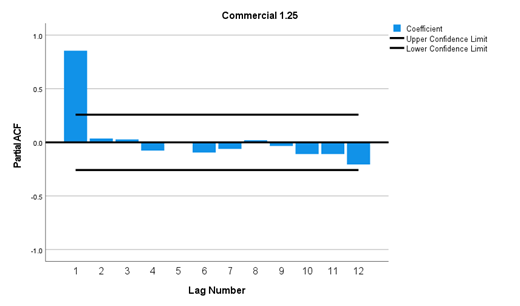
PACF
To analyze the characteristics of the time series data, PACF was applied after transforming the data to a logarithmic scale. It was revealed that all types of commercial connections showed a significant positive correlation at the first lag, with the correlation gradually decreasing toward zero for subsequent lags. However, we observed a positive spike at lag 9 for the 1.75 commercial connection.
Significance of the Results
The results are based on the actual consumption patterns observed during the covered period, which shows spikes in consumption typically occurring in the first quarter. The dependent variable of time has a significant impact on commercial consumption. To ensure an appropriate analysis, the tests mentioned in the data analyses were considered.
DISCUSSION
The study aims to examine the distribution, trends, and forecast the water consumption based on the type of commercial connections of the Davao City Water District (DCWD). The data shows an increase in water consumption for commercial types in the first quarter of the year. However, a decrease in water consumption for commercial types 2.00 and 1.75 was observed in the second and third quarters at the start of the covered period. Nevertheless, water consumption began to increase in the latter years of the covered period, as illustrated in the PACF correlogram. This could be attributed to the transient population, as holidays are over, and work and classes have resumed, resulting in more people engaged in business establishments and other activities.
CONCLUSION
Forecasting water consumption is one of the most important tasks when expanding a water supply system. This is accomplished using time series data of water consumption. The data indicates that within the first quarter of the year, there has been an increase observed over the last five years (short-term). For commercial type 2.0, it is projected that water consumption will reach 14 million cubic meters in 2022 if certain operational areas are improved. Therefore, specific forecasting by type of connection requires in-depth analysis. Further study is necessary for long-term forecasting.
REFERENCES
- Phillipine Statistics Authority. (2022, September). http://rsso11.psa.gov.ph/. Retrieved from http://rsso11.psa.gov.ph/: http://rsso11.psa.gov.ph/sites/default/files/content/Signed221028a_September-2022_Quickstat-Davao-City.pdf
- Bian, D., Yang, X., Xiang, W., Sun, B., Chen, Y., Babuna, P., . . . Yuan, Z. (2022). A new model to evaluate water resource spatial equilibrium based on the game theory coupling weight method and the coupling coordination degree. Journal of Cleaner Production, 366, 132907.
- Enbeyle, W., Hamad, A. A., Al-Obeidi, A. S., Abebaw, S., Belay, A., Markos, A., . . . Derebew, B. (2022). Trend Analysis and Prediction on Water Consumption in Southwestern Ethiopia. Journal of Nanomaterials, 2022.
- Gleick, P. H. (2003). Water use. Annual review of environment and resources, 28(1), 275-314.
- Hearne, D., Gamboa, R., & Monsanto, V. M. (2008). From ideas to action: A review of implementing HELP principles in river basins with limited resources and capacity. Water SA, 34(4), 504-511.
- Oh, H.-S., & Yamauchi, H. (1974). WRRCTR No. 84 An economic analysis of the patterns and trends of water consumption within the service areas of the Honolulu Board of Water Supply.
- Sun, B., & Li, F. (2022). Water consumption patterns of 110 cities in the Yangtze River Economic Belt in 2015. Frontiers in Earth Science, 1499.