
Cost Leadership Strategy and Mortgage Performance of Banking Institutions within the Mortgage Industry in Kenya
- Samuel Omondi Okelo
- Dr. Daniel Wanyoike
- Dr. Joel Koima
- Dr. Patrick Kibati
- 1-16
- Jul 25, 2024
- Banking
Cost Leadership Strategy and Mortgage Performance of Banking Institutions within the Mortgage Industry in Kenya
Samuel Omondi Okelo1, Dr. Daniel Wanyoike2, Dr. Joel Koima3, Dr. Patrick Kibati3
1Ph.D Student, Jomo Kenyatta University of Agriculture and Technology (JKUAT), Kenya,
2Ph.D, Senior Lecturer, Jomo Kenyatta University of Agriculture and Technology (JKUAT), Kenya
3Ph.D, Senior Lecturer, Kabarak University, Kenya
DOI: https://dx.doi.org/10.47772/IJRISS.2024.807001
Received: 14 June 2024; Accepted: 03 July 2024; Published: 25 July 2024
ABSTRACT
This study sought to determine the influence of cost leadership strategy on mortgage performance of banking institutions within the mortgage industry in Kenya whilst assessing the moderating effect of bank size measured using total net asset base and branch network. About 83% of lending to the mortgage market was carried out by only 8 out of the 39 registered banks as at December 2022. The study was based on the theories of Porter’s Generic Strategies and Resource-Based View (RBV) of competitive advantage. To achieve the research objective, a sample of 30 commercial banks was picked out of the entire accessible population of 39 banking institutions. Respondents from the banks’ offices in Nairobi, Mombasa, Nakuru, and Kisumu were considered for the study. Questionnaires, with 5-point Likert-scale responses were administered to the respondents. There were five respondents drawn from the mortgage experts in each bank making 150 respondents with a response rate of 78.7%, or 118 questionnaires being returned. The data gathered was presented using descriptive statistics such as mean, standard deviation, and frequencies to measure central tendency and dispersion. From the linear regression conducted, cost leadership strategy explained 17.7% of variation in mortgage performance of banking institutions within the mortgage industry in Kenya. Regression results indicated that cost leadership had statistically significant positive influence on mortgage performance. Bank size significantly moderated the relationship between cost leadership and mortgage performance. These were justified by significant p-value that was less than 0.05. As a result, the study rejected the null hypotheses. The study recommends that banks should focus on increasing their net asset base prior to the adoption and implementation of cost leadership strategy. The Central Bank of Kenya as the industry regulator should also develop measures that encourage fewer banks with large asset bases to enhance overall mortgage performance.
Key Words: Mortgage, Cost Leadership, Performance, competitive advantage
INTRODUCTION
The international mortgage market is rather battered with Euroland difficulties well documented and a potential doom day scenario narrowly averted in the United States of America (USA). However, buying a home overseas remains an aspiration for many. It is still a buyer’s market with a good range of properties for sale and plenty of opportunity to pick up a bargain. How easy it is to obtain mortgage finance depends on location and in the USA, there are also differences between what is available in New York compared to Florida, for example (Fuster, 2014). Mortgages with fixed rates are rather widespread in the USA, as opposed to the Western European countries where mortgages with variable rates are greatly available. The USA mortgage market has rates somewhat similar to Europe, although the overall non-performing mortgages are higher in the USA than in Europe. Financing of mortgages is more dependent on the secondary mortgage markets than the infamous ceremonial government guarantees backed by covered bonds and deposits. Large mortgage players such as Fannie Mae and Freddie Mac have underwriting conditions that tend to discourage certain elements as redemption penalties. In the USA, mortgages are considered non-recourse facilities contrary to the rest of the world (Simkovic, 2019). As with most African cities, the property market is segmented into several categories ranging from the slum market where the majority of units are rental units, to middle-income properties that are not always in the formal sector to the upper end formal part of the market. By definition, little data exists on the lower- and middle-income parts of the market. The upper part of the market however is relatively developed. In the recent past, a secondary housing market has developed, in part modelled on the South African example. Having an organized secondary market is a rarity in Sub-Saharan Africa and helps in the development of a mortgage market. It allows banks to value property more precisely and assures them that in the event they seek to liquidate their loan security a considerably fluid market exists for them to be able to realize their collateral (World Bank, 2021).
A long-term mortgage loan also requires that the asset financed at least maintains its value over time, and preferably increases in value, in order to provide appropriate security to the banks. The often-poor quality of building work in Africa means that houses do not last for more than a century. However, many European development companies are becoming more active in Africa. Whilst they meet the same challenges as their African counterparts (since they have to call upon the same local contractors), nevertheless they have the resources and knowhow to improve the construction process over time. The banks providing mortgage products must themselves have access to long term funding in order to back their mortgage portfolio. Such long-term funding is often not available at all or is very limited. However, despite all these difficulties, construction companies remain keen to become more active in Africa, and to co-operate with local government and local banks to help to develop this promising market. Not only will such activity benefit the housing companies and the banks, it will also help people in Africa to meet an essential human need: owning their own home (World Bank, 2021).
The Kenyan housing finance system has grown rapidly over recent years in both value and number of loans. The market has now gone through the primary ‘germination’ stage and is preparing to go into its next development phase. Consideration now needs to be given to the requirements for ensuring sustained augmentation. The mortgage market is the third most advanced in Sub-Saharan Africa with mortgage assets equivalent to two and a half percent of the country’s Gross Domestic Product (GDP). Only Namibia and South Africa rank higher, with Botswana just a little smaller (World Bank, 2021). The Kenyan commercial banks are classified into three peer groups using a weighted composite index. The index comprises of net assets, customer deposits, capital and reserves, number of deposit accounts and number of loan accounts. A bank with a weighted composite index of 5 percent and above is classified as a large bank. A medium bank has a weighted composite index of between 1 percent and 5 percent while a small bank has a weighted composite index of less than 1 percent (CBK, 2022). Mortgage lending is largely carried out by banks in Kenya. Out of the 39 banking institutions, that is, 38 banks and one Mortgage Finance Company in the Kenyan mortgage banking structure, 32 of them have mortgage portfolios of varying sizes. Some of the lenders have just one or two loans on their books, which may be to staff members or special customers, and other banks are much larger players who see mortgages as a major business centre. There are two types of lenders that can be authorized by the Central Bank of Kenya: These are ordinary banks, which have the right to engage in mortgage business, and mortgage companies. HFC Limited, which still has a significantly small government interest, is the sole remaining Mortgage Finance Company at present. There are no major differences in the set of laws applying to both sets of institutions and they each compete under relatively fair terms. Overall, the three largest lenders control over half the market (CBK, 2022). The mortgage industry, however, grew 6.8% to Kenya Shillings 261.8 billion in 2022. About 83% of primary mortgage lending was conducted by eight institutions, that is, one medium-sized bank and seven banks from the large banks peer group. The institutions are KCB Bank (30.4%), Stanbic Bank (12.6%), Standard Chartered Bank (8.6%), HFC Limited (8.3%), Absa Bank Kenya (6.9%), NCBA Bank Kenya (6.3%), Co-operative Bank of Kenya (5.2%), and Equity Bank Kenya (4.9%). There has been considerable progress to expand the mortgage reach by the industry. New entrants and insistent marketing have resulted in some newer product offerings. The Kenya Mortgage Refinance Company (KMRC) was licensed in September 2020 to provide long-term funds to Primary Mortgage Lenders (PMLs) for the purpose of increasing the availability of affordable home loans to Kenyans. KMRC is funded through a combination of equity from shareholders and debt from the World Bank and the African Development Bank (AfDB). The number of institutions offering mortgages to customers in Kenya was 32 as at end of 2022 (CBK, 2022).
Statement of the Problem
The mortgage industry in Kenya has witnessed recent entry of banks offering mortgages, almost certainly being attracted by the unexploited potential the industry presents to such institutions. The industry, however, is still largely dominated by just a few out of all commercial banks licensed to offer mortgages to their customers. In 2022, for instance, about eighty three percent of primary mortgage lending was done by eight institutions, that is, one medium-sized bank (8%) and seven banks from the large banks peer group (75%). This has rendered the other players ‘mere spectators’ who are unable to significantly determine the happenings within the industry. All banks operating within this industry have at their disposal at least four competitive strategies of cost leadership, differentiation, focus, and hybrid strategies that can be implemented to achieve competitive advantage over other market players. However, the market has consistently been dominated by just about ten to twenty percent of the players who control over three-quarters of the market (CBK, 2022). Internal bank characteristics such as bank size based on the total mortgage asset base within the industry are premised to determine the extent of success of competitive strategies implemented by the banks. Available literature indicates that no academic research has been conducted to identify the influence of competitive strategies on mortgage performance of commercial banks in Kenya. Instead, such studies have focused on other industries such as insurance, manufacturing, and real estate; with the focal point being identification of strategies employed and their overall effect on performance of organizations. This study, therefore, sought to deviate from this trend and instead attempt to determine the influence of competitive strategies on mortgage performance of banking institutions within the mortgage industry in Kenya whilst also assessing the moderating effect of bank size.
Objectives of the Study
- To examine the influence of cost leadership strategies on mortgage performance of banking institutions within the Mortgage industry in Kenya.
- To establish the moderating effect of bank size on the relationship between cost leadership strategy and mortgage performance of banking institutions within the Mortgage industry in Kenya.
Research Hypotheses
- Cost leadership strategy has no statistically significant influence on mortgage performance of banking institutions within the Mortgage industry in Kenya.
- Bank size has no statistically significant moderating effect on the relationship between cost leadership strategy and mortgage performance of banking institutions within the Mortgage industry in Kenya.
LITERATURE REVIEW
Theoretical Framework
There are two major theoretical models that formed the basis of this study, that is, Porter’s Generic Strategies, and Resource-based view (RBV) of competitive advantage.
Porter’s Generic Strategies Model
Porter explains that an effective organizational strategy should ideally be based on a nucleus thought regarding how an organization can best compete within the industry where it operates. He further proposes the three generic strategies that an organization can implement to outperform other firms in a particular industry. These strategies are called generic because they can be pursued by any type or size of business, even by not-for-profit organizations. These strategies are also referred to business strategies since they focus on improving the competitive position of a company’s or business unit’s products or services within specific industry or market segment that the company or business unit serves. That these strategies provide basic direction for strategic actions and a basis for coordinated and sustained efforts towards achieving business objectives (Johnson et al., 2017).
Porter further contends that any long-term strategies should draw from an organization’s endeavor to seek competitive advantage based on one or the three generic strategies: striving for overall low cost leadership in the industry, striving to produce and promote distinct commodities for diverse consumer groups through differentiation, striving to have special appeal to one or more groups of consumer or industrial buyers, that is, focusing on their cost or differentiation concerns by segmenting the market and focusing on those market segments (Johnson et al., 2017).
Low-cost leadership as a strategy is achieved by excelling at: Cost reduction and efficiencies in designing, producing and marketing comparable products than competitors, maximizing economies of scale, implementing cost cutting technologies, and emphasizing cost decrease especially efficient cost management of overheads and administrative expenses; forestalling of auxiliary consumer accounts and minimizing expenditure in sections reminiscent of research and development (R&D) and sales force. A low-cost leader is able to use its cost advantage to charge lesser prices or enjoy superior profit margins; and thus, the firm can reasonably compete in situations of price wars and attack rivals on price to gain substantial share of the available market. Firms seeking low-cost leadership monitor any low-cost technology that may be developed by a competitor (Porter, 2004).
Resource-Based View (RBV) Model of Competitive Advantage
Strategic capabilities are of value when they provide potential competitive advantage in a market at a cost that allows an organisation to realize acceptable levels of return. Rare capabilities, on the other hand, are those possessed uniquely by one organisation or by a few others. Here competitive advantage might be longer lasting. For example, a company may have patented products or services that give it advantage. Sustainable competitive advantage also involves identifying inimitable capabilities- those that competitors find difficult to copy or acquire. However, an organisation may still be at risk from substitution in the form of product or service or in the form of competence (Barney and Clark, 2007).
In summary and from a resource-based view of organisations, managers need to consider whether their organisation has strategic capabilities to achieve and sustain competitive advantage. To do so they need to consider how and to what extent it has capabilities that reflect the VRIN criteria. Strategic capabilities provide sustainable bases of competitive advantage the more they meet all the four criteria. If such capabilities for competitive advantage do not exist, then managers need to consider if they can be developed (Johnson et al., 2017). The RBV model enriches this study by providing a platform for the researcher to assess the internal competencies and resources that may be useful in the execution of the competitive strategies that form the independent variables as well as the intrinsic effect of the moderating variable in this study.
Empirical Review
Cost leadership as a strategy enables a firm to be a low-cost producer and as such, its profits exceed those of competitors owing to reduced costs of production as well as inherent economies of scale. The strategy manifests itself within an organization vide the invaluable experience gained sustained investment in production, preservation, and keen supervision of costs of operation with a view to enhancing firm performance. Organizations are, therefore, able to comparative advantage through growing of overall turnover and profitability (Pearce and Robinson, 2014). Organisations that seek after cost leadership need to constantly benchmark their cost operations against those of competing firms with the sole objective of gauging their relative cost and profitability standing in a seemingly business-related Centre. Such firms often achieve positions of comfort by putting great emphasis on dynamic cost control measures, efficient record keeping, Research and Development (R&D) and publicity and marketing related campaigns (Porter, 2004).
Low-cost strategy emphasizes organizational efficiency at the very core of its existence. It involves firms developing and implementing systems that enable them to produce and market goods and services at a significantly lower cost than competitors within the same industry. Porter (2004) summarizes that this strategy involves trading with average products blended with insistent pricing. He further argues that it is one of the most guaranteed avenues to achieve sustainable competitive advantage through insistent and effective cost control whether linked to the creation process or otherwise, operative usage of information technology, and economies of scale, all with the sole objective of exceed intended organizational performance for any given trading period (Hisrich et al., 2016).
Implementation of a low-cost leadership strategy presents an organization with the opportunity of gaining a large market share because of the inherent organizational efficiency. Since profit a function of revenue and expenditure, firms can achieve super profits by having the ability to lower their costs, assuming revenues are held constant. The strategy further provides the organization with price leadership, organizational efficiency, expansion as well as improved quality of goods and services (Johnson et al., 2017).
According to Palepu and Healy (2013), organizations may occasionally witness lower profitability resulting from the embracing the low-cost strategy. The strategy actually, however, enables organizations to develop products in great quantities whilst passing on the price benefits to the eventual consumers. Porter (2004) pointed out several challenges that more often than not organizations face in the adoption and implementation of cost leadership. They also identified technological, regulatory, structural, and economic challenges on one hand. Similarly, environmental upheavals related to unforeseen ecological and climatic patterns as challenges facing organizations whose products are produced seasonally.
Cost leadership actually directs its focus to ensuring timely production of goods and services that are needed most by consumers in the most efficient manner. Organizations are, as such, in a position to attain certain economies of scale while offering service to customers through the production and distribution of standardized good and services. Standardization allows firms to further identify various efficient strategies to achieve cost leadership. The focus of any organization seeking cost leadership should, therefore, be to create a balance between cost and value as this ensures the firm competes significantly with other players who also seek to create value to consumers (Pearce and Robinson, 2014).
Centralization of production inputs, commodities, as well as production processes also enables organizations in the twenty first century to achieve low-cost leadership. Cross-functional liaison within an organization, through activities such as demand level scheduling, efficient logistics or warehouse management and materials handling, all collaborate to reduce wastage and improve production efficiency hence ensuring that eventual low cost of commodities availed to consumers. Product quality is, therefore, enhanced through such collaborative internal processes, and the end-result is creation of value that is passed on to consumers and the same translates to competitive advantage in the industry in which the firm operates (Verbeke and Lee, 2021).
Conceptual Framework
The conceptual framework for this study was developed on the basis on the independent variable and the dependent variable as shown in Figure 1. In this study, mortgage performance was conceptualized as being dependent on cost leadership strategy with bank size acting as the moderating variable.
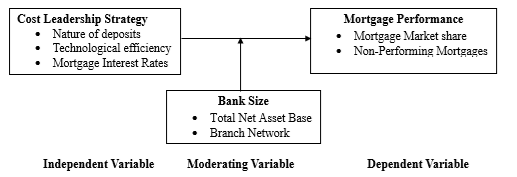
Figure 1: Conceptual Framework for Mortgage Performance
METHODOLOGY
This study opted for a descriptive survey research design, which ensures ease in understanding information concerning the research problem. For this study the target population was, therefore, limited to all the 39 banking institutions that operate in Kenya and are licensed to provide mortgage and related products and services. The institutions are classified into three peer groups using a weighted composite index. The index comprises net assets, customer deposits, capital and reserves, number of deposit accounts and number of loan accounts. A bank with a weighted composite index of 5 percent and above is classified as a large bank. A medium bank has a weighted composite index of between 1 percent and 5 percent while a small bank has a weighted composite index of less than 1 percent. The sampling frame for this study was extracted from the listing of all the 39 banking institutions licensed to operate in Kenya as at 2022. The study broadly used random sampling to develop a study sample from the entire population. Specifically, stratified sampling method was employed to draw a study sample from the target population. The strata were represented by three peer groups, that is, large, medium and small peer groups as classified by the Central Bank of Kenya (CBK). Proportionate sampling strategy was used to further develop the sample. A sample of 30 banking institutions was developed with a proportion of 7,7, and 16 for the respective peer groups. The study proceeded to pick 150 respondents using purposive sampling, that is, 5 respondents per sampled institution. Data was collected using both questionnaires and secondary data collection sheet. The data was analyzed using both descriptive and inferential statistics, which sought the effect of cost leadership on mortgage performance.
RESULTS
Descriptive Statistics
This study set out to establish the influence of cost leadership strategy on mortgage performance of banking institutions within the mortgage industry in Kenya. Three key elements denoting cost leadership in the mortgage sector were considered – mortgage interest rates, nature of deposits, and technological efficiency. The questionnaires required respondents to indicate – on a scale of 1 to 5 (1-Strongly Disagree – SD, 2-Disagree – D, 3-neutral – N, 4-Agree – A, and 5-Strongly Agree – SD) whether their respective banks adopted these strategies. Table 1 indicates varied percentages of responses to the six questions contained in the study questionnaire regarding cost leadership. The results imply that the respondent banks generally adopted the cost leadership strategies indicated with varying magnitudes. The findings thereby concur with studies carried out by Baraza and Arasa (2017) whereby the respondents emphasized organizational efficiency as a key element of cost leadership strategy.
Table 1: Descriptive Statistics for Cost Leadership and Mortgage Performance
| SD | D | N | A | SA | X̄ | S.dev | |
| Deposits held by the bank are always sufficient to cover the entire mortgage asset book | 6.80%
(8) |
11.00%
(13) |
7.60%
(9) |
41.50%
(49) |
33.10%
(39) |
3.69 | 0.984 |
| The bank charges different interest rates for different categories of mortgage borrowers | 9.30%
(11) |
19.50%
(23) |
5.90%
(7) |
39.80%
(47) |
25.40%
(30) |
3.44 | 0.939 |
| The bank has an effective debt recovery structure | 6.80%
(8) |
7.60%
(9) |
5.90%
(7) |
45.80%
(54) |
33.90%
(40) |
4.23 | 0.598 |
| The bank offers attractive interest rates on long term deposits held | 6.80%
(8) |
9.30%
(11) |
5.10%
(6) |
48.30%
(57) |
30.50%
(36) |
4.18 | 0.912 |
| The bank’s customers are able to access their account details using electronic platforms | 4.60%
(5) |
6.80%
(8) |
5.10%
(6) |
46.60%
(55) |
37.30%
(44) |
4.25 | 0.602 |
| The bank has a credit management information system for processing mortgage requests | 5.10%
(6) |
5.10%
(6) |
4.20%
(5) |
51.70%
(61) |
33.90%
(40) |
4.33 | 0.472 |
| Average | 6.50% | 9.90% | 5.60% | 45.60% | 32.40% | 4 | 0.75 |
Bank Size
The study also sought to examine the moderating effect of bank size on the influence of cost leadership strategy on mortgage performance of banking institutions within the mortgage industry in Kenya. Total net asset base was included as a measure in the secondary data collection tool with a view to finding out the respective size parameters. The results concerning the banks’ total net asset base obtained from the secondary data collection sheet with the banks being grouped according to their respective peer groups. A further trend analysis was conducted for the total net asset base of all the industry players for the period from 2016 to 2022 with the results being presented in Table 2. From the results, banks from the large peer group have consistently had the largest net asset base, followed by the medium peer group, and finally the small peer group with the smallest values. In all the three cases, however, the values have been steadily rising over the study period. The large peer group have accounted for between 65 to 76 percent (drawn from values of Kes. 2.404 to 4.971 trillion) from 2016 to 2022 while the small peer group has been responsible for a paltry 8 to 10 percent (drawn from values of Kes. 311 to 665 billion) of the total net assets for the industry over the same period.
Table 2: Total Net Asset Base by Bank Peer Group
| Year | Large Peer Group (Kes. B) | Medium Peer Group (Kes. B) | Small Peer Group (Kes. B) | Totals (Kes. B) |
| 2016 | 2,404
(65%) |
981
(27%) |
311
(8%) |
3,696 |
| 2017 | 2,641
(66%) |
1,053
(26%) |
309
(8%) |
4,003 |
| 2018 | 3,103
(70%) |
929
(21%) |
377
(9%) |
4,409 |
| 2019 | 3,607
(75%) |
805
(17%) |
398
(8%) |
4,810 |
| 2020 | 4,033
(75%) |
910
(17%) |
463
(8%) |
5,406 |
| 2021 | 4,508
(75%) |
968
(16%) |
546
(9%) |
6,022 |
| 2022 | 4,971
(76%) |
954
(14%) |
665
(10%) |
6,590 |
Further results also indicated that there were 1,475 bank branches throughout the country by the end of 2022. These branches were spread throughout all the 47 counties as shown in Appendix IV. Banks in the large peer group had 897 branches countrywide representing 60.81%, Medium peer group banks had 322 branches representing 21.83%, while the small peer group banks had 256 branches that accounted for 17.36%. Table 3 summarizes the aforementioned data.
Table 3: Branch Network in Kenya by Bank Peer Group
| Peer Group | Number of Branches | Percentage of Total (%) |
| Large | 897 | 60.81 |
| Medium | 32 | 21.83 |
| Small | 256 | 17.36 |
| Total | 1,475 | 100.00 |
Mortgage Performance
The study further sought to ascertain mortgage performance of respondent banks in relation to the competitive strategies that they employed. The performance was measured through mortgage market share that each competing bank commanded out of the total value of outstanding mortgages within the mortgage industry in Kenya. The performance of the banks was analyzed by grouping them based on the three peer groups namely; large peer group, medium peer group, and small peer group with respective mortgage book values and percentage of the totals being indicated as the specific parameters measuring mortgage performance. A trend analysis as per Table 4 shows that banks from the large peer group have consistently dominated the market, followed by the medium peer banks while the small peer group banks have commanded the least share of the mortgage market for the period from 2016 to 2022.
Table 4: Outstanding Mortgage Values by Bank Peer Group
| Year | Large Peer Group (Kes. B) | Medium Peer Group (Kes. B) | Small Peer Group (Kes. B) | Totals (Kes. B) |
| 2016 | 129,822
(59%) |
74,879
(34%) |
15,184
(7%) |
219,885 |
| 2017 | 148,203
(66%) |
66,942
(30%) |
8,091
(4%) |
223,236 |
| 2018 | 154,360
(68%) |
60,114
(27%) |
10,407
(5%) |
224,881 |
| 2019 | 165,268
(69%) |
56,415
(24%) |
16,032
(7%) |
237,715 |
| 2020 | 170,957
(74%) |
42,232
(18%) |
19,511
(8%) |
232,700 |
| 2021 | 181,048
(74%) |
49,917
(20%) |
14,175
(6%) |
245,140 |
| 2022 | 201,281
(77%) |
42,192
(16%) |
18,347
(7%) |
261,820 |
The study also sought to assess the trend of Non-performing mortgages loans (NPLs) over the study period. Figure 2 indicates an initial sharp rise in NPLs between 2016 to mid-2018, which was as a result of banks tightening lending conditions as a response to the introduction of interest rate capping in September 2016. There was a plunge in NPLs from 2018 to 2020 owing to improved economic activities and repealing of the interest rate capping. The trend, however, shows a sharp increase in NPLs from 2020 to 2022; this is attributed the adverse effects of COVID-19 on borrowers’ repayment ability, especially those in the Micro, Small and Medium Enterprises (MSME) sector (CBK, 2022).
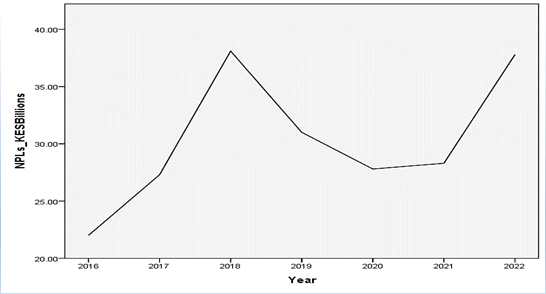
Figure 2: Non-Performing Mortgage Loans Trends in Kenya (2016 to 2022)
Inferential Statistics
The study further proceeded to conduct inferential statistical analysis through correlation analysis, linear regression and moderated regression analysis.
Correlation Analysis for Cost Leadership Strategy and Mortgage Performance
The study used correlation analysis to establish the association between cost leadership strategy and mortgage performance. Pearson correlation coefficient of analysis, which gives a statistic that lies between -1 and +1 was used to determine the strength and direction of the relationship. Table 5 summarizes the results of the correlation test which indicates r=0.421 and p=0.000. This positive r value indicates a reasonable association between cost leadership strategy and mortgage performance. This implies that an increase in the adoption of cost leadership strategy would result in a corresponding increase in mortgage performance.
Table 5: Correlation Analysis for Cost Leadership and Mortgage Performance
| Cost Leadership Strategy | Mortgage Performance | ||
| Cost Leadership Strategy | Pearson Correlation
Sig. (2-tailed) N |
1
118 |
.421**
0.000 118 |
| Mortgage Performance | Pearson Correlation
Sig. (2-tailed) N |
.421**
0.000 118 |
1
118 |
**. Correlation is significant at the 0.01 level (2-tailed).
The findings of this study concur with those of Arasa and Gathanji (2014) who, in their study on the relationship between competitive strategies and organizational performance in the telecommunications industry in Kenya, found out that cost leadership strategy had a positive significant effect on organizational performance. Akpoviroro et al (2019) also explored the link between competitive strategies and organizational performance in the Nigerian beverage industry with a case study of Nestle PLC. The findings indicated a strong positive correlation between cost leadership on organizational performance. Photis (2003), however, conducted a study on competitive strategies and organizational performance in ship management that yielded contradicting results. It concluded that absolute cost leadership does not lead to superior organizational performance.
Linear Regression for Cost Leadership Strategy and Mortgage Performance
The study set out to test the impact of cost leadership strategy on mortgage performance of banking institutions within the mortgage industry in Kenya; this was tested using standard linear regression analysis. The results as summarized in Table 6 indicates the linear correlation coefficient, R=0.421 which implies a moderate positive relationship between cost leadership and performance. The coefficient of determination, R-squared of 0.177 implies that cost leadership explains 17.7% of variability in mortgage performance while the remaining 82.3% is explained by other variables not included in the model.
Table 6: Model Summary for Cost Leadership Strategy
| Model | R | R-Squared | Adjusted R-Squared | Std Error of the Estimate |
| 1 | 0.421a | 0.177 | 0.170 | 0.592 |
- Predictors: (Constant), Cost Leadership Strategy
- Dependent Variable: Mortgage Performance
To test the suitability of the study model in explaining variations in mortgage performance, an F-test was conducted with the resultant ANOVA Table 7 indicating an F-value of 25.010, p-value 0.000 which is <0.05 confirming that the model was a good fit for the data set and sufficiently explains variations in mortgage performance.
Table 7: ANOVA for Cost Leadership Strategy
| Model | Sum of Squares | df | Mean Square | F | P-Value | |
| 1 | Regression
Residual Total |
8.772
40.686 49.458 |
1
116 117 |
8.772
0.351 |
25.010 | 0.000b |
- Dependent Variable: Mortgage Performance
- Predictors: (Constant), Cost Leadership Strategy
The study further conducted a t-test to test the significance of the influence of cost leadership on mortgage performance. The unstandardized regression coefficient β1 and the intercept or slope β0 were considered to test the null hypothesis, which assumes β0 to be zero implying no significant influence of cost leadership on mortgage performance. The linear regression coefficient results were summarized in Table 8. The result show that β0=1.224 which is significantly different from zero, β1=0.543, and p-value = 0.000 which is <0.05, which meant that cost leadership had a statistically significant positive influence on mortgage performance. The interpretation of the β1 value is that for every unit increase in adoption of cost leadership strategies, there would be a corresponding positive change in performance by 0.543 units. From the model Y= β0+ β1X1+ε, (Where Y=Mortgage Performance, β0=constant, β1=regression coefficient, X1 = Cost Leadership Strategy, and ε = Error Term) the study developed the following model:
Mortgage Performance = 1.224 + 0.543 (Cost Leadership Strategy) + 0.243
Table 8: Regression for Cost Leadership Strategy and Mortgage Performance
| Model | β | Std. Error | Beta | t | P-Value | |
| 1 | Constant
Cost Leadership Strategy |
1.224
0.543 |
0.243
0.108 |
0.421 | 5.033
5.001 |
0.000
0.000 |
- Dependent Variable: Mortgage Performance
The findings of this study concur with Muiruri (2020) who conducted a study to assess the relationship between competitive strategies and organizational performance using a case study of Tuskys Retail Supermarkets in Nairobi. The study discovered that cost leadership strategy had a significantly positive effect on organisational performance. Similarly, Pulaj et al (2015) explored the impact of generic competitive strategies on organizational performance in Albania, with the results indicating a strong positive effect of cost leadership on organizational performance. Photis (2003), however, conducted a study on competitive strategies and organizational performance in ship management that yielded contradicting results. It concluded that absolute cost leadership does not lead to superior organizational performance.
Moderated Linear Regression Analysis
This study adopted hierarchical linear regression to test the moderating effect of bank size on the relationship between cost leadership strategy and mortgage performance of banking institutions within the Kenyan mortgage industry. When the interaction term between the moderating and independent variables was added to the model, there was a substantial increase of 0.116 or 11.6 percent as per model 3, that is, adding bank size implies that 29.3% of variability in mortgage performance can be explained by the combined variables independent variables whereas the remaining 70.7% can be explained by other variables not included in the model. Table 9 provides a model summary of the hierarchical model developed.
Table 9: Model Summary
| Model | R | R-Squared | Adjusted R-Squared | Std Error of the Estimate |
| 1 | 0.421a | 0.177 | 0.170 | 0.592 |
| 2 | 0.456b | 0.208 | 0.194 | 0.584 |
| 3 | 0.541c | 0.293 | 0.274 | 0.554 |
- Predictors: (Constant), Cost Leadership Strategy
- Predictors: (Constant), Cost Leadership Strategy, Bank Size
- Predictors: (Constant), Cost Leadership Strategy, Bank Size, Interaction Term
Further, ANOVA was used to test the statistical significance of the moderated regression model. The results indicated that the model was statistically significant at F (3,114) = 15.717, p<0.05. It was, therefore, concluded that the model was a good fit for the data and as such adequate enough to explain the variance in mortgage performance of banking institutions within the Kenyan mortgage industry. The predictor variables moderated by bank size were all statistically significant to predict mortgage performance. The results from the model are presented in Table 10.
Table 10: ANOVA – Moderating Effect of Bank Size
| Model | Sum of Squares | df | Mean Square | F | P-Value | |
| 1 | Regression
Residual Total |
8.772
40.686 49.458 |
1
116 117 |
8.772
0.351 |
25.010 | 0.000b |
| 2 | Regression
Residual Total |
10.281
39.177 49.458 |
2
115 117 |
5.141
0.341 |
15.089 | 0.000c |
| 3 | Regression
Residual Total |
14.471
34.987 49.458 |
3
114 117 |
4.824
0.140 |
15.717 | 0.000d |
- Dependent Variable: Mortgage Performance
- Predictors: Predictors: (Constant), Cost Leadership Strategy
- Predictors: Predictors: (Constant), Cost Leadership Strategy, Bank Size
- Predictors: Predictors: (Constant), Cost Leadership Strategy, Bank Size, Interaction Term
Table 11 presents a summary of the hierarchical moderated linear regression model that tested the moderating effect of bank size on competitive strategies and mortgage performance of banking institutions within the mortgage industry in Kenya. Under model 2, bank size is significantly but negatively correlated with mortgage performance with a beta coefficient of -0.361, which can be attributed to the inherent costs associated with business expansion. Model 3 shows that the interaction term has a significant p-value of 0.000 and a beta coefficient of 0.045 which implies that bank size has a positive and significant moderating effect. These findings concur with those of Mutunga and Owino (2017) who found that firm size moderates the relationship between micro factors and financial performance of manufacturing firms in Kenya. The findings are, however, in contrast with those of Ali et. al. (2016) who concluded that firm size does not moderate the influence of strategic planning dimensions on performance of manufacturing firms in Kenya. The following model was developed from the moderated linear regression: (Where Y=Mortgage Performance, β0=constant, βi=regression coefficient, X = Cost Leadership Strategy, M=Bank Size, XM= interaction term and ε = Error Term)
Y = β0 + β1X + β2M + β3XM + e
Mortgage Performance = -0.416 + 0.993(CL) + 0.984(M) + 0.045(XM) + 0.778
Table 11: Moderated Linear Regression Coefficients
| Model | β | Std. Error | Beta | t | P-Value | |
| 1 | (Constant)
Cost Leadership Strategy |
1.224
0.543 |
0.243
0.108 |
0.421 | 5.033
5.001 |
0.000
0.000 |
| (Constant)
Cost Leadership Strategy Bank Size |
2.005
0.439 -0.361 |
0.442
0.118 0.171 |
0.341
-0.192 |
4.538
3.726 -2.105 |
0.000
0.000 0.037 |
|
| (Constant)
Cost Leadership Strategy Bank Size Interaction Term |
0.416
0.993 0.984 0.045 |
0.778
0.281 0.399 0.012 |
0.982
0.525 -0.839 |
-0.534
4.950 2.469 -3.695 |
0.594
0.000 0.015 0.000 |
|
- Dependent Variable: Mortgage Performance
CONCLUSION
The study objective of this study was to determine the influence of cost leadership strategy on mortgage performance of banks within the mortgage industry in Kenya. Descriptive results indicated that banks, mostly those from the large peer group greatly adopted cost leadership strategies such as acquiring large inexpensive deposits and increased asset base majorly made up of credit facilities. These banks also controlled over 80 percent of the mortgage market in Kenya. Correlation and Linear regression analysis conducted revealed that cost leadership was an important factor in influencing mortgage performance since the calculated p-value was statistically significant. The null hypothesis was, therefore, rejected and the study concluded that there was a significant relationship between cost leadership and mortgage performance. The regression model summary showed that cost leadership explained 17.7% of variability in performance with the other predictor variables held at zero. Further, the resultant model noted that for every unit increase of adoption of cost leadership strategy, mortgage performance increased by a corresponding 0.543 units.
Increased adoption of cost leadership strategy enables banks to gain competitive advantage by exploiting economies of scale to conduct their business in a more efficient and effective manner owing to access to superior resources necessary form improved performance. Banks in the mortgage industry should, therefore, strive to develop large asset bases, efficient cost management and debt recovery structures as well as seek large inexpensive and long-term deposits to fund mortgage lending. The industry regulator, Central Bank of Kenya (CBK), has incessantly been raising the minimum acceptable asset base for mortgage industry players. This has led banks into pursuing strategies aimed at increasing their asset base and in essence, their bank size. This study considered the changes in bank sizes of industry players over the study period and their overall effect on how adoption of cost leadership strategy influences mortgage performance. Bank size was found to have a statistically significant moderating effect during the study period. The individual contribution of the cost leadership strategy was found to be significantly enhanced by increase in bank size. In conclusion, banks should always seek to enhance their bank size in terms of asset base.
RECOMMENDATIONS
This study, based on its findings, recommends that banks in the Kenyan mortgage industry should align their focus more to the adoption of cost leadership since it has consistent positive and significant influence on mortgage performance. Since cost of mortgages is such a key concern for most borrowers, it is imperative that banks within the Kenyan mortgage industry vehemently seek for more inexpensive long-term deposits that support their mortgages, which are long-term in nature. In particular, there is need for more banks to apply to be enjoined in the affordable mortgage programme fronted by the government through the Kenya Mortgage Refinance Company (KMRC). Such moves shall ensure that more banks are able to implement cost leadership strategy that largely depend on economies of scale achievable through large inexpensive deposits.
The Central Bank of Kenya (CBK), on the other hand, should regularly conduct review of not only the prevailing Central Bank Rate (CBR) but also the required asset base for industry players. Strategies such as mergers, joint ventures, takeovers and acquisitions should be supported by CBK in an attempt to give rise to stronger and more influential players in the industry. Such practices, as seen from the study findings, are likely to enhance overall performance of industry players leading to enhanced profitability. The Kenyan government could also consider offering incentives such as tax holidays and cheaper long-term deposits to enable banks pass the concessionary benefits to consumers whilst also improving their overall mortgage performance.
CONTRIBUTION TO THEORY AND EXISTING KNOWLEDGE
The findings of this brought to the fore the importance of competitive strategies in determining firm performance. The evident significant and positive influence of cost leadership strategy on mortgage performance clearly justifies the relevance of both the Resource-Based View (RBV) and Porter’s Generic Strategies Model, which both back firms with superior resources to gain competitive advantage over competitors. Both theories embraced for this study were, as such, viewed to be quite relevant to the mortgage industry in Kenya.
REFERENCES
- Akpoviroro, K.S., Amos, A.O., & Olalekan, A. (2019). Exploring the Link between Competitive Strategies and Organizational Performance in Beverage Industry. (A case of Nestle PLC). Socio Economic Challenges, 3(1), 116-126
- Ali, M.J., Mukulu, E., Kihoro, J.M., & Nzulwa, J.D. (2016). Effect of Firm Size on the Relationship between Strategic Planning Dimensions and Performance of Manufacturing Firms in Kenya. Unpublished PhD Thesis. JKUAT
- Arasa, R., & Gathanji, L. (2014). The relationship between competitive strategies and firm performance: a case of mobile telecommunication companies in Kenya. International Journal of Economics, Commerce and Management. 2 (9), 12-24
- Baraza, D.N., & Arasa, R. (2017). Effect of Competitive Strategies on Performance of Manufacturing Firms in Kenya: A Case study of East African Breweries Limited. International Journal of Economics, Commerce and Management. Vol V(9), 311-328
- Barney, J.B. & Clark, D.N. (2007). Resource-Based Theory: Creating and Sustaining Competitive Advantage, 1st London: Oxford University Press
- Central Bank of Kenya (2022). Bank Supervision Annual Report. Government Press
- Fuster, A. & Vickery, J. (2014). Securitization and the Fixed Mortgage. Federal Reserve Bank of New York Staff Reports, no. 594
- Hisrich, R.D., Peters M.P., & Shepherd D.A. (2016). 10th Edition. Glasgow: McGraw- Hill
- Johnson, G., Scholes, K., & Whittington, R (2017). Exploring Strategy. Texts and Cases. Eleventh Edition. London; Pearson
- Muiruri, B.N. (2020). Relationship between Competitive Strategies and Organizational Performance: A Case of Tuskys Retail Supermarkets in Nairobi, Kenya. Unpublished MBA Research Project, USIU
- Mutunga, D. & Owino E. (2017). Moderating Role of Firm size on the relationship between Micro Factors and Financial Performance of Manufacturing Firms in Kenya. Journal of Finance and Accounting, 1(1), 14 – 27.
- Palepu, K.G. & Healy, P.M. (2013). Business Analysis and Valuation: Using Financial Statements. New South-Western Cengage Learning
- Pearce J., & Robinson R. (2014). Strategic Management: Planning for Domestic and Global Competition. 14th London: McGraw-Hill
- Photis M. P. (2003) Competitive Strategies and Organizational Performance in Ship Management. Maritime Policy & Management, 30(2), 123-140
- Porter, Michael E. (2004). Competitive Advantage: Creating and Sustaining Superior Performance. New York: Free Press
- Pulaj, E., Kume, V., & Cipi, A. (2015). The Impact of Generic Competitive Strategies on Organizational The Evidence from Albanian Context. European Scientific Journal. 11(28). 273- 284
- Simkovic, M. (2019). Competition and Crisis in Mortgage Securitization, Indiana Law Journal, 88(1), 81-90
- Verbeke, A., & Lee, I.H. (2021). International Business Strategy: Rethinking the Foundation of Global Corporate Success. 3rd Edition. London: Cambridge University Press
- World Bank. (2021). Developing Africa’s Mortgage Market. Nairobi; World Bank