
Crop Yield Prediction Using Random Forest Algorithm and Xgboost Machine Learning Model
- Sultan Saiful
- Narendra Bayutama Wibisono
- 1983-1994
- Apr 4, 2025
- Architecture +1 more
Crop Yield Prediction Using Random Forest Algorithm and Xgboost Machine Learning Model
Narendra Bayutama Wibisono, Sultan Saiful*
Department of Business Law, Sekolah Tinggi Ilmu Ekonomi Swadaya, Indonesia
DOI: https://dx.doi.org/10.47772/IJRISS.2025.90300155
Received: 28 February 2025; Accepted: 06 March 2025; Published: 04 April 2025
ABSTRACT
Agricultural productivity is strongly influenced by environmental and climatic factors, requiring robust analytical approaches to evaluate their combined impact. This study examines the relationship between food production, biodiversity, and weather patterns across temperate heterogeneous agricultural landscapes in Switzerland. The dataset integrates crop yield, farm characteristics (area, altitude, crop category, and crop type), and 11 climate indices sourced from the European Climate Assessment & Dataset (ECA&D). These indices include temperature variations, precipitation levels, humidity, sunshine duration, and seasonal extremes across four major seasonal subcategories.
To model these relationships, we applied machine learning techniques, comparing Random Forest and XGBoost algorithms to analyze their predictive performance. To calculate the model accuracy, we use 3 model evaluation metrics, including R², Mean Squared Error (MSE), and Root Mean Squared Error (RMSE). The results shows that Random Forest outperforms XGBoost with slightly higher R² score (0.9589 vs. 0.9568) and lower MSE (908.80 vs. 956.48). These findings highlight the potential of learning methods in predicting agricultural outcomes and assessing climate impact on crop yield.
Keywords: Crop Yield Prediction, Random Forest Model, XG Boost Model, Weather Indices and Crop Growth, Machine Learning in Agriculture
INTRODUCTION
Forecasting using Machine Learning approaches are used in many areas, from business revenues forecast (Lei & Cailan, 2021) to customers retention or churn predictions (Shobana, et. Al., 2023). To this date, agricultural yield forecasts is one of the most challenging machine learning tasks that have been studied and validated in many models so far. For instances Crop yield prediction using machine learning (Reddy & Kumar, 2021) in A systematic literature review on various journals on the study of Machine Learning utilization to predict crop yield has revealed that their selected publications used a variety of features, depending on the research scope and the data availability. Each journal analyzes yield prediction with machine learning but differs from the features. The studies also differ in participants scale, geological location, and crop types. The feature options is dependent on the dataset availability and the research purpose. Research also found that models with more features did not always shows the best performance for the yield prediction. To look for the best performing model, both models with more and less features must be included in the trials. Many algorithms have been tested in various studies. The results explained that there are no specific result to conclude what the best model is, but they clearly proves that some machine learning models are used more often compared to the others. The most tested models are the linear regression, gradient boosting tree, random forest, and neural networks. Most of the research utilized various machine learning models to find which model could predict the best.
In terms of the features and target selection, there have been so many factors selected as the features for predicting crop yield. In some traditional ways, crop growth models have been studied to simulate and predict crop production in different scenarios including soil profile, climate, management factors, and genotype (Blank, 2017). These gives a reasonable explanation on biophysical mechanisms and responses but have deficiencies related to input parameter estimation and predicting complex and outlier factors (Roberts, Braun, Sinclair, Lobell & Schlenker, 2017). Previous study at yield forecast across environments relied heavily on crop models generated by quantified responses in a limited number of lines while transforming a single environmental variable, limiting the inference coverage (Bishop, Leakey, Ainsworth, 2014). To bypass the limitations of crop growth models, linear regression models have also been utilized to predict crop yield with limited success (Westcott & Jewison, 2013). Unfortunately, these low-capacity models commonly rely on a rather small subset of factors, so it failed to capture the complexity of biological process and site-specific weather factors complexities (Shook, Gangopadhyay, Wu, Ganapathysubramanian, Sarkar, & Singh, 2021). Traditional linear methods like Autoregressive Integrated Moving Average (ARIMA) have also been used for time series forecasting problems (Alam, Sinha, Kumar, Ray, Rathod, Singh, & Arya, 2018), but these methods are effective in predicting future events in the same time-series. Considering the importance of climate extremes for agricultural predictions (Petrica, Stancu, & Tindeche, 2016.
Another approach, known as Long Short-Term Memory (LSTM) networks, is highly effective for time series modelling because it can capture long-range temporal dependencies in complex multivariate sequences (Malhotra, Vig, Shroff, & Agarwal, 2015). LSTMs have achieved cutting-edge performance in several domains, such as offline handwriting recognition (Doetsch, Kozielski, Ney, & 2014), natural language processing (Sutskever, Vinyals, Le, & 2014) and engineering systems (Gangopadhya, Locurto, Michael, & Sarkar, 2020). They have also been successfully applied to multivariate time series forecasting tasks (Gangopadhyay, Tan, Huang, & Sarkar, 2018) . Additionally, LSTM-based models have been utilized for estimating corn yield (Jiang, Hu, Zhong, Xu, & Huang, 2019). However, these models often lack interpretability and rely on geospatial data without detailed field-level farming management information. Moreover, they lack temporal resolution when daily weather data is unavailable.
As an initiative for solving these limitation of analysis weather and climate roles on predicting crop yields, one simple study has been conducted by Kumar, Spandana, Vaishnavi, Neha, & Devi (2020) that includes 5 parameters or features from weather aspects like the temperature, ph., humidity, rainfall and crop name. This study involves 2 machine learning methods, the Random Forest Algorithm and Decision Tree Classifiers. The result shows significant correlation between the Features and Unfortunately it still lack of interpretations for each of the relationship between Features and the crop yield.
One more study about the effects of climate extremes on global agricultural yields across North America, Asia, and Europe also conducted on 2019. It was concluded that Random Forest Regression model has the ability to create an accurate model with reasonable R2 scores for measuring similarity between test and predicted data of crop yield based on the 10 different weather predictors variables. After all of these Machine Learning methods that have been previously used in crop yield studies, there are still a small numbers of research that study the effectiveness of XG Boost method, despite of the popularity for its high accuracy, ability for handling missing data, and most suitability for structured/tabular data.
MATERIAL AND METHODS
The dataset consists of 45 features and 1 target which is the crop yield data of various crop farms in Switzerland. The dataset was extracted from 2 sources, one from a previous study about Food Production and Biodiversity relationship with temperate heterogeneous agricultural landscapes in Switzerland (Zingg, Grenz, & Humbert, 2024). From this first source we extracted 5 variables including the crop yield, farm area (in hectare), altitude, crop category, and crop type. While the second source was the European Climate Assessment & Dataset (ecad.eu) where we extracted 11 different weather indexes data across Europe. These indexes include cloud, number of consecutive dry days, growing season length, humidity, mean of daily temperature, number of moderate wet days, number of snow days, number of warm days, sum of precipitation, sunshine duration, and warm-wet days ratio. Each of these 11 indexes have various number of sub-indexes, but due to the efficiency of the process we only selected scores from 4 major sub-indexes of 4 seasons in a year (winter, spring, summer, and autumn).
The data then pre-processed using Microsoft Excel, Python, and PostgreSQL for compiling 2 different datasets. First, we match each of the crop farm locations with the nearest European Climate Assessment stations across Switzerland so we could get the most similar weather profile report that represents the actual climate conditions of each crop farms. In total there are 3414 farms crop and weather data for year 2014 to 2016 compiled across Switzerland.
To proceed, we handle missing values using Random Forest Regressor iteravite imputer in Python. Furthermore, Random Forest Regressor and XG Boost are also chosen as the Machine Learning Models to run the weather-crop yield prediction as both are known for their robustness and high accuracy for handling moderate-sized data. All the analysis were executed using Python sklearn modules.
Model Predictors and Variables
Table I Model Features and Targets
| Name | Units | Details |
| Crop Yield | tons/hectare | The total production of crops per hectare of land. Extracted from the first data source. |
| Farm Area | hectares | The total area of the farm from which the crop yield was measured. Extracted from the first data source. |
| Altitude | meters (m) | The elevation of the farmland above sea level. Extracted from the first data source. |
| Crop Category | categorical | The broad classification of the crop type, such as cereals, vegetables, or fruits. Extracted from the first data source. |
| Crop Type | categorical | The specific crop type such as wheat, barley, or maize. Extracted from the first data source. |
| Cloud Cover | percentage (%) | The amount of cloud cover in a given season. Extracted from the second data source. |
| Consecutive Dry Days | days | The number of consecutive days without precipitation per season. Extracted from the second data source. |
| Growing Season Length | days | The total number of days in a year suitable for plant growth. Extracted from the second data source. |
| Humidity | percentage (%) | The average humidity level per season. Extracted from the second data source. |
| Mean Daily Temperature | °C | The average daily temperature per season. Extracted from the second data source. |
| Moderate Wet Days | days | The number of days per season with moderate precipitation. Extracted from the second data source. |
| Snow Days | days | The number of days per season with snowfall. Extracted from the second data source. |
| Warm Days | days | The number of days per season classified as warm. Extracted from the second data source. |
| Sum of Precipitation | mm | The total precipitation received per season. Extracted from the second data source. |
| Sunshine Duration | hours | The total number of sunshine hours per season. Extracted from the second data source. |
| Warm-Wet Days Ratio | ratio | The proportion of warm days that are also wet, measured per season. Extracted from the second data source. |
Random Forest Algorithm
The Random Forest algorithm is a machine learning method that constructs multiple decision trees from a dataset. It is commonly used for both classification and regression tasks due to its ability to handle missing and noisy data effectively. The algorithm operates in two primary stages (Polamuri, 2017):
- Construction of the Random Forest
- Prediction of test data using the trained Random Forest model
Construction of the Random Forest
The process of building a Random Forest involves the following steps:
- Randomly select a subset of x features from the total set of z features, where x << z.
- Determine the optimal split point for node f based on the selected x features.
iii. Partition the node into two child nodes using the best available split criterion.
- Repeat steps (i) to (iii) iteratively until the tree reaches l nodes.
- Construct the final forest by repeating steps (i) to (iv) y times, generating y individual trees.
The algorithm begins by randomly selecting x features from the total z available features. A root node is then established using the best division strategy based on a randomly chosen subset of k features. This process continues by applying the same best-split criterion to generate child nodes. The tree continues to grow until it reaches its maximum depth, forming a fully developed decision tree with root and leaf nodes. Finally, this process is repeated y times to generate y randomly constructed decision trees, collectively forming the Random Forest model (Ravi & Baranidharan, 2020).
Random Forest Prediction
Once the Random Forest is trained, predictions can be made using the following steps:
- Select the test sample and pass it through each decision tree in the forest.
- Each decision tree provides an independent prediction.
- Aggregate the predictions by averaging (for regression).
- he final predicted output is taken as the mean value of all predictions.
For instance, if a Random Forest consists of 100 decision trees predicting three different target classes (A, B, and C), each tree will contribute a single prediction. The final prediction is determined by majority voting, meaning the class that receives the highest number of votes among the 100 trees is selected as the final output. If 60 out of 100 trees predict class A, then class A is returned as the final prediction (Ravi & Baranidharan, 2020).
The fundamental principle behind the voting mechanism is to leverage the wisdom of crowds, ensuring robust and generalized predictions. The Random Forest model improves overall accuracy and reduces overfitting by combining multiple independent decision trees. Each tree provides an individual prediction, and the final model aggregates these predictions to deliver a more stable and reliable result (Ravi & Baranidharan, 2020)
Extreme Gradient Boosting
In this study, the Extreme Gradient Boosting (XG Boost) model was utilized to predict yield, employing the same factors as Random Forest Regressor to facilitate comparison of yield predictions across the sample area. XG Boost learns from parameters similarly to the regression tree family approach. The model is based on the gradient descent direction of the loss function from the most recently established model (Wang et al., 2021), as illustrated in the following equation:
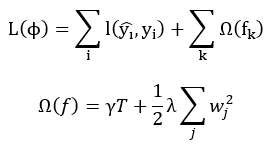
Where as: (ŷ𝑖 , y𝑖 ) = Training loss,
Ω(𝑓𝑘 ) = The complexity of trees
𝑓𝑘 = The regression trees
𝑇 = The number of leaves in the tree
𝑤j = The score of the regression tree node
γ and λ = regularization parameters.
Level of Significance of Features in Model Affecting Sample Field’s Crop Yields
The importance of each feature was determined using the model’s feature importance metric, which quantifies the contribution of each variable to the predictive accuracy of crop yield estimations.
Model Performance Evaluation and Inter-Comparison
Three methods were used to evaluate and compare the model performances: 1) mean squared error (MSE), 2) Root Mean Squared Error (RMSE), 3) and R-Squared (R2). In addition, an observed vs. predicted plot was made to visualize the model performance. To evaluate the accuracy of the model predictions, a simple linear regression line was fitted to the plot for comparison. Performance metrics, including Mean Squared Error (MSE), Root Mean Squared Error (RMSE), and the coefficient of determination (R²), were computed based solely on predictions from test datasets that were reserved for validation and evaluation. Notably, no training data were utilized in the assessment of model performance.
RESULT
Feature Importance
Table II provides the ranked significance of the features influencing crop yield predictions in the sample field. The results indicate that the crop category is the most influential factor, followed by crop type, altitude, and cultivated area. Seasonal climatic conditions, including autumn consecutive dry days, spring moderate wet days, and winter precipitation, have relatively minor impacts.
Table II Level Of Significance of Factors in Random Forest Model Affecting Sample Field’s Crop Yields
| Column Number | Feature | Importance |
| 42 | crop_category | 0.809300 |
| 41 | crop | 0.100585 |
| 43 | altitude | 0.049259 |
| 44 | area_ha | 0.025320 |
| 7 | autumn_consecutive dry days | 0.001732 |
| 17 | spring_number of moderate wet days | 0.001532 |
| 28 | winter_sum of precipitation | 0.000772 |
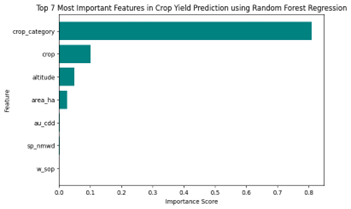
Fig. 1 Top 7 most important features in crop yield prediction using Random Forest Regression
Dominant Influence of Crop Category: The model suggests that the type of crop grown is the most significant determinant of yield, contributing over 80% to the model’s predictive power.
Moderate Impact of Crop Type and Geographical Factors: The specific crop type, altitude, and cultivated area have lower but notable contributions, collectively accounting for approximately 17.5% of feature importance.
Minimal Influence of Seasonal Climate Variables: The number of dry and wet days, as well as total precipitation in winter, have negligible impacts on yield variation, indicating that climate conditions in isolation may not be strong predictors when compared to crop-related factors.
Table III Level Of Significance of Factors in Xgboost Model Affecting Sample Field’s Crop Yields
| Column Number | Feature | Importance |
| 42 | crop_category | 0.700035 |
| 21 | Spring_number of snow days | 0.107521 |
| 41 | crop | 0.067881 |
| 43 | altitude | 0.016759 |
| 7 | autumn_consecutive dry days | 0.014522 |
| 2 | summer_cloud | 0.012704 |
| 26 | summer_number of wet days | 0.011569 |
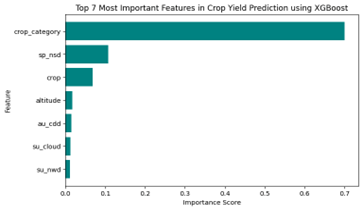
Fig. 2 Top 7 most important features in crop yield prediction using XG Boost
Table III ranks the significance of the features influencing crop yields. The results suggest that crop category remains the most dominant factor, followed by spring snow days and crop type. Climate and weather factors such as consecutive dry days in autumn, cloud coverage in summer and wet days in summer have smaller but notable impacts.
Dominant Influence of Crop Category: Crop category remains the most significant factor, achieving 70% of the feature importance, strengthen the previous findings that selected crop category has a critical role in determining yield.
Impact of Seasonal Snow Days: The number of snow days in spring recorded as the second most influential factor, suggesting a potential relationship between the number of snow appearance in spring and crop yield.
Moderate Influence of Crop Type and Altitude: Crop type contributes approximately 6.8%, while altitude has a smaller impact (1.67%).
Weather Variables Play a Lesser Role: Features such as autumn consecutive dry days, summer cloud cover, and summer wet days have minimal but still measurable effects on crop yield predictions. In terms of Model comparison between Random Forest and XG Boost, XG Boost have shown better involvements in weather variables on affecting crop yields.
Table IV Prediction of Crop Yields of 20 Plots in Sample Fields by Random Forest Regression
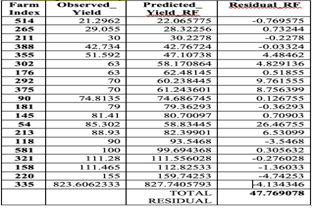
Fig. 3 Prediction 20 crop yield samples of Random Forest model
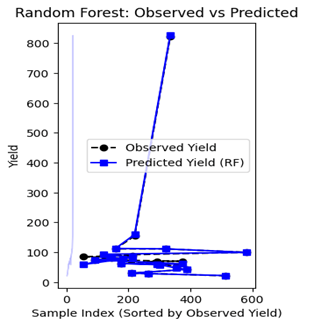
Table IV presents the observed yields, predicted yields, and residuals for each farm index. The results indicate that the Random Forest model performed well in most cases, with relatively small residuals, suggesting a high degree of predictive accuracy. However, certain plots exhibited larger discrepancies between observed and predicted values.
- The highest positive residual was observed for farm index 54, with a deviation of 26.46755, indicating an underestimation by the model.
- The highest negative residual was recorded for farm index 118, where the model overestimated the yield by 3.5468.
- The total residual across all predictions summed to 47.769078, demonstrating a reasonable predictive performance overall.
Despite some variations, the Random Forest model effectively captured the trends in crop yields. The observed deviations could be attributed to environmental factors not captured in the dataset or potential limitations in model generalization.
Table V Prediction of Crop Yields of 20 Plots in Sample Fields by Extreme Gradient Boosting (Xg boost)
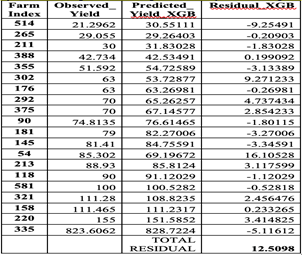
Fig. 4 Prediction 20 crop yield samples of XG Boost model
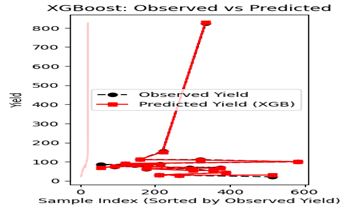
The observed crop yields, predicted yields, and residuals for the 20 sample plots are summarized in Table 5 and linear visualization above. The results indicate that the XG Boost model generally performed well in predicting crop yields, with some variations across different plots. The total discrepancy of 12.5098 suggests that the model’s predictions is pretty close to the observed values. Unfortunately, significant deviations were detected in several plots, such as farm index 514, where the gap was -9.25491, and farm index 54, where the gap was 16.10528. These differences may be caused by variations in environmental conditions, soil quality, or other influencing factors not assessed in the model.
Fig. 5 R²: – Comparison of R2
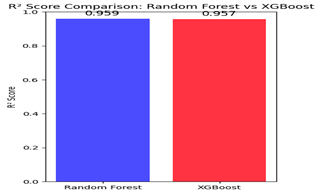
Figure 5 presents a comparison of the R² values obtained from five different algorithms applied to the collected dataset. The R² value represents each model’s predictive accuracy. In this trial, the Random Forest algorithm achieved an R² value of 0.958968, or an accuracy level of 95.89% in predicting crop yields. Similarly, the XG Boost algorithm recorded an R² value of 0.956815, indicating an accuracy of 95.68%. In general, a greater R² value represents higher predictive accuracy for a the model. Based on these findings, the Random Forest algorithm demonstrated higher R² value, suggesting it is the most effective model for crop yield prediction. Unfortunately, we should also remember that both models are showing signs of over fitting, which may affect their generalization ability to new datasets.
Fig. 6 Comparison of Root Mean Squared Error (RMSE)
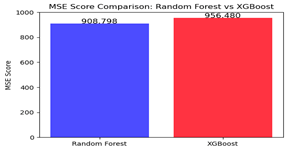
The above Figure 6 illustrates a comparison of the Mean Squared Error (MSE) values for the two models. A lower MSE score indicates higher model accuracy, as it represents the average squared difference between observed and predicted values. The MSE for the Random Forest model is 908.7979, while the XG Boost model has a little higher MSE of 956.4798. Therefore these results indicate that Random Forest outperforms XG Boost in terms of error minimization, making it the preferable model for crop yield prediction.
Fig. 7 Comparison of Root Mean Squared Error (RMSE)
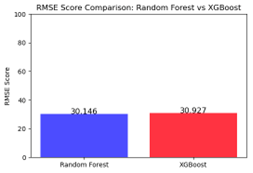
The above Figure 7 explains a comparison of the Root Mean Squared Error (RMSE) scores for the two algorithms. RMSE calculates the average magnitude of errors in prediction, with lower values means better model performance. RMSE score for the Random Forest model is 30.14628, while the XGBoost model has an RMSE of 30.92701. Since lower RMSE represents more acurate model with smaller deviations from actual values, these results suggest that the Random Forest model performs slightly better than XGBoost in terms of predictive accuracy.
Table VI Summary of Model Performance Evaluation and Inter-Comparison
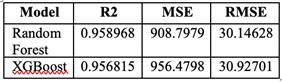
Lastly, to maximize the accuracy measurement for each model, both models result was assessed using R2, Mean Squared Error, and Root Mean Squared Error. These are more accurate methods to represents the models performance since they calculate all of the results. The findings indicate that the Extreme Gradient Boosting (XGBoost) model provided a valid prediction of rice yield, achieving an R² value of 0.956815, a Mean Absolute Error (MAE) of 956.479, and a Root Mean Square Error (RMSE) of 30.927, as illustrated in Figure 8 and Table 5. However, when utilizing the Random Forest model, the predicted rice yield exhibited a higher level of accuracy. This outcome can be attributed to the fact that XGBoost, as a member of the regression tree family. Therefore, XGBoost learned from the model parameters and stopped when done to solve the overfitting problem of the results. In contrast, Random Forest is a machine learning technique that constructs multiple decision trees during training, combining their predictions to enhance accuracy and mitigate overfitting. As proven in the table above, Random Forest Models has R2 score of 0.9589, Mean Absolute Error (MAE) of 908.7979 , and a Root Mean Square Error (RMSE) of 30.146. Both smaller MAE and RMSE in Random Forest models explains that Random Forest models can produce smaller errors compared to XGBoost. But unfortunately for overfitting issues, it was proven that both Random and XGBoost were experiencing this problem, and Random Forest seems worse in this case with slightly higher R2 value to almost 1.
CONCLUSIONS
This study assessed the performance of Random Forest Regression and XGBoost model in predicting crop yields. The analysis was conducted based on key performance metrics, including R², Mean Squared Error (MSE), and Root Mean Squared Error (RMSE). The results shows that both Random Forest and XGBoost achieved high predictive accuracy, with R² values of 0.958968 and 0.956815 respectively. These values suggest that both models explain over 95% of the variance in crop yield predictions.
In terms of error metrics, the Random Forest model demonstrated the lowest MSE (908.7979) and RMSE (30.14628), compared to XGBoost, which had an MSE of 956.4798 and RMSE of 30.92701. Since lower MSE and RMSE values indicate more precise predictions with smaller deviations from actual values, the Random Forest model outperformed XGBoost in this study.
Although both models exhibited strong predictive capabilities, Random Forest showed slightly better accuracy while also being more prone to overfitting, as observed in certain cases. On the other hand, XGBoost, despite having a slightly higher error rate, remains a robust alternative due to its ability to handle complex relationships and reduce variance.
Overall, based on the findings, Random Forest is identified as the most effective model for predicting crop yields in this dataset. However, future studies should explore additional hyperparameter tuning, feature engineering, and larger datasets to further improve model performance and generalizability.
Other limitations should be improved in further research is to study deeper about the low significance of weather features in predicting crop yield. In this research findings, XGBoost model found that number of snow days during spring season has achieve a pretty high significance compared to all other features except crop category, and this could be analyzed deeper by other researcher. The last point could be improved is to break down the study on analyzing the correlation between categories in each features on contributing the number of crop yield in each farms, for example in crop category in crop_categories feature has the most significant impact on increasing crop yield, or which crop type in crop feature has the most significant impact on lower the corp yield in some specified farms.
REFERENCES
- Alam, W., Sinha, K., Kumar, R. R., Ray, M., Rathod, S., Singh, K. N., & Arya, P. (2018). Hybrid linear time series approach for long-term forecasting of crop yield. Indian Journal of Agricultural Sciences, 88, 1275-1279.
- Bishop, K. A., Leakey, A. D., & Ainsworth, E. A. (2014). How seasonal temperature or water inputs affect the relative response of C3 crops to elevated [CO2]: A global analysis of open-top chamber and free-air CO2 enrichment studies. Food and Energy Security, 3(1), 33–45. https://doi.org/10.1002/fes3.44
- Blanc, É. (2017). Statistical emulators of maize, rice, soybean, and wheat yields from global gridded crop models. Agricultural and Forest Meteorology, 236, 145–161. https://doi.org/10.1016/j.agrformet.2016.12.022
- Doetsch, P., Kozielski, M., & Ney, H. (2014). Fast and robust training of recurrent neural networks for offline handwriting recognition. Frontiers in Handwriting Recognition (ICFHR), 2014 14th International Conference on, 279–284. IEEE.
- Everingham, Y., Sexton, J., Skocaj, D., & Inman-Bamber, G. (2016). Accurate prediction of sugarcane yield using a random forest algorithm. Agronomy for Sustainable Development, 36, 1–9.
- Gangopadhyay, T., Locurto, A., Michael, J. B., & Sarkar, S. (2020). Deep learning algorithms for detecting combustion instabilities. In Dynamics and Control of Energy Systems (pp. 283–300). Springer.
- Gangopadhyay, T., Tan, S. Y., Huang, G., & Sarkar, S. (2018). Temporal attention and stacked LSTMs for multivariate time series prediction. NeurIPS 2018 Workshop on Modeling and Decision-Making in the Spatio-temporal Domain. NeurIPS.
- Jiang, H., Hu, H., Zhong, R., Xu, J., Xu, J., Huang, J., et al. (2019). A deep learning approach to conflating heterogeneous geospatial data for corn yield estimation: A case study of the US Corn Belt at the county level. Global Change Biology.
- Jiang, Z., Liu, C., Hendricks, N. P., Ganapathysubramanian, B., Hayes, D. J., & Sarkar, S. (2018). Predicting county-level corn yields using deep long short-term memory models. arXiv preprint arXiv:180512044.
- Kumar, Y. J. N., Spandana, V., Vaishnavi, V. S., Neha, K., & Devi, V. G. R. R. (2020, June). Supervised machine learning approach for crop yield prediction in the agriculture sector. 2020 5th International Conference on Communication and Electronics Systems (ICCES), 736–741. IEEE.
- Lei, H., & Cailan, H. (2021, January). Comparison of multiple machine learning models based on enterprise revenue forecasting. 2021 Asia-Pacific Conference on Communications Technology and Computer Science (ACCTCS), 354–359. IEEE.
- Malhotra, P., Vig, L., Shroff, G., & Agarwal, P. (2015). Long short-term memory networks for anomaly detection in time series. European Symposium on Artificial Neural Networks, Computational Intelligence and Machine Learning, 89.
- Petrică, A. C., Stancu, S., & Tindeche, A. (2016). Limitation of ARIMA models in financial and monetary economics. Theoretical & Applied Economics, 23(4).
- Polamuri, S. (2017). How the random forest algorithm works in machine learning. Retrieved February 24. https://dataaspirant.com/2017/05/22/random-forest-algorithm-machine-learning/
- Ravi, R., & Baranidharan, B. (2020). Crop yield prediction using XGBoost algorithm. International Journal of Recent Technology and Engineering, 8(5), 3516–3520.
- Reddy, D. J., & Kumar, M. R. (2021, May). Crop yield prediction using a machine learning algorithm. 2021 5th International Conference on Intelligent Computing and Control Systems (ICICCS), 1466–1470. IEEE.
- Roberts, M. J., Braun, N. O., Sinclair, T. R., Lobell, D. B., & Schlenker, W. (2017). Comparing and combining process-based crop models and statistical models with some implications for climate change. Environmental Research Letters, 12(9), 095010. https://doi.org/10.1088/1748-9326/aa7f33
- Shobana, J., Gangadhar, C., Arora, R. K., Renjith, P. N., Bamini, J., & Chincholkar, Y. D. (2023). E-commerce customer churn prevention using a machine learning-based business intelligence strategy. Measurement: Sensors, 27, 100728.
- Shook, J. M., Gangopadhyay, T., Wu, L., Ganapathysubramanian, B., Sarkar, S., & Singh, A. K. (2021). Crop yield prediction integrating genotype and weather variables using deep learning. PLoS ONE, 16(6), e0252402.
- Shook, J. M., Wu, L., Gangopadhyay, T., Ganapathysubramanian, B., Sarkar, S., & Singh, A. K. (2018). Integrating genotype and weather variables for soybean yield prediction using deep learning. bioRxiv, 331561.
- Sutskever, I., Vinyals, O., & Le, Q. V. (2014). Sequence to sequence learning with neural networks. Advances in Neural Information Processing Systems, 3104–3112.
- Vogel, E., Donat, M. G., Alexander, L. V., Meinshausen, M., Ray, D. K., Karoly, D., et al. (2019). The effects of climate extremes on global agricultural yields. Environmental Research Letters, 14(5), 054010. https://doi.org/10.1088/1748-9326/ab154b
- Wang, J., Wu, B., Kohnen, M., Lin, D., Yang, C., Wang, X., Qiang, A., Liu, W., Kang, J., Li, H., Shen, J., Yao, T., Su, J., Li, B., & Gu, L. (2021). Classification of rice yield using UAV-based hyperspectral imagery and lodging feature. Plant Phenomics, 2021, 1–14. https://doi.org/10.34133/2021/9765952
- Westcott, P. C., & Jewison, M. (2013). Weather effects on expected corn and soybean yields. USDA ERS, FDS-13g-01.
- Zingg, S., Grenz, J., & Humbert, J. Y. (2024). Food production and biodiversity.