
Determination of the Precision of Quantitative Measurement Methods at Machakos County, Kenya.
- Charles Kyalo Mutie
- Scholastica Gatwiri Mathenge
- Peterson Warutere
- 756-771
- May 27, 2024
- Chemistry
Determination of the Precision of Quantitative Measurement Methods at Machakos County, Kenya.
Charles Kyalo Mutie, Scholastica Gatwiri Mathenge, Peterson Warutere
Kenyatta University
DOI: https://dx.doi.org/10.47772/IJRISS.2024.803050S
Received: 07 April 2024; Accepted: 26 April 2024; Published: 27 May 2024
ABSTRACT
Introduction: Measurement precision is the consistency of indications obtained as a result of repeat measurements on similar or the same objects, it gives information related to the method’s reproducibility. Precision is a crucial aspect of the method verification process. The study aimed to determine the precision of the quantitative measurement methods in the Clinical Chemistry laboratory through a systematic review and meta-analysis at Machakos County, Kenya.
Methods: Internal quality control material (IQC) and pooled patientserum samples were used to measure precision. The IQC material and pooled serum samples both met the criteria for pathological and normal values.A purposive sampling technique was used, where Roche Cobas® Integra 400 Clinical Chemistry analyser was used to perform a comparative descriptive analysis, following guidance by the Clinical Laboratory Improvements Amendment 1988 (CLIA) and the Clinical Laboratory Standards Institute (CLSI). Data analysis was carried out using Excel Windows 10 MS Office 2021.The coefficient of Variation (CV) % was calculated from the obtained results mean and standard deviation and compared to manufacturers’ CV % and published CV %.
Results: Short-term precision -All analytes’ control levels except Chloride (PCC1) met CLIA target coefficient of variation (CV) %. Fifteen (15)analyte levels met the manufacturer’srecommended CV %, and eleven (11) failed. Long-term precision – Ten (10) analytes for both control levels passed the target CLIA CV %. Three analytes (Chloride, Potassium and Urea)both control levels failed to achieve the target CV%. All thirteen analytes control levels (PCC1 & PCC2) failed to achieve the manufacturer’s recommended CV %.
Discussion: The failure in achieving the target coefficient of variation (CV) for some analytes is attributed to instrument inaccurate calibration, variation or performance, sample handling/ processing, analytical techniques, environmental factors, reagent stability, interfering substances, quality control measures, and matrix effect. Address these factors through proper training of personnel, regular maintenance and calibration of instruments, stringent adherence to standard operating procedures, evaluation of reagent quality and robust quality control measures can help mitigate variability and improve the precision and repeatability of assay results.
Conclusions: The performance of precision studies was average(i) Short-term precision – All analytes except one met CLIA target CV% and most met manufacturers set CV%. (ii) Long-term precision –Twenty out of twenty-six analytes’ levels met CLIA target CV% and all analytes failed to meet manufacturers target CV%.
Keywords: Short-term precision, Long-term precision, Method verification, within run, between run, Quality control, Coefficient of variation; Mean, Standard deviation, Total error, total error allowable, Metrology.
INTRODUCTION
To monitor and control production processes, industries use metrology, standardization, and conformity assessment. An integral part of quality infrastructure is metrology supervision, accreditation and traceability assurance (1).
These organizations work to standardize measurements across a variety of industries, and approval of kind and verification processes are used utilizing legal metrology to ensure that measuring instruments meet the standards (1).
The essence of accreditation is to deliver credible and generalizable analytical laboratory results which are central to accurate diagnosis therefore medical laboratories should embrace accreditation bythe Internal Organization for Standardization (ISO) 15189. Clinical decision-making is estimated to be influenced by medical laboratory results by up to 70% (2). Verification in a medical laboratory is a method of ensuring that tests are carried out per the manufacturer’s specifications when tested by laboratory staff at the facility. Elements of verification include accuracy, precision, reference range and linearity verified concurrently with reportable range, Uncertainty of measurement, and carry-over studies.
Methods which have been validated by the manufacturer must have their accuracy and precision verified by the end user (3, 4). Verification is the process of proving that certain requirements have been met, whereas validation is the process of proving that those requirements have been met for the intended use, as defined in the International Vocabulary of Metrology 3 (VIM 3). Nevertheless, verification of the system performance characteristics must be carried out before carrying out a test for any patients (5).
Quantitative methods in Clinical Chemistry require the following set of verification parameters to be determined: accuracy, precision, linearity and analytical measurement range (AMR)/ Clinical reportable range (6). Other parameters which may be measured include uncertainty of measurement, carry-over studies, reference ranges and limit of detection (7). However, there is no set of verification parameters and the number of verification procedures needed which are internationally agreed upon standards. Accreditation bodies, such as KENAS, SANAS, and CAP, as well as professional bodies, such as CLSI and instrument manufacturers/method developers, guide verification protocols followed by Kenyan laboratories (8).
Methods to validate and verify measurement are procedures which, ascertain realistic expectations from analysts and the end user that the method is fit for their intended purpose, are used. Validation of any analytical method will help to ensure the reliable results that are needed to make good decisions on dosing and patient safety.
Following ISO 15189, ISO 17025 or other similar quality systems, clinical laboratories are becoming increasingly accredited or certified respectively. Accordingly, for validation, these laboratories are required to adopt acceptable and cost-effective protocols. In principle, there is no limit to the scope of validation and verification procedures. However, time and economic constraints exist in practice. Therefore, it’s crucial to optimize validation and verification efforts to get the most value out of your resources (9).
The existing guidelines on terminology and bioanalytical validation methodologies have been incorporated into this overview of validation and verification methods in Clinical Chemistry. The likelihood of overstating some features, such as verification processes and fitness tests for purpose studies, can be explained by the author’s expertise in basic research and lab medicine. The need for agreement on reasonable but sufficient methods to verify end-user compliance with manufacturer performance claims calls into question the current and growing use of commercially available measurement instruments and methods (10). To assess whether methods of measuring measure and concentrations in biological matrices are sufficiently precise and appropriate for the purpose set out below, bioassay validation procedures are applied (11). Bioanalysis verification processes determine whether it is possible to duplicate performance data collected from manufacturers during method validation in the context of an end-user (12).
Precision in method verification
Measurement precision is the consistency of indications obtained as a result of repeat measurements on similar or the same objects (11). The precision of a test method gives information related to the method’s reproducibility. Precision is a crucial aspect of the verification process. According to (13), it generally refers to the degree of agreement between various estimates in replicates, which may be similar or different depending on the circumstances. A repeatability is the closeness of the agreement between the results of successive measurements of the same specimen under the following conditions; the same procedure/ methodology, the same operator/ person, the same machine, in the same laboratory environment, using the same chemicals/ reagents over an extended time involving what is referred to as intermediate precision, or it may use new calibrations, calibrators, operators. Reproducibility is explained as repeatability though on conditions only the operating procedure remains the same (14). These conditions could be the same procedure carried out by the same person using the same machine in the same lab using the same chemical over an extended time, representing the process known as repeatability, or they could be other conditions such as replacing reagents with new calibrations, calibrators, or staff, known as intermediate precision (6). Earlier methods that used the same test chemicals and test technique but were carried out by different people using different machines in various laboratories were regarded to be reproducible(6). As a result, there are three ways to define precision: repeatability, intermediate precision, and reproducibility. As a result, there are three ways to define precision: repeatability, intermediate precision, and reproducibility. In the laboratory context, precision is also referred to as repeatability (within run precision – intra-assay), reproducibility (between run precision – inter-assay), within-day precision, and between-day precision (15).
For an accurate estimation of precision, it is crucial to use the same lot of reagents and calibrators consistently throughout the process. Introducing different lots may lead to increased observed variability, potentially affecting the precision determination (16). To ensure accurate estimation of precision, stable frozen pools of two or more concentrations should be used, covering the range of medical judgment or the measuring range of the instrument (15). Quality control material or pooled serum with at least two levels, comprising normal and diseased samples, are the best materials for a precision estimate. Three repetitions per day (within-run repeatability or intra-assay) for five straight days (between-run intermediate precision) are required for the accuracy evaluation (15). The results from each replication at different parameter levels are gathered and analysed to calculate the mean, standard deviation (SD), and coefficient of variation (CV).
SD = ![]() where xi = the individual value, x ̅ = the mean, Σ = Summation of and n = number of data points in the sample.
where xi = the individual value, x ̅ = the mean, Σ = Summation of and n = number of data points in the sample.
CV % = SD/Mean × 100 and CV = SD/Mean.
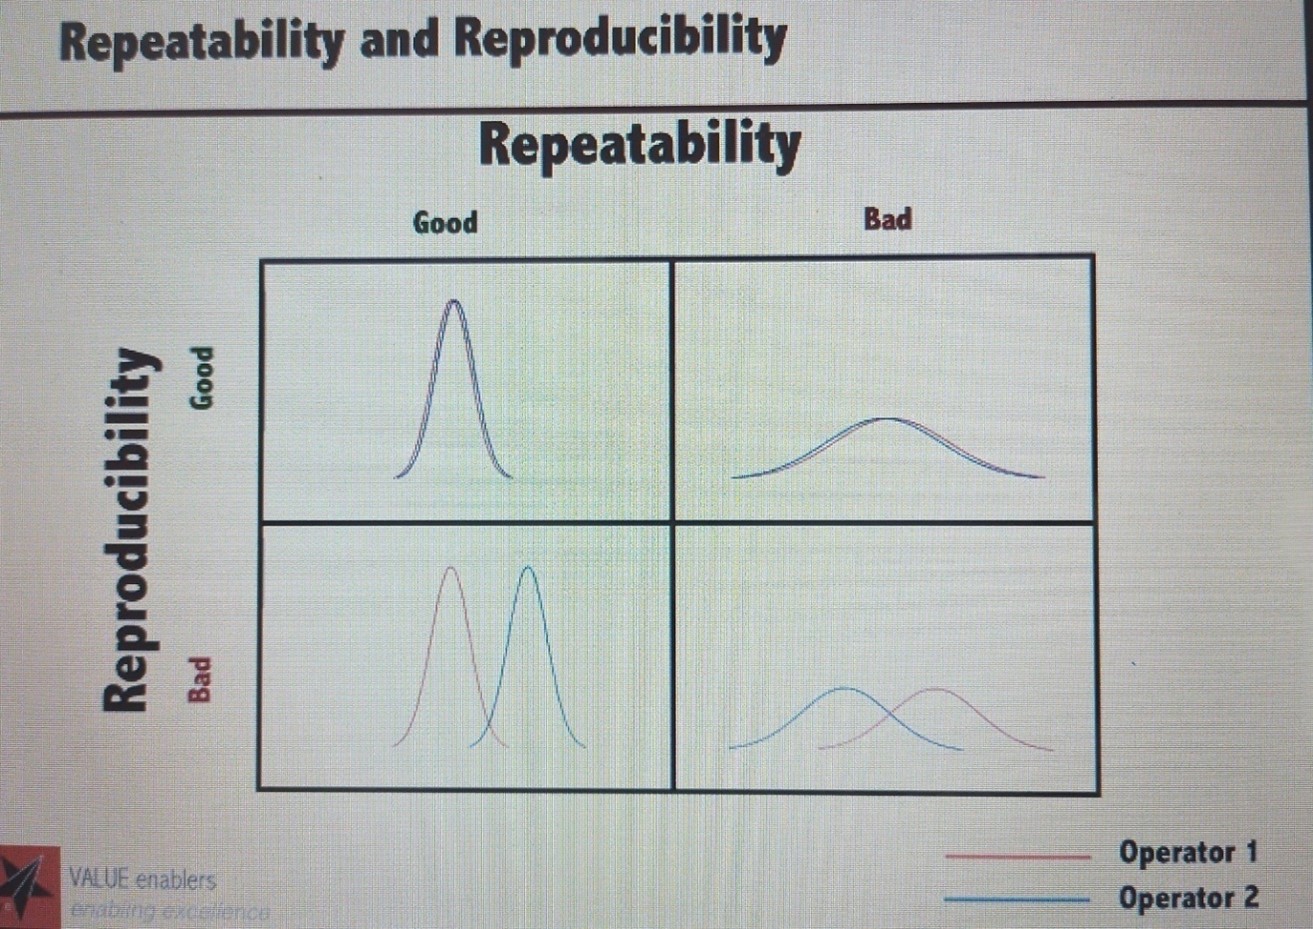
Figure 1: Precision – repeatability and reproducibility(17).
Total Analytical error or total error in medical/ clinical Laboratory
Total error is random and systemic errors combined that in turn represent bias and imprecision values. Application of total error;
Systematic error (SE) = Bias, Random error (RE) = Imprecision,
Total error = Bias + Imprecision. Total error = Bias + 1.65 SD (95% of the error), Total error % = Bias % + 1.65 x CV %. Bias = Observed value – Target value, Bias % = Bias % = (Ӯ0-x ̅/x ̅ × 100. Where; Ӯ0 = Observed mean and x ̅ is the target mean.
The TAE was founded in 1974 by Westgard, Carey, and Wold to provide a more explicit look at the evaluation of methodologies. During that time, laboratories looked at accuracy (inaccuracy, bias) and precision (imprecision) separately as sources of error (18).
Figure 2: Total analytic error or total error: random error (RE), systematic error (SE), total analytic error (TAE or TE), bias (inaccuracy), and SD (standard deviation).
As a result of traditional laboratory operations involving replicate measurements and imprecision reduction, bias became the most important factor in evaluating a test outcome (18). However, medical laboratories typically measure only one patient specimen per visit. As a result, the overall impact of a method’s precision and accuracy determines the analytical quality of a test result (19).
As a result of these differences in clinical laboratory practice, the TAE concept has been
developed. The authors recommended that the acceptance of method performance is assessed, based on the size of errors detected in comparison with the allowed total error (ATE).
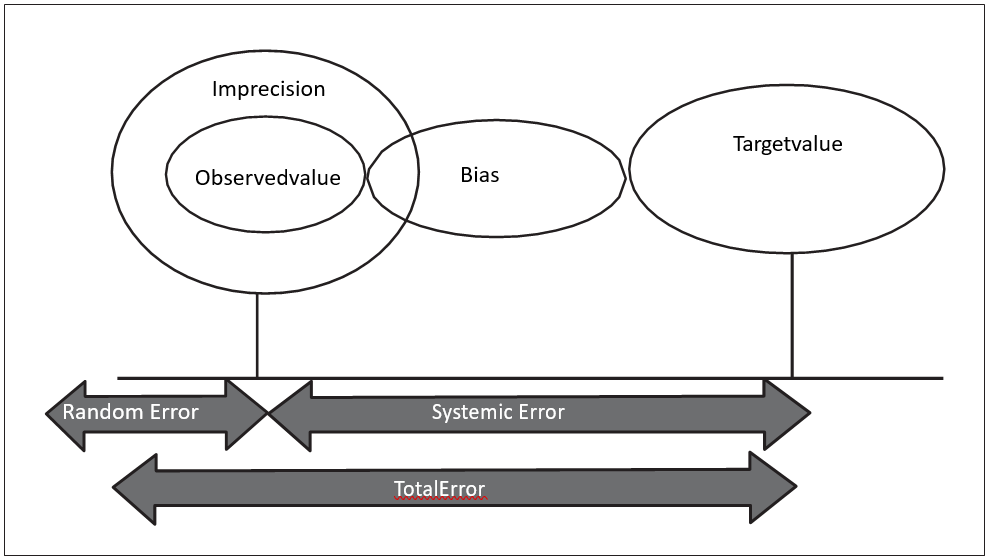
Figure 3: Total analytical error in medical/ clinical laboratories.
Total Error Allowable (TEa) in medical/ clinical laboratory
Total Error Allowable (TEa) refers to the permissible degree of error in a test result that can be tolerated without rendering the result medically unreliable or inconclusive. If the Total Error (TE) realised is less than TEa, the patient’s results are considered useful. If TE present is greater than TEa the laboratory result is unable to meet quality requirements for the method and is likely to produce medically unreliable patients’ testresults (20). In 1974, Westgard established the idea of total error (20, 21). The uncertainty of a test result was combined with bias (systematic error), reproducibility, and analytical imprecision to form an uncertainty measure. The total error is composed of randomly and systematically selected components (20). Precision and accuracy are two qualitative terms that can be used to represent the two error components, which are assessed statistically as SD and bias (22). According to the Clinical Laboratory Improvement Amendments Act of 1988, total errorallowable as a total error that can be accepted in light of the patient’s needs, the available analytical techniques, and the standards for proficiency testing. For a variety of medical and lab tests, the CLIA 88 provides guidelines as to what errors are acceptable. Measurement trueness is the extent to which the average of all the replicated measured quantities agrees with a measurement reference value (22).
Thus, measurement bias and systematic error measures are inversely related to trueness. The degree to which the measured quantity value and the actual quantity value of a measure agree is referred to as measurement accuracy (22). Both systematic and random error components are present. A measurement is truer when it has a lower measurement error, more precise when it has a lower bias, and truer when it has a lower random error. Precision is a qualitative concept and can only be expressed quantitatively as its opposite – imprecision (23).
The SD is commonly expressed as relative SD/CV.
CV % = SD/Mean x 100 and CV = SD/Mean.
The advantage of total error permissible over standard deviation is that its size is corrected for the values’ positions on the measurement scale (23). The SD is substantially bigger when measuring near 100 when the measurement uncertainty is the same on a scale of around 100 as it is on a scale of around 10. By dividing the SD by the mean, the coefficient of variation is adjusted to account for this (7).
A quantitative expression of measurement quality is measurement uncertainty. According to general guidelines for error computation, its components can be approximated and incorporated (24). The uncertainty concept was released in 1993 as the “Guide to the Expressionof Uncertaintyin Measurement(GUM)” following a lengthy discussion and deliberation process under the supervision of numerous international organizations. It takes the place of the previous “error” idea (24).
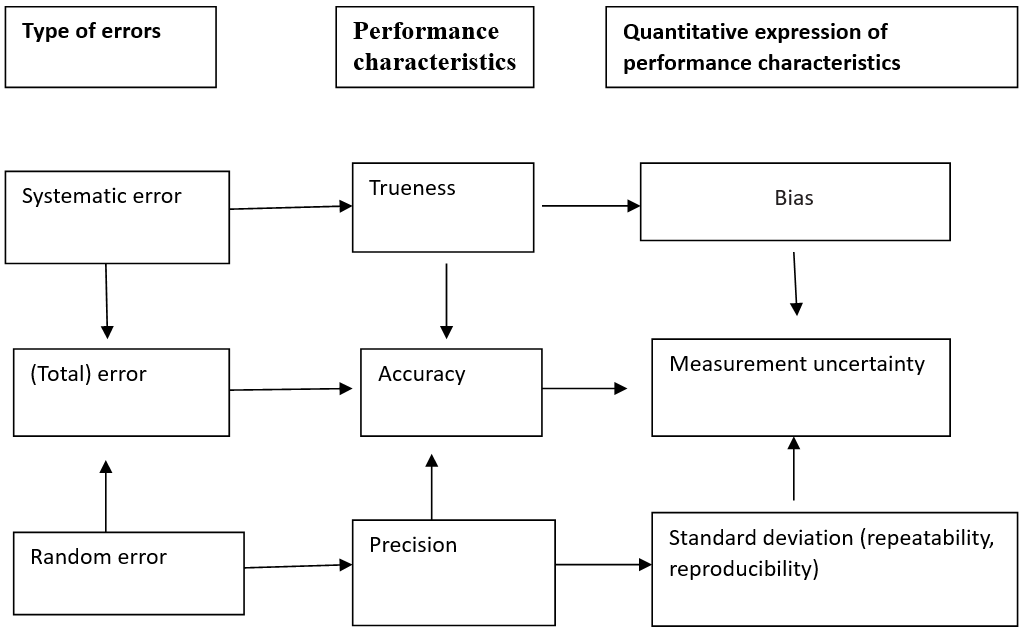
Figure 4: Types of errors in medical/ clinical laboratory
In principle, the measurements should be extremely accurate and precise, that is low bias, low CV or low SD values. To validate methods, some authors have used CV coefficients as high as 6 for the bias. Westgard’s original formula was bias (%) + 1.65CV. Clinical Laboratory Improvement Amendments Act (1988) recommends that the total allowable error should equal bias (%) + 2CV, which is a definition provided by Westgard, (1996), Clinical Laboratory Improvement Amendment’s Act 1988 Limits for Proficiency Testing and the US Federal Register calculate allowable total error by using bias (depicted in units of the test) + 2SD (25).
This study aims to examine the precision of the quantitative measurement method in Machakos County, Kenya.
METHODS
Ethical considerations
The patientspecimen used was pooled human serum hence no patient identifiers were recorded. Carrying out internal quality control is a daily routine performed by the laboratory as per their policy guidelines and standard operating procedures. No incentives were provided. This study was approved by the Kenyatta University ethical review committee (ERC) reference number PKU/2616/11740 dated 04th October 2022, Machakos Level V Hospital ethical review committee reference number MKS/DHES/RSCH/VOL1/252 dated 24th October 2022 and NACOSTI reference number NACOSTI/P/22/20933 dated 14th October 2022. The data collection didn’t involve human samples associated withany specific individual or human subjects hence the waiver was granted for the use of standard commercially available internal quality control material and pooled human serum.
Design of the study
The comparative descriptive design model examines differences in variables between two or more study samples at a point in time. A purposivesampling technique was used.Roche Cobas® Integra 400 Clinical Chemistry analyser was used to perform a comparative descriptive study of albumin, alanine aminotransferase (ALT), alkaline phosphatase (Alk Phos), aspartate aminotransferase (AST), chloride, creatinine Direct Bilirubin (D. Bil), Gamma-glutamyl transferase (GGT), potassium, sodium, total bilirubin, total protein, and urea. A single large quantity of internal quality control material was used.
The inclusion criteria included calibration materials, and internal quality control materials same lot number.
The exclusion criteria for the study include internal control materials with different lot numbers, Patient samples, split samples and interlaboratory comparison/ analysis.
The study population entails the use of internal quality control material used in the laboratory for daily quality control and pooled human serum.
Data collection and methods
To analyse various types of tests, Cobas Integra 400, a fully automated and software-controlled clinical chemistry system was used. The system characteristics include fully automated, modular, and computerized, uses serum/plasma/whole blood/ QC materials, performs in vitro quantitative tests on a wide range of analytes such proteins, bilirubin, liver enzymes, urea, creatinine and blood electrolytes, performs photometric assays and ion-selective electrode measurements (18).
Roche Diagnostics, Mannheim, Germany supplied all the reagents, internal quality control materials and calibrators.
To calculate short-term precision, pooled human serum and internal quality control material were run at once for all analytes twenty times. To obtain long-term precision internal quality control materials (IQC) were constituted each day and run in duplicate for a minimum of twenty days. Internal quality control materials two levels (normal and pathological) were run on Cobas Integra 400 as recommended by (16). Similarly following guidelines issued by the Clinical Laboratory Improvements Amendment 1988 (CLIA) and the Clinical Laboratory Standards Institute (CLSI), internal quality control results were used to calculate mean, SD, and CV% and compared to manufacturers’ mean, standard deviation and CV%.
Study location and date
The study was conducted at Machakos level V hospital’s Clinical Chemistry laboratory for several reasons. Firstly, the hospital serves as the primary referral centre for Machakos County residents, providing essential healthcare services to the local community. Its central location along the Nairobi-Kitui Road ensures accessibility for patients from various parts of the county. Additionally, the hospital’s expertise and specialized facilities, such as the Clinical Chemistry laboratory, make it an ideal setting for conducting medical research and diagnostic investigations. The hospital laboratory is accredited to ISO 15189:2012. Furthermore, its geographical coordinates at Latitude: 1°31’24.5″S and Longitude: 37°15’58.6″E provide a specific reference point for the study’s location, facilitating accurate documentation and reproducibility of results. Overall, Machakos level V hospital was chosen as the study site due to its pivotal role in healthcare provision for Machakos county residents and its suitability for conducting research in the Clinical Chemistry field.
The study was carried out in December 2022, January and February 2023 at Machakos County, Kenya.
Sample size
According to CLSI, the minimum sample size for establishing short-term precision is running commercially available control (internal quality control and reference material) or pooled human serum twenty times a day. Long-term precision is achieved by running commercially available control materials daily for a minimum of twenty days, samples run in duplicates (two levels)bearing the same lot number.
Data analysis and presentation
Methods for determining precision were applied using Microsoft Excel Windows 10 MS Office 2021. Mean, standard deviation (SD)and coefficient of variation (CV) % were calculated. A table was used to display the data.
RESULTS
(i) Short term precision
Analysis of quality control materials and pooled human serum on selected analytes was carried out and the results are presented in Table 1 below. There was conformance to the target CV % given by CLIA for all analytes except for Chloride (normal control (PCC1)) material. Fifteen analytes both levels out of twenty-six (26) met manufacturers recommended CV %.
Table 1: Summarises the results for short-term precision for the thirteen analytes using internal quality control materials and pooled human serum ran between December 2022 to February 2023.
| Short Term Precision/ Repeatability (Within Run) | |||||||
| S/No | Item Description | Sample No | Obtained CV % | Target CV % (CLIA) | Pass/ Fail | Target CV % (Manufacturer) | Pass/ Fail |
| 1a | Albumin | PCC1 | 0.68 | 2.50 | Pass | 1.90 | Pass |
| 1b | PCC2 | 0.82 | 2.50 | Pass | 1.90 | Pass | |
| 2a | Alkaline Phosphatase | PCC1 | 0.85 | 7.50 | Pass | 1.60 | Pass |
| 2b | PCC2 | 0.67 | 7.50 | Pass | 1.80 | Pass | |
| 3a | SGPT | PCC1 | 0.65 | 5.00 | Pass | 1.00 | Pass |
| 3b | Pooled serum | 0.46 | 5.00 | Pass | 0.50 | Pass | |
| 4a | SGOT | PCC1 | 0.65 | 5.00 | Pass | 1.40 | Pass |
| 4b | PCC2 | 0.55 | 5.00 | Pass | 0.40 | Fail | |
| 5a | Bilirubin Direct | PCC1 | 1.33 | 5.00 | Pass | 0.90 | Fail |
| 5b | Pooled serum | 1.47 | 5.00 | Pass | 0.20 | Fail | |
| 6a | Bilirubin Total | PCC1 | 1.21 | 5.00 | Pass | 2.10 | Pass |
| 6b | Pooled serum | 0.93 | 5.00 | Pass | 0.60 | Fail | |
| 7a | Chloride | PCC1 | 1.33 | 1.25 | Fail | 0.70 | Fail |
| 7b | PCC2 | 0.72 | 1.25 | Pass | 0.80 | Pass | |
| 8a | Creatinine | Pooled serum | 1.81 | 3.75 | Pass | 3.10 | Pass |
| 8b | Pooled serum | 1.45 | 3.75 | Pass | 1.40 | Pass | |
| 9a | GGT | PCC1 | 0.69 | 6.25 | Pass | 1.80 | Pass |
| 9b | PCC2 | 0.97 | 6.25 | Pass | 1.00 | Pass | |
| 10a | Potassium | PCC1 | 0.23 | 0.78 | Pass | 0.40 | Pass |
| 10b | PCC2 | 0.35 | 0.78 | Pass | 0.30 | Fail | |
| 11a | Sodium | Pooled serum | 0.49 | 3.80 | Pass | 0.30 | Fail |
| 11b | PCC2 | 0.4 | 3.80 | Pass | 0.20 | Fail | |
| 12a | Protein Total | PCC1 | 0.61 | 2.50 | Pass | 0.50 | Fail |
| 12b | PCC2 | 0.9 | 2.50 | Pass | 0.50 | Fail | |
| 13a | Urea | PCC1 | 1.47 | 2.25 | Pass | 2.30 | Pass |
| 13b | Pooled serum | 1.99 | 2.25 | Pass | 0.90 | Fail | |
PCC1 – Preci-control Clinchem multi 1, PCC2 – Preci-control Clinchem multi 2, GGT – Gamma Glutamyl Transferase, SGOT – Serum glutamic-oxaloacetic transaminase, SGPT – Serum Glutamic Pyruvic Transaminase, CV – Coefficient of Variation, CLIA – Clinical Laboratory Improvement Amendments
Table 1: Short-term precision results
The failure in achieving the target coefficient of variation (CV) for some analytes in the short-term precision/repeatability (within run) could be attributed to several factors:
Instrument Variation: Differences in instrument performance or calibration may lead to variability in results, affecting precision.
Sample Handling: Inadequate sample handling techniques, such as improper mixing or storage conditions, could introduce variability and affect repeatability.
Analytical Techniques: Variability in analytical techniques, such as pipetting errors or variations in reagent quality, could impact precision.
Environmental Factors: Fluctuations in environmental conditions, such as temperature or humidity, may affect assay performance and result in variability.
Reagent Stability: Reagent stability issues, such as degradation over time or improper storage, could lead to inconsistencies in results and affect precision.
Interference:The presence of interfering substances in the samples or matrix effects could impact the accuracy and precision of the assay, leading to variability in results.
Quality Control Measures: Inadequate implementation of quality control measures or failure to detect and address issues promptly could contribute to variability in results and affect precision.
Addressing these factors through proper training of personnel, regular maintenance and calibration of instruments, stringent adherence to standard operating procedures, and robust quality control measures can help mitigate variability and improve the precision and repeatability of assay results.
(ii) Long-term precision
Analysis using internal quality control material on selected analytes was carried out and the results are presented in table 2 below. Twenty (20) passed the target (CLIA) CV % while six controls (PCC1 & PCC2) for Chloride, Potassium and Urea failed to achieve target CV% as indicated against each analyte and control level. All thirteen analytes on both IQC materials (PCC1 & PCC2) failed to achieve the manufacturer’srecommended CV %.
Table 2: Summarises the long-term precision for the thirteen analytes obtained from IQC daily QC data using internal quality control materials ran between December 2022 and January 2023.
| Long Term Precision/ Reproducibility (Between Run) | |||||||
| S/ No | Item Description | Sample No | Obtained CV % | Target CV % (CLIA) | Pass/ Fail | Target CV % (Manufacturer) | Pass/ Fail |
| 1a | Albumin | PCC1 | 2.97 | 3.30 | Pass | 2.3 | Fail |
| 1b | PCC2 | 3.11 | 3.30 | Pass | 2.6 | Fail | |
| 2a | Alkaline Phosphatase | PCC1 | 4.52 | 9.90 | Pass | 2.8 | Fail |
| 2b | PCC2 | 4.37 | 9.90 | Pass | 2.8 | Fail | |
| 3a | ALT/ SGPT | PCC1 | 4.27 | 6.60 | Pass | 1.5 | Fail |
| 3b | PCC2 | 3.90 | 6.60 | Pass | 1.9 | Fail | |
| 4a | AST/ SGOT | PCC1 | 5.01 | 6.60 | Pass | 1.7 | Fail |
| 4b | PCC2 | 3.74 | 6.60 | Pass | 1.5 | Fail | |
| 5a | Bilirubin Direct | PCC1 | 5.43 | 6.60 | Pass | 1.6 | Fail |
| 5b | PCC2 | 4.75 | 6.60 | Pass | 1 | Fail | |
| 6a | Bilirubin Total | PCC1 | 6.46 | 6.60 | Pass | 2.5 | Fail |
| 6b | PCC2 | 6.25 | 6.60 | Pass | 1.4 | Fail | |
| 7a | Chloride | PCC1 | 3.22 | 1.65 | Fail | 1.2 | Fail |
| 7b | PCC2 | 2.87 | 1.65 | Fail | 1.5 | Fail | |
| 8a | Creatinine | PCC1 | 3.50 | 4.95 | Pass | 2.8 | Fail |
| 8b | PCC2 | 3.17 | 4.95 | Pass | 1.3 | Fail | |
| 9a | GGT | PCC1 | 3.65 | 6.60 | Pass | 1.8 | Fail |
| 9b | PCC2 | 3.32 | 6.60 | Pass | 1.3 | Fail | |
| 10a | Potassium | PCC1 | 3.46 | 1.32 | Fail | 0.8 | Fail |
| 10b | PCC2 | 4.02 | 1.32 | Fail | 0.8 | Fail | |
| 11a | Sodium | PCC1 | 2.19 | 4.06 | Pass | 1 | Fail |
| 11b | PCC2 | 2.71 | 4.06 | Pass | 0.6 | Fail | |
| 12a | Protein Total | PCC1 | 3.02 | 3.30 | Pass | 1 | Fail |
| 12b | PCC2 | 3.20 | 3.30 | Pass | 1.7 | Fail | |
| 13a | Urea | PCC1 | 5.30 | 2.97 | Fail | 3.9 | Fail |
| 13b | PCC2 | 4.35 | 2.97 | Fail | 2.8 | Fail | |
PCC1 – Preci-control Clinchem multi 1, PCC2 – Preci-control Clinchem multi 2, GGT – Gamma Glutamyl Transferase, SGOT – Serum glutamic-oxaloacetic transaminase, SGPT – Serum Glutamic Pyruvic Transaminase, CV – Coefficient of Variation, CLIA – Clinical Laboratory Improvement Amendments
Table 2: Long-Term Precision/ Reproducibility (Between Run)
The failure of all thirteen analytes on both Internal Quality Control (IQC) materials to adhere to the manufacturer’s recommended coefficient of variation (CV%) could be due to several factors:
Inaccurate Calibration: Improper calibration of instruments or inconsistencies in calibration procedures may lead to inaccurate measurements, resulting in variability in results.
Reagent or Material Issues: Quality issues with the IQC materials, such as variability in reagent quality or stability issues, could contribute to inconsistencies in results and failure to meet the manufacturer’s specifications.
Matrix Effects: Differences in matrix composition between the IQC materials and patient samples may affect assay performance and result in variability in results.
Instrument Performance: Variabilities in instrument performance, such as fluctuations in temperature or malfunctioning components, could impact the accuracy and precision of measurements, leading to failure to meet the manufacturer’s specifications.
Sample Handling and Processing: Inadequate sample handling techniques or variations in sample processing procedures may introduce variability in results and affect the ability to adhere to the manufacturer’s recommended CV%.
Environmental Factors: Fluctuations in environmental conditions, such as temperature or humidity, may affect assay performance and result in variability in results.
Interference: The presence of interfering substances in the IQC materials or matrix effects could impact the accuracy and precision of measurements, leading to variability in results and failure to meet the manufacturer’s specifications.
Addressing these factors through proper calibration and maintenance of instruments, stringent adherence to standard operating procedures, thorough evaluation of reagent quality, and implementation of robust quality control measures can help improve the accuracy and precision of measurements and ensure adherence to manufacturer’s specifications for IQC materials.
DISCUSSION, CONCLUSION AND RECOMMENDATIONS
Precision in method verification
(i) Short-term precision performance: Analysis of quality control materials and pooled patients’ serum on selected analytes revealed conformance to the target CV % given (CLIA) except normal control (PCC1) material for Chloride which failed to meet the target CV %. Fifteen analytes out of twenty-six (26) passed manufacturers recommended CV %. Eleven (11) failed to achieve the recommended manufacturer CV %. These analytes are (SGOT – PCC1, Bilirubin direct – PCC1 and Pooled serum (pathological), Bilirubin total – Pooled serum (Pathological), Chloride – PCC1, Potassium – PCC2, Sodium – PCC1 & PCC2, Protein total – PCC1 & PCC2, Urea Pooled serum (pathological)) failed to achieve recommended manufacturer CV %. These results are replicated in both specimens that is pooled serum and IQC material.
These results are replicated in both samples that is pooled serum and IQC material. Sten Westgard, (2019) observed that it is possible to obtain precision claims equal to or better than that of the manufacturer (27).
These results are consistent with findings on the comparison of analyser actual data with manufacturer data by (28) at Bursa Public Health Laboratory, Bursa Turkey. He observed that electrolytes are among the analytes which failed to meet manufacturers’ target CV % reason being that they are physiologically controlled in a strict and narrow range. This compares with this finding in which chloride (an electrolyte) failed to achieve the target.
Another study which was carried out by (29) on the application of accuracy and precisions based on current USA and Indonesian pharmacopoeia concluded that evaluation using limits of accuracy and precision described by current United States pharmacopoeia (USP) and Indonesian Pharmacopoeia (FI) cannot be used to draw valid conclusions. Although the majority of the analytes met the CLIA target for precision, the same could not be achieved using the manufacturers’ target % CV.
Verification methods are an accreditation requirement in a study carried out on clinical laboratory instrument verification in the United Kingdom and New Zealand (8). On the manufacturers’ claim for imprecision, only 61% met the criteria. In this study, 57.7% met manufacturers criteria. The study concluded that it is common for method performance to fail due to lack of standardised verification criteria. Similarly, manufacturers’ studies are carried out in highly controlled environments by highly competent personnel in the area.
(ii) Long-term precision performance
Analysis on all analytes using IQC material, twenty passed the target Clinical Laboratory Improvement Amendment’s (CLIA) CV % while six controls for chloride, potassium and urea failed to achieve the target CV %. However, all thirteen analytes on both IQC materials failed to achieve manufacturer’s recommended CV %. This is attributable to the fact that manufacturers’ studies are carried out in a highly controlled environment by staff who are competent in the area of interest.
These results compare to another study which was carried out by (27) on Roche Cobas 6000 c501 in Saudi Arabia where the performance was 43% below the expected target which concluded that the method was not able to meet significant number of the desirable CLIA and manufacturers targets. In this study 76.9% met CLIA target and 0% achieved manufacturers target. Clinical Laboratory Improvement Amendment’s and manufacturers targets are most challenging even to an advanced method and instrument. This is due to manufacturers highly controlled environment and by technical experts in the area.
These results are in line with findings from a comparative analysis of real data at Bursa Public Health Laboratory, Turkey between the analyser and manufacturer’s data (28). During the analysis, it was found that the CV% values obtained by laboratory tests were not as high as those indicated by the manufacturer on the package insert. This study achieved 76.9% CLIA target and 0% manufacturers target. A variety of factors contribute to the development of within-day biases that turn into random effects in the long run. A large number of bias components also vary and this further contributes to the random error component over an extended period of weeks or months in which observations are made.
Similarly, in a study performed by Zhujiang Hospital of Southern Medical University 2019, laboratory verification was carried out and some analytes did not meet CLIA and manufacturer specifications (27).
In another study that was carried out in King Fahd Armed Forces Hospital Jeddah on verification of sigma performance 2023, not all analytes achieved the CLIA target verification. Changes in the reagent, calibrators or personnel may have caused this. Hence, the findings were expected to be wider than CV calculated over shorter periods and expected to have resulted to lower sigma metrics (30).
Further to that, the manufacturer’s data appear to have been frequently optimistic studies which may be taken as an experiment rather than a study under optimal working conditions and with regular activities contributing to these outcomes (28).
Limitations of the study
There was no gender or sex coverage due to the use of commercially available internal quality control materials and pooled patient serum. The study was limited to resource availability and ample time for data collection, cleaning, analysis and presentation.
Recommendations
To facilitate quality precision performance of quantitative measurement methods at Machakos level V Hospital clinical chemistry laboratory, the institutions ought to establish IQC mechanisms to closely monitor long-term precision, a robust QC program and implement appropriate QC materials (calibrators and controls) that cover the range of analytes being measured. Ensure good environmental controls are in place and closely monitored. Staff competency and consistency are maintained. They should follow manufacturer recommendations and adhere to the manufacturer’s instructions for running QC materials, including frequency and acceptance criteria. Monitoring instrument performance should be regularly assessed and document instrument calibration and maintenance activities to ensure optimal performance.
Action plan
Implement Internal Quality Control (IQC) mechanisms to monitor long-term precision. This could include statistical process control charts to track performance over time.
Create a comprehensive Quality Control (QC) program that includes the use of appropriate QC materials such as calibrators and controls. These should cover the range of analytes being measured.
Maintain optimal conditions in the laboratory by closely monitoring temperature, humidity, and other environmental factors that could affect test results.
Regularly conduct staff training and competency assessments to ensure consistent performance. This could include periodic retraining and proficiency testing.
Follow the manufacturer’s recommendations for running QC materials, including the frequency of running controls and the acceptance criteria for QC results.
Regularly assess the performance of laboratory instruments. This could include routine calibration checks and preventive maintenance.
Keep a detailed record of all instrument calibration and maintenance activities. This will provide a historical record of instrument performance and can be useful for troubleshooting issues.
Conclusions
The performance on precision studies was average. Assessment of the clarity, comprehensiveness, competency, training adequacy and adherence to established SOPs among laboratory personnel should be carried out to identify any gaps in knowledge or skills and proposition of targeted training interventions.
Competing interest
The authors declare that they have no financial or personal relationships that may have inappropriately influenced them in writing this article.
Sources of financial support
The author disclosed receipt of the following financial support for the research, authorship, and/or publication of this article: This work was supported by the Kenya Defence Forces (Kenya Army).
Data availability statement:
Raw data were generated at Machakos County, Kenya. Derived data supporting the findings of this study are available from the corresponding author Charles K. Mutie on request.
Disclaimer
The findings and conclusions in this article are those of the authors and do not necessarily represent the official position of the institution or funder.References in this manuscript to any specific commercial products, process, service, manufacturer, or company do not constitute its endorsement or recommendation by Machakos County and the Kenya Government.
REFERENCES
- Meškuotienė, A., Dobilienė, J., Raudienė, E., and LilijanaGaidamovičiūtė, L.(2022). A Review of Metrological Supervision: Towards the Common Understanding of Metrological Traceability in Legal and Industrial Metrology. MAPAN.
- Alemnji, G. A., Zeh, C., Yao, K., Fonjungo, P. N. (2014). Strengthening national health laboratories in sub-Saharan Africa: a decade of remarkable progress. Trop Med Int Health. 2014 Apr;19(4):450-8. doi: 10.1111/tmi.12269. Epub 2014 Feb 10. PMID: 24506521; PMCID: PMC4826025.
- ISO/IEC 15189, (2022). Medical laboratories’ requirements for quality and competence.
- KENAS, (2021). https://www.kenas.go.ke/ guidelines/ cited 04 April 2023.
- International vocabulary of metrology (2012). Basic and general concepts and associated terms (VIM) 2012, 3rd. Available from: www.bipm.org/en/publications/guides/ vim. html.
- Abdel G. M. T., & El-Masry M. I. (2021). Verification of quantitative analytical methods in medical laboratories. J Med Biochem. 2021 Jun. How to Sustain the Customer Experience: An Overview of Experience Components that Cocreate Value with the Customer, European Management Journal,5;40(3):225-236. doi: 10.5937/jomb0-24764. PMID: 34177366; PMCID: PMC8199534.
- Farrance, I., and Frenkel, R. (2012). Uncertainty of Measurement: A Review of the Rules for Calculating Uncertainty Components through Functional Relationships. Clin Biochem Rev. 2012 May;33(2):49-75. PMID: 22896744; PMCID: PMC3387884.
- Hand, M., Crampton, A., Thomas, A., Kilpatrick, E. S. (2019). A survey of clinical laboratory instrument verification in the UK and New Zealand. Ann Clin Biochem. 2019 Mar;56(2):275-282. DOI: 10.1177/0004563218823804. Epub 2019 Feb 21. PMID: 30674211.
- Blume, J. D., McGowan L. D. A., Dupont W. D., Greevy R. A., Jr. (2018). Second generation p-values: Improved rigor, reproducibility, & transparency in statistical analyses. PLoS ONE 13(3): e0188299. https://doi. org/10.1371/journal.pone.0188299.
- Pum, J. (2019). Advances in Clinical Chemistry. A practical guide to validation and verification of analytical methods in the clinical laboratory, Elsevier Inc. ISSN 0065-2423. https://doi.org/10.1016/bs.acc.2019.01.006. BioscientiaInstitut fur MedizinischeDiagnostik GmbH, MVZ Jena, Germany.
- Theodorsson, E. (2012). Validation and verification of measurement methods in clinical chemistry. Bioanalysis, 4(3), 305-320.
- Smith, G. (2012). European Medicines Agency guideline on bioanalytical method validation: what more is there to say? Bioanalysis. 2012 May;4(8):865-8. doi: 10.4155/bio.12.44. PMID: 22533559.
- Squara, P., Scheeren, T. W. L., Aya, H. D. Bakker, J., Cecconi, M., Einav, S., Malbrain, M. L. N., Monnet, X., Reuter, D. A., Iwan C. C., van der Horst &Saugel. B.(2021). Metrology part 1: definition of quality criteria. J Clin Monit Comput 35, 17–25 (2021). https://doi.org/10.1007/s10877-020-00494-y.
- Biswas, S. Bindra, M. Jain V. Gokhale, P. (2014). Evaluation of Imprecision, Bias and Total Error of Clinical Chemistry Analysers. Ind J Clin Biochem DOI 10.1007/s12291-014-0448-y. Association of Clinical Biochemists of India 2014.
- Abdel G. & El-Masry, M. I. (2020). Verification of quantitative analytical methods in medical laboratories. January 2020. Journal of Medical Biochemistry40(3) DOI:5937/jomb0-24764 License CC BY 4.0.
- Clinical and Laboratory Standards Institute (CLSI), (2014). User Verification of Precision and Estimation of Bias: Approved Guideline, third ed., CLSI, Wayne, Pennsylvania, 2014. CLSI Document EP15-A3.
- Value Enablers Academy cited 17 December 2022 https://webnar.leanmurali.com/Leansixsigma-career.
- Westgard, J. O., & Westgard, S. A. (2013). Total analytic error. From concept to application.
- Agarwal, R. (2014). Quality-Improvement Measures as Effective Ways of Preventing Laboratory Errors, Laboratory Medicine, Volume 45, Issue 2, May 2014, Pages e80–e88, https://doi.org/10.1309/ LMD0YIFPTOWZONAD.
- Westgard QC. (2019). https://www.westgard.com/clia.htm cited 20th February 2023.
- Whitehead, T. P. (1977). Quality Control in Clinical Chemistry (Quality Control Methods in the Clinical Laboratory). SBN 13: 9780471940753.
- Johnson, C. (2017). Radiometric metrology for Ocean colour, Extended abstract of Johnson’s talk. Fiducial reference measurements for satellite Ocean colour (FRM4SOC) Workshop, Feb 21 – 23, 2017, Frascati, Italy B. Carol Johnson, Sensor Science Division, National Institute of Standards and Technology.
- Bhandari, P. (2021).https://www.scribbr.com/author/pritha/random-vs-systematic-error/ Cited 07 April 2023.
- Kacker, R. (2018). True value and uncertainty in the GUM. National Institute of Standards and Technology, Gaithersburg, Maryland 20899-8910, USA. J. Phys.: Conf. Ser. 1065 212003.
- Harr, K. E., Flatland, B., Nabity, M., & Freeman, K. P. (2013). ASVCP guidelines: allowable total error guidelines for biochemistry. Veterinary clinical pathology, 42(4), 424 436.
- Westgard, S. & Westgard, QC. (2017). Results from the Great Global QC Survey and Results from outside the US.
- Westgard QC. (revised 2023). https://www.westgard.com/clia.htm cited 30th February 2023.
- Keles, M. (2021). Evaluation of the clinical chemistry tests analytical performance with Sigma Metric by using different quality specifications – Comparison of analyser actual performance with manufacturer data.
- Gunawan, I. (2022). “Application of accuracy and precision evaluations based on the current United States and Indonesian Pharmacopoeias: A Critical Review,” Makara Journal of Science: Vol.26: Iss.4, Article 1. DOI: 10.7454/mss.v26i4.1343.
- Van-Heerden, M., George J. A., Khoza, S. (2022). The application of sigma metrics in the laboratory to assess quality control processes in South Africa. Afr J Lab Med. 2022;11(1), a1344. https://doi.org/10.4102/ajlm.v11i1.1344.