
Developing A Sustainable Urban Planning Index: A Multi-Criteria Decision-Making Framework for Master Plan Evaluation in Developing Countries
- Ramine Chuhdary
- Muhammad Zaly Shah
- Shahram Chuhdary
- Mufeeza Tahira
- Rana Tahir Mehmood
- 4206-4236
- Mar 21, 2025
- Urban and Regional Planning
Developing A Sustainable Urban Planning Index: A Multi-Criteria Decision-Making Framework for Master Plan Evaluation in Developing Countries
Ramine Chuhdary1, Muhammad Zaly Shah2, Shahram Chuhdary3, Mufeeza Tahira4*, Rana Tahir Mehmood5
1,2,5Faculty of Built Environment, University Technology Malaysia, 81310, Skudai, Johor Bahru, Malaysia
3,4Independent Researcher
*Corresponding Author
DOI: https://dx.doi.org/10.47772/IJRISS.2025.9020330
Received: 16 February 2025; Accepted: 20 February 2025; Published: 21 March 2025
ABSTRACT
Urban sustainability frameworks are increasingly being localized to reflect area-specific conditions, yet existing assessment tools remain inconsistent, relying on either conceptual models or physical evaluations that demand extensive datasets. This poses challenges, particularly in data-limited settings such as developing countries, where structured sustainability evaluations are lacking. A key gap exists in assessing and ranking development plans, including master plans and spatial strategies, due to the absence of a standardized ranking mechanism for sustainability indicators. “This study introduces the Sustainable Urban Planning Index (SUPI), a structured multi-criteria decision-making (MCDM) framework designed for prioritizing sustainability indicators through expert-driven validation and statistical ranking. Tailored for developing countries, SUPI integrates literature review, expert consultations, and quantitative ranking techniques. Two datasets were analyzed: (1) a broad assessment of 30 sustainability indicators evaluated by 64 experts using Relative Importance Index (RII), Fractional Ranking, and Analytical Hierarchy Process (AHP); and (2) a sector-specific weighting analysis conducted by 20 urban planning professionals employing AHP-based pairwise comparisons. These datasets were synthesized hierarchically through a structured normalization process, ensuring the convergence of sectoral priorities with individual indicator rankings. The final model integrates these rankings through normalized priority vectors, enhancing consistency and applicability in sustainable urban planning assessments. Findings reveal that land use efficiency, environmental resilience, and governance effectiveness are the most influential sustainability factors, whereas traditional indicators such as population density and zoning regulations exhibit weaker correlations with sustainability performance. The final SUPI model offers policymakers a quantifiable, adaptable evaluation framework for urban sustainability assessment. Future research will focus on real-world validation, refining predictive capabilities, and integrating geospatial analysis and real-time monitoring tools to enhance applicability in data-limited environments, making SUPI a practical decision-support tool for sustainable urban development.
Keywords: Sustainable Urban Planning Index (SUPI), Urban Sustainability, Multi-Criteria Decision-Making (MCDM), Relative Importance Index (RII), Urban Monitoring Systems
INTRODUCTION
Urbanization is one of the most transformative global trends of the 21st century, with projections indicating that 68% of the world’s population will reside in urban areas by 2050 (1). While urban expansion drives economic growth and social transformation, it also presents significant sustainability challenges, particularly in developing nations where governance inefficiencies, infrastructure deficits, environmental degradation, and resource constraints hinder effective urban planning (2). Unlike developed economies with structured regulatory frameworks and well-established sustainability assessment models, developing cities often lack comprehensive evaluation mechanisms that allow them to prioritize sustainability efforts effectively. This results in fragmented policy implementation, uncoordinated infrastructure development, and misaligned urban growth, ultimately limiting their ability to achieve long-term sustainability goals (3);(4).
Over the years, urban sustainability assessments have evolved from basic environmental compliance models to multi-dimensional frameworks incorporating economic, social, and governance factors ((5). Global sustainability benchmarks, such as ISO 37120 and Sustainable Development Goal 11 (SDG 11), provide standardized indicators for assessing urban sustainability at an international level ((6);(7)). However, despite their broad applicability, these frameworks have not effectively enabled developing countries to implement, adapt, or excel in urban sustainability planning ((6); (8)). Governance complexities, infrastructural limitations, and socio-economic constraints within these regions often hinder the practical application of such frameworks, limiting their ability to drive context-specific urban planning interventions ((9); (5). While these models offer general sustainability guidelines, they often lack contextual adaptability, making their integration into localized urban planning frameworks challenging ((10); (11)).
Furthermore, existing sustainability assessment tools typically evaluate environmental, social, economic, and governance dimensions in isolation, without providing an integrated system that contextualizes sustainability priorities based on local governance capacities and resource availability (12). Research on urban sustainability in developing countries highlights key dimensions—including land use efficiency, infrastructure resilience, environmental sustainability, governance, and transportation—yet no standardized framework exists that systematically ranks these factors based on their significance in resource-constrained environments ((5); (2)). Existing models often rely on global benchmarks, which fail to capture localized governance inefficiencies, informal urbanization patterns, and infrastructure deficits (13). To address this gap, research must focus on developing a tailored evaluation model that is applicable in resource-constrained environments while also establishing pathways for advancing urban planning knowledge in developing nations.
This study introduces the Sustainable Urban Planning Index (SUPI)—a hybrid multi-criteria decision-making framework designed to provide a structured assessment and ranking model for urban sustainability evaluation. Unlike existing sustainability assessment models, which offer broad objectives without prioritization, SUPI integrates sectoral priorities with sub-indicator weightings, creating a structured decision-support tool for policymakers and urban planners. This study employs a systematic methodology, structured as follows:
- Development of a structured sustainability indicator framework through literature review, international benchmarks, and expert validation, culminating in seven sectoral categories and thirty sustainability indicators.
- Application of Relative Importance Index (RII) and Fractional Ranking to simplify pairwise comparisons among 30 sustainability indicators, enabling pre-normalization before applying the Analytical Hierarchy Process (AHP).
- Ranking sectoral priorities using AHP, ensuring that sustainability efforts align with critical urban development challenges in developing countries.
- Integration of AHP rankings at two levels, where the 30-indicator AHP assessment is merged with the 7-sector AHP output, ensuring that sectoral weightings serve as multipliers for the normalized indicator rankings. This hybrid ranking model ensures that sustainability priorities reflect both intra-sectoral importance and broader urban sustainability objectives.
By merging sectoral and sub-indicator weightings into a unified evaluation model, SUPI establishes a structured yet adaptable framework for assessing urban sustainability performance. To guide this research, the following questions are addressed:
- What are the most relevant sustainability indicators for urban planning in developing countries?
- How can sectoral sustainability priorities be ranked to reflect governance and resource constraints in developing cities?
- What weighting mechanisms can effectively integrate sectoral and sub-indicator rankings into a comprehensive sustainability index?
This research contributes to the field of urban sustainability assessment by introducing a structured ranking methodology that enhances the evaluation and prioritization of sustainability indicators in resource-constrained environments. The SUPI framework provides a quantitative decision-making tool, ensuring that sustainability efforts are empirically validated, contextually relevant, and adaptable to local urban planning challenges.
LITERATURE REVIEW
Evolution of Urban Sustainability Assessment Models: Urban sustainability assessment has progressed from single-dimensional environmental compliance models to multi-criteria frameworks that incorporate economic, social, and governance indicators(14, 15). Early models focused primarily on ecological concerns, such as air and water quality, with little consideration for their impact on broader urban planning strategies (4, 16). However, with the acceleration of urbanization, these models became inadequate, leading to the development of holistic sustainability assessment frameworks (12, 16).
Global sustainability frameworks, including ISO 37120 (Sustainable Cities and Communities), Sustainable Development Goal 11 (SDG 11), and LEED for Neighborhood Development (LEED-ND), aim to provide standardized sustainability indicators for urban areas (17-20). Despite their structured approach, these models have been critiqued for their limited applicability in developing countries, where institutional, financial, and infrastructural constraints hinder their effectiveness(13, 21). The reliance of these frameworks on comprehensive urban datasets and strong governance structures makes their application challenging in cities facing data inconsistencies and regulatory fragmentation(5, 21, 22).
Furthermore, many existing sustainability models analyse environmental, economic, and governance factors in isolation, failing to capture their interdependencies (12, 23, 24). This fragmented approach limits their effectiveness in developing cities, where sustainability challenges are inherently interconnected(25) (26). Thus, recent studies emphasize the need for context-sensitive sustainability indices that align with local governance structures and development priorities (24, 27-29).
Challenges in Adapting Global Sustainability Models to Developing Nations: Although international sustainability frameworks provide a standardized approach, their applicability in developing countries remains problematic due to governance limitations, inconsistent data availability, and financial constraints (29-31). A key challenge is the institutional gap, as many frameworks assume the presence of strong regulatory mechanisms, which are often weak or absent in resource-limited environments (32-34). Additionally, sustainability data in developing nations is often fragmented and unreliable(35), making it difficult to apply models that depend on quantitative assessments (36).
Another limitation is the economic feasibility of implementing sustainability policies, as many cities lack the financial resources to support large-scale sustainability interventions (37, 38). Moreover, global models often overlook informal urbanization patterns, which are a defining characteristic of many cities in the Global South, where unregulated settlements and infrastructure deficiencies pose unique sustainability challenges (25, 39). These challenges underscore the urgent need for adaptable sustainability assessment frameworks that consider local urban governance, financial constraints, and informal urbanization patterns (40, 41).
A Novel Sustainable Urban Planning Index for Developing Countries: While conventional sustainability assessment frameworks offer valuable benchmarks, they frequently fall short when applied to the dynamic urban contexts of developing nations.(42) These cities contend with challenges such as governance gaps, limited financial resources, and pervasive informal urbanization—factors that demand planning tools that are both adaptive and context‐sensitive(43). Traditional models tend to evaluate sustainability indicators in isolation and in a static, retrospective manner, which does not fully capture the complex interdependencies inherent in urban systems(43, 44).
In response to these limitations, recent research has advocated for the development of a Sustainable Urban Planning Index (SUPI)(45). SUPI is designed to serve dual functions: as a performance evaluation tool and as a master plan assessment instrument. the development of a Sustainable Urban Planning Index (SUPI), SUPI provides a holistic framework for assessing urban development(45). This integrated approach enables policy-implementing bodies to evaluate the effectiveness of current master plans while identifying gaps and inefficiencies that may hinder sustainable growth(46).
Moreover, SUPI supports periodic reassessment of urban plans, allowing decision-makers to refine planning and execution strategies proactively. In doing so, it bridges the gap between global benchmarks and local realities, ensuring that all critical indicators necessary for the sustainable development of cities in developing countries are systematically incorporated(43, 44). Ultimately, this adaptive framework empowers urban policymakers to make informed adjustments over time, fostering more sustainable and resilient urban environments (42).
Multi-Criteria Decision-Making (MCDM) in Urban Sustainability Assessment: Given the complex nature of sustainability assessment, scholars have increasingly turned to Multi-Criteria Decision-Making (MCDM) techniques to systematically rank and prioritize sustainability indicators (47). These methods facilitate data-driven decision-making by integrating expert opinions and structuring sustainability factors into hierarchical ranking frameworks (48).
Analytical Hierarchy Process (AHP) in Sustainability Assessments: The Analytical Hierarchy Process (AHP), introduced by Saaty (1990), is a widely used multi-criteria decision-making technique in urban planning, infrastructure evaluation, and governance. It allows for pairwise comparisons of sustainability indicators, ensuring a structured ranking based on relative importance. AHP also incorporates Consistency Ratio (CR) validation, which enhances the logical coherence of expert assessments. The method has been extensively applied across various urban sectors, including transport planning, energy efficiency, and environmental governance (49). However, despite its effectiveness, AHP becomes computationally intensive when dealing with large-scale indicator datasets, posing challenges for its application in urban planning within developing nations (50).
Relative Importance Index (RII) as a Simplification Tool: The Relative Importance Index (RII) simplifies expert-based assessments into numerical rankings, reducing computational complexity (51). It is particularly useful in data-scarce environments, ensuring reliable decision-making (51). RII enables direct expert input integration, eliminating the need for complex calculations. This makes it an efficient tool for urban sustainability evaluations and planning.
Recent studies emphasize the effectiveness of hybrid methodologies that integrate AHP and RII, offering a structured yet flexible approach to sustainability assessment. AHP is utilized to establish sectoral sustainability priorities, ensuring that decision-making aligns with urban planning needs. Meanwhile, RII is applied for intra-sectoral indicator ranking, providing a more detailed evaluation of sustainability factors (52). These hybrid models enhance adaptability, making them particularly useful in data-scarce environments and cities with institutional constraints, where traditional assessment methods may be challenging to implement (53).
The Need for a Context-Specific Sustainability Index: Despite advancements in urban sustainability assessment models, existing frameworks often overlook governance structures, informal urbanization, and infrastructure limitations in developing nations. While some models attempt to contextualize global benchmarks, their adaptability and practical implementation remain limited (54). To address these challenges, scholars advocate for tailored sustainability indices that incorporate hybrid MCDM models (AHP + RII) for refined indicator ranking, adapt global benchmarks to local urban constraints, and provide structured decision-support tools for policymakers (40, 47, 54, 55). This study introduces the Sustainable Urban Planning Index (SUPI), a framework that integrates sectoral and sub-indicator weightings, creating a hierarchical sustainability ranking system that aligns with global benchmarks while addressing localized urban planning needs.
Summary: The literature highlights the challenges of adapting global sustainability models to developing nations, emphasizing governance gaps, unreliable data, and financial constraints as major obstacles. While MCDM techniques such as AHP and RII have been widely applied in sustainability ranking models, their effectiveness in developing contexts requires further refinement through hybrid methodologies. This study builds on previous research by introducing SUPI, a sustainability index that integrates global benchmarks with localized urban planning considerations. By incorporating a hybrid AHP-RII framework, SUPI offers a flexible decision-making model that enhances sustainability assessment, policy implementation, and strategic urban planning in resource-constrained environments. Future research should focus on empirical validation of SUPI through case studies, ensuring its effectiveness in diverse urban settings.
METHODOLOGY
A structured and sequential research design was adopted to develop the Sustainable Urban Planning Index (SUPI), integrating multiple analytical techniques to ensure a comprehensive evaluation framework. The methodology follows a multi-criteria decision-making approach (MCDM), combining Relative Importance Index (RII), Fractional Ranking, and Analytical Hierarchy Process (AHP) to systematically rank and weight sustainability indicators. A carefully selected panel of experts was engaged at different stages, ensuring both policy-level validation and sectoral prioritization through expert-driven evaluations.
To establish a robust foundation for SUPI, 64 urban planning and policy experts were consulted through structured surveys to determine the importance levels of 30 sustainability indicators, forming the basis for RII, fractional ranking, and AHP pairwise comparisons. Additionally, 20 high-level government officials—responsible for approving and implementing master plans at federal, provincial, and local levels—were engaged in sectoral and indicator selection, finalizing the most effective indicators through a long-term consultation process. The findings from these expert consultations were synthesized to derive sectoral weights and rankings, ultimately converging into a structured SUPI model. To ensure consistency and reliability, pairwise comparisons of seven sectors were conducted using AHP, followed by consistency ratio (CR) checks. The methodological steps employed, analytical processes undertaken, and the key outputs obtained are summarized in Figure 1. The structured questionnaire used for assessing indicator importance is annexed as Annexure A, while the expert panel survey for sectoral validation is annexed as Annexure B. This methodology ensures a comprehensive, expert-driven, and statistically validated framework for sustainable urban planning assessment. Figure 1 outlines the employed methods, processes, and outcomes that led to the final development of SUPI.
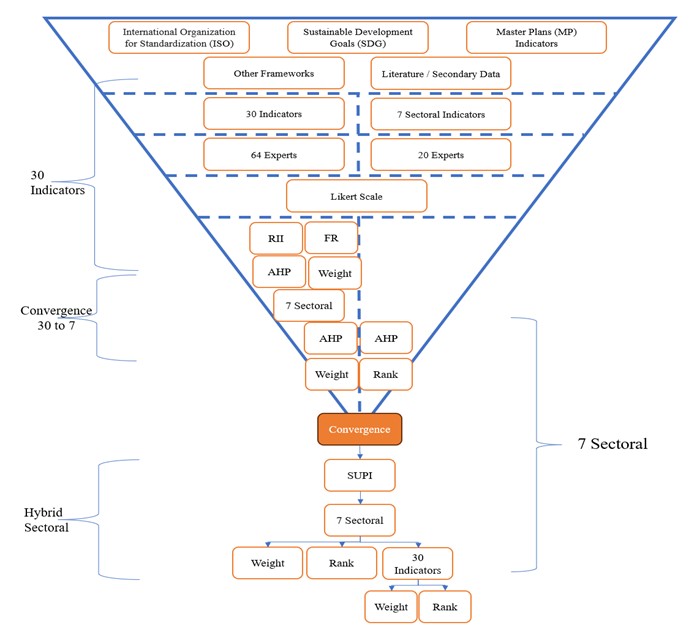
Figure 1 Methodological Framework for the Development of the Sustainable Urban Planning Index (SUPI)
The methodology consists of four key stages:
- Indicator Identification and Categorization – Reviewing global sustainability frameworks, deriving relevant indicators, and categorizing them into sectoral domains.
- Expert Validation and Prioritization – Engaging urban planning professionals to refine and validate the importance of sustainability indicators.
- Ranking and Weighting of Indicators – Applying Relative Importance Index (RII), Analytical Hierarchy Process (AHP), and Fractional Ranking to establish a structured ranking system.
- Hybrid Weighting and Final SUPI Computation – Integrating sectoral and sub-indicator weightings to develop a decision-support tool for master plan evaluation.
The development of the Sustainable Urban Planning Index (SUPI) bridges the gap between global sustainability frameworks and localized urban planning needs, ensuring that the index is structured with data-driven precision and strategic relevance. By integrating quantitative ranking techniques and expert-driven weighting methodologies, SUPI is designed as a context-sensitive framework, aligning international best practices with the unique governance, infrastructure, and sustainability challenges of developing countries.
Indicator Identification and Categorization
This study is fundamentally guided by the question: What are the most relevant sustainability indicators for urban planning in developing countries? To address this, a structured methodology was employed that integrates an exhaustive literature review with targeted expert consultations, ensuring alignment with global sustainability benchmarks while incorporating context-specific insights from developing urban environments. An extensive review of internationally recognized sustainability assessment models, standards, and evaluation frameworks was conducted to extract key urban planning indicators. This analysis included widely adopted global benchmarks such as ISO 37120 (Sustainable Cities and Communities), Sustainable Development Goal 11 (SDG 11), and LEED for Neighborhood Development (LEED-ND), along with multiple master plan evaluation criteria. These frameworks provided essential insights into urban service delivery, sustainable urbanization, governance, housing, transportation, and environmental management, ensuring that the identified indicators captured the multidimensional aspects of urban sustainability.
Following this detailed review, indicators were screened based on their relevance to sustainability challenges in developing countries, their measurability and feasibility for integration into policy evaluation models, and their alignment with global benchmarks while ensuring adaptability to local urban conditions. To further refine the indicator list and ensure its contextual relevance, a structured expert consultation process was implemented. Two sets of experts were engaged: a panel of 20 key government experts responsible for approving and validating development plans at federal, provincial, and local levels, who participated in an iterative process to finalize the most effective sustainability indicators, and a broader panel of 64 urban planning and policy experts selected through purposive sampling. The latter group assessed the importance of 30 sustainability indicators through structured surveys and focus group discussions, ensuring that the final selection was grounded in both theoretical rigor and practical relevance.
Through extensive deliberations and expert validation, a structured set of 30 sustainability indicators was finalized and categorized into seven sectoral domains, forming a hierarchical and comprehensive assessment framework. These sectors include Physical Characteristics, Socio-Economic Factors, Land Use & Urban Form, Housing, Transportation, Environmental & Infrastructure, and Governance & Institutional Efficiency. By integrating literature-driven insights with expert validation, this approach ensures that the selected indicators are both theoretically robust and practically applicable for evaluating urban sustainability, particularly in resource-constrained environments where conventional sustainability frameworks often fail to provide context-specific solutions.
Expert Validation and Prioritization
To ensure the credibility and applicability of sustainability indicators, a rigorous expert-driven validation process was conducted. This study engaged two distinct groups of experts to establish a robust and context-sensitive selection of sustainability indicators.
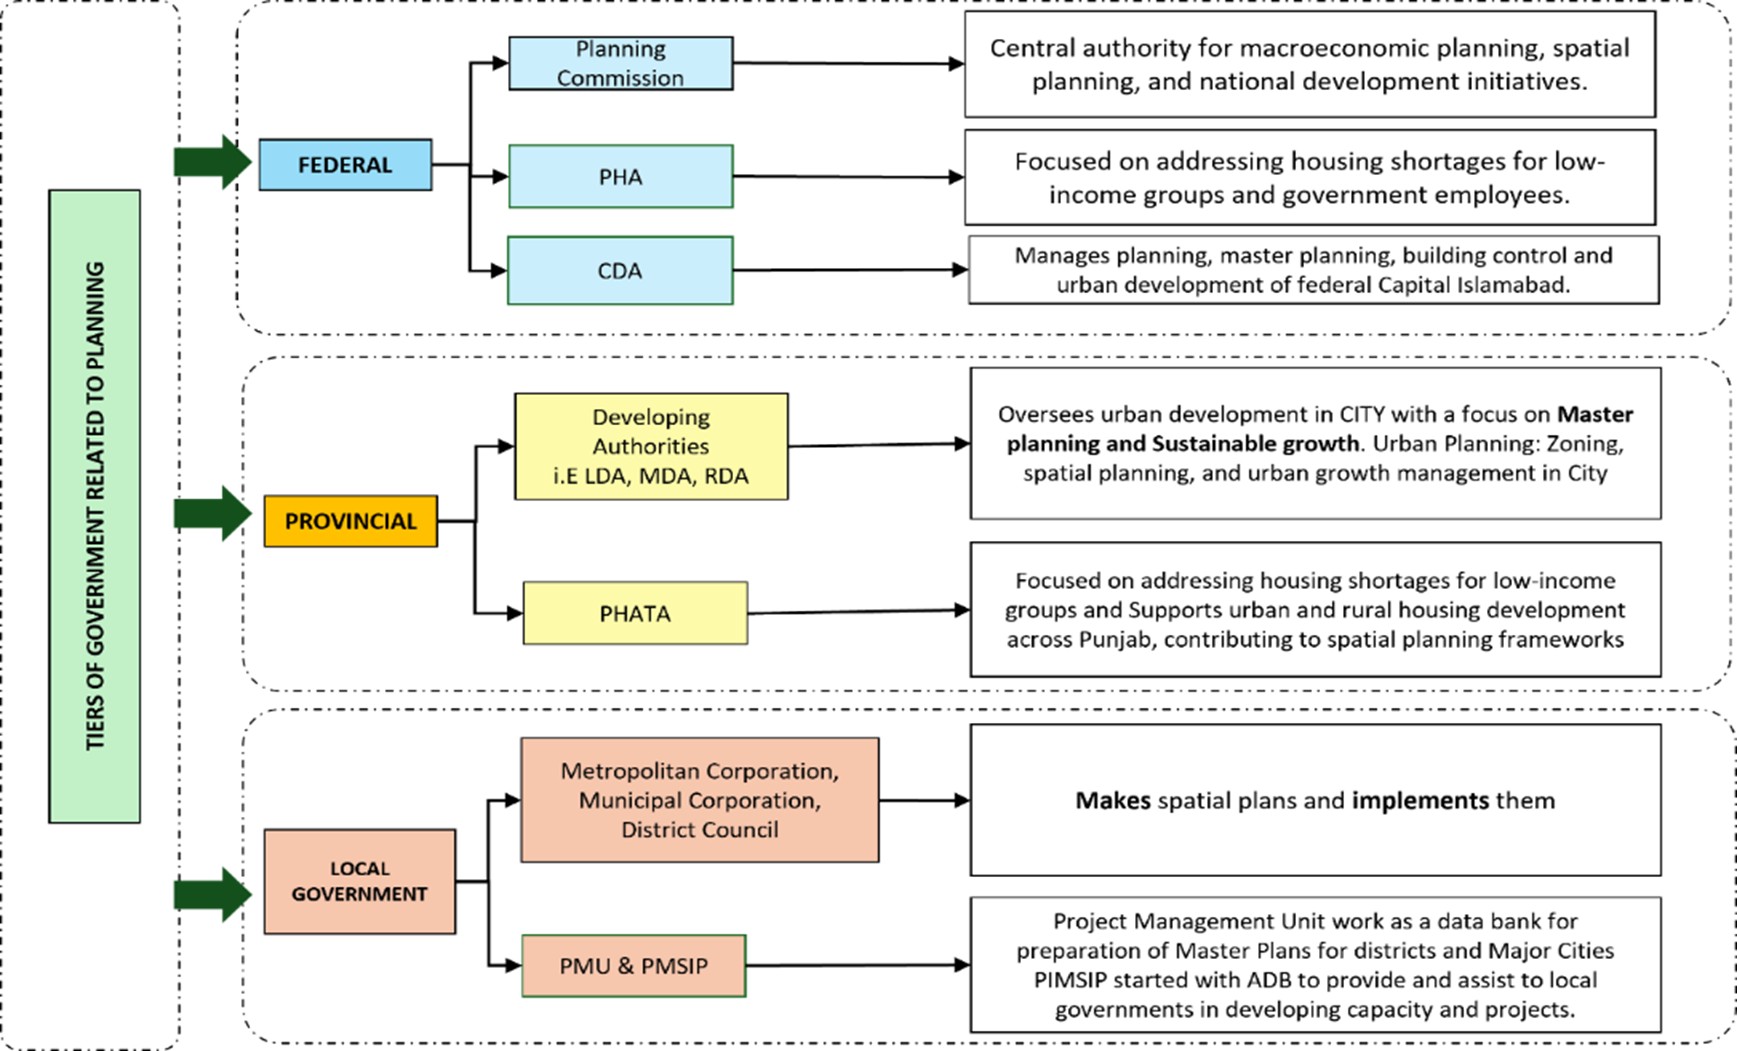
Figure 2 Key Experts Involved in Validating and Approving Development Plans
The first group comprised 20 high-level government experts, selected using a purposive sampling approach from federal, provincial, and local authorities responsible for approving and validating development plans. These decision-makers provided critical insights into refining and validating sustainability indicators, ensuring their practical relevance for urban planning in developing countries. Through an extensive and iterative consultation process, they collaborated to develop and refine sectoral categories and identify the most effective indicators as supported by the literature. Additionally, they conducted pairwise comparisons of the seven identified sectors using the Analytical Hierarchy Process (AHP) to derive precise sectoral weights and rankings (Annexure B).
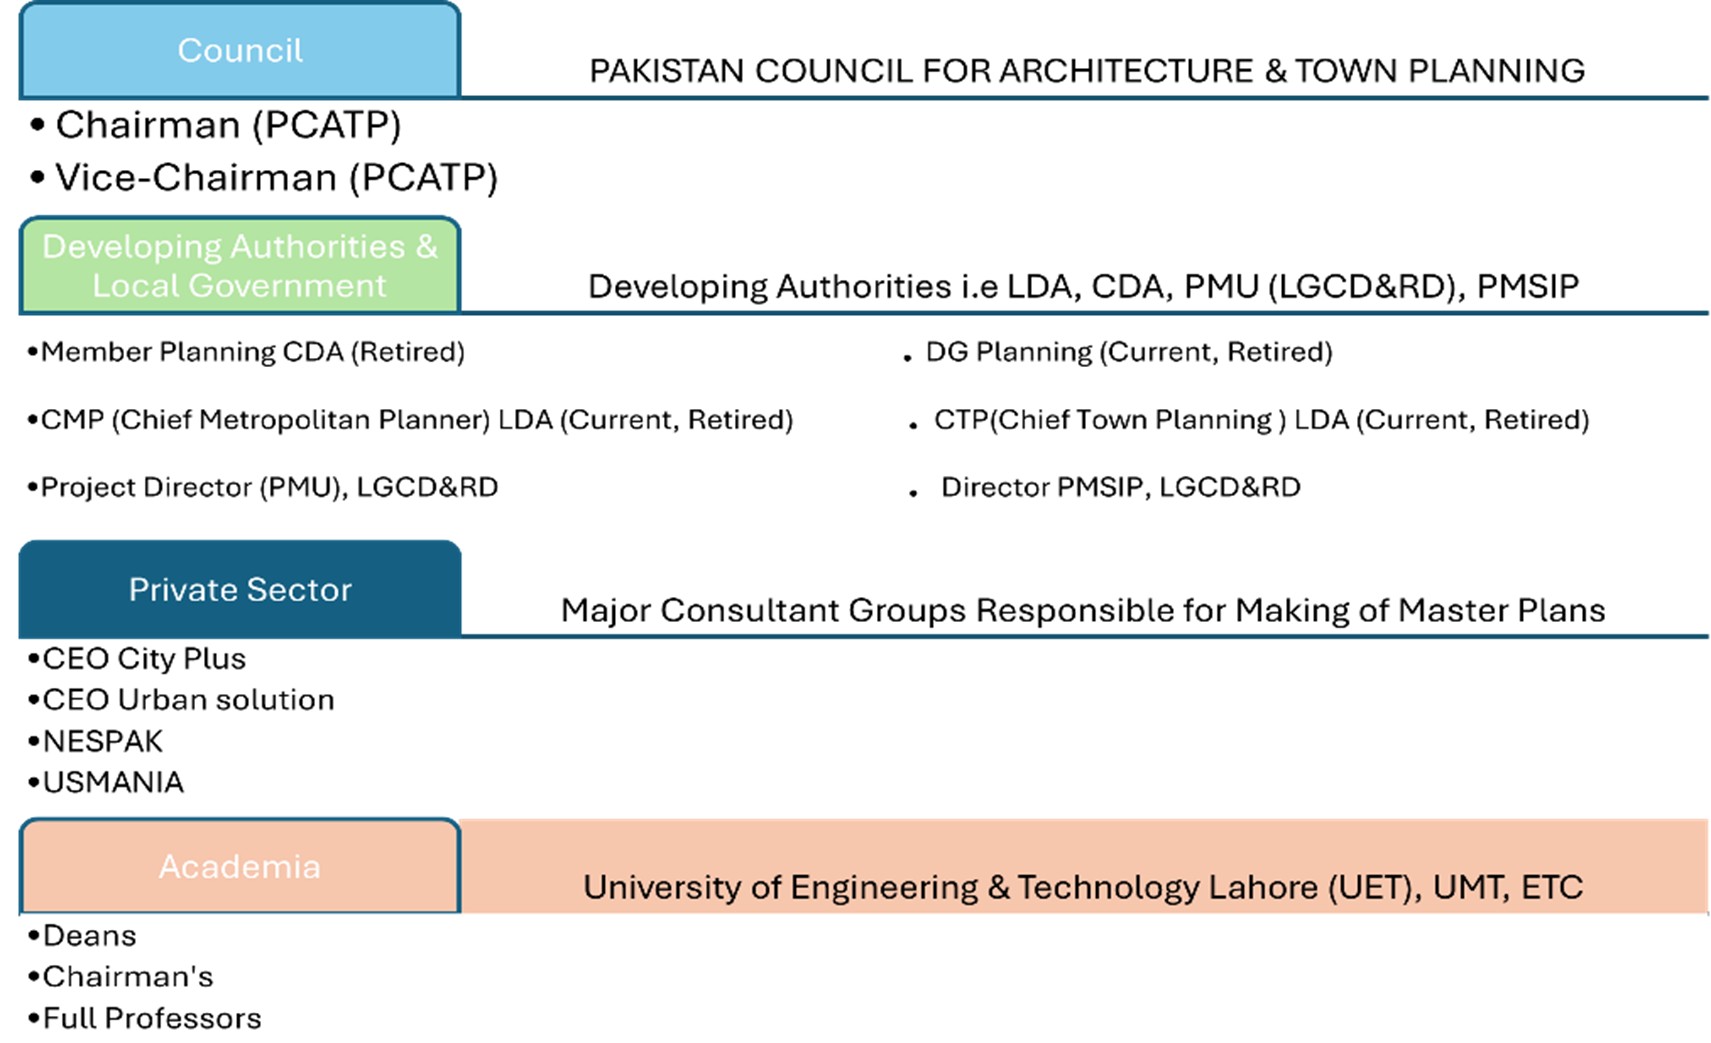
Figure 3 Experts Responsible for Formulating and Executing Development Plans
The second group comprised a broader panel of 64 experts, specializing in urban planning, policymaking, governance, and academic research. These experts, also selected through purposive sampling, contributed a diverse and multidisciplinary perspective, ensuring that the Sustainable Urban Planning Index (SUPI) accounted for both theoretical frameworks and real-world implementation challenges. The panel was tasked with completing the structured questionnaire annexed in Annexure A, which focused on assessing the importance level of 30 sustainability indicators. Their evaluations were employed in three key analytical processes:
- Relative Importance Index (RII),
- Fractional Ranking (FR),
- Analytical Hierarchy Process (AHP) pairwise comparisons.
These methods facilitated the convergence of indicator weights into sectoral rankings, forming the multi-criteria decision-making foundation for the SUPI model. This systematic approach ensured that the developed index accurately reflects sectoral priorities, providing a structured and objective assessment framework for sustainable urban planning in developing countries.
Methodological Framework for SUPI Development: A structured multi-criteria decision-making approach was employed through a sequential and interlinked methodology to develop the Sustainable Urban Planning Index (SUPI) as an evaluation framework. As summarized in Figure X, this approach integrates global sustainability frameworks, expert validation, and statistical ranking techniques to ensure a systematic and data-driven assessment process.
Two distinct datasets were analyzed to establish a robust foundation for the SUPI model:
The first dataset focused on the importance ranking of 30 sustainability indicators, evaluated by 64 experts using Relative Importance Index (RII), Fractional Ranking (FR), and AHP.
The second dataset involved a more detailed AHP-based assessment of sectoral importance, conducted with 20 high-level government experts responsible for strategic urban planning decisions.
The findings from both datasets were systematically converged, ensuring a balanced integration of expert consensus and statistical rigor. This approach enabled the development of a structured SUPI model, which accurately ranks sustainability priorities and provides policymakers with a quantifiable, adaptable decision-support tool for urban sustainability assessment.
Through this rigorous expert validation and structured methodology, the SUPI framework ensures that sustainability efforts in developing countries are empirically validated, contextually relevant, and strategically aligned with both global benchmarks and local urban development realities.
Ranking and Weighting of Indicators
A structured ranking system was developed using Relative Importance Index (RII), Analytical Hierarchy Process (AHP), and Fractional Ranking (FR) to ensure transparency and statistical rigor. The 64-expert dataset was analyzed through RII and FR to determine the relative importance of 30 sustainability indicators, while AHP was applied to both 30 indicators and 7 sectoral indicators for prioritization. The integration of these methods provided a robust weighting framework, balancing expert consensus with quantitative validation.
Relative Importance Index (RII) for Indicator Ranking
The Relative Importance Index (RII) method was utilized to quantify expert evaluations and prioritize indicators based on their perceived significance. Experts provided their assessments using a four-point Likert scale, categorizing indicators as Very Unimportant (1), Unimportant (2), Important (3), and Very Important (4). This structured approach ensured a systematic ranking of indicators, capturing expert consensus and enabling a data-driven prioritization process for sustainability evaluation.
The RII score for each indicator was calculated as:
RII = (∑W)/(A × N)
The Relative Importance Index (RII) calculation was based on a structured formula where W represented the weight assigned to each response category (ranging from 1 to 4), N denoted the number of responses in each category, A indicated the maximum scale value (4), and Nₜ referred to the total number of responses. This approach ensured a systematic quantification of expert opinions, facilitating the prioritization of sustainability indicators based on their assessed significance.
Fractional ranking
Indicators with identical RII scores were fractionally ranked to ensure fair prioritization. Used to resolve tied RII values and ensure fair indicator prioritization.
Rank (Χ) = Σ (Count (Χi ) .Ι(Χ≤Χi ))
The Fractional Ranking (FR) method was applied to ensure a fair prioritization of indicators, particularly in cases where multiple indicators received identical scores. In this approach, ΣW represents the sum of weights assigned to each indicator by respondents, A denotes the maximum scale value (4 in a 1–4 Likert scale), and N corresponds to the total number of respondents. Fractional ranking was used to assign equal priority to indicators with the same scores, preventing ranking biases and ensuring a transparent and statistically balanced evaluation.
Analytical Hierarchy Process (AHP) for Weighting
The Analytical Hierarchy Process (AHP) was employed to determine the relative weightings of each sustainability indicator. This process began with the construction of a reciprocal matrix through pairwise comparisons, where each indicator was systematically evaluated against every other in terms of its importance.
Table 3.1: Example of Pairwise Comparison Between Transportation and Other Sectoral Indicators
![]()
Following this, eigenvalues were computed from the matrix to derive normalized weightings, providing a quantitative basis for the relative significance of each indicator.
Table 3.2: Saaty’s 1–9 Scale for Relative Importance in AHP (1994)
| Scale | Degree of importance | Reciprocal (decimal) |
| 1 | Equally important | 1 (1.000) |
| 2 | Equally to moderately important | 1/2 (0.500) |
| 3 | Moderately important | 1/3 (0.333) |
| 4 | Moderately to strongly important | 1/4 (0.250) |
| 5 | Strongly important | 1/5 (0.200) |
| 6 | Strongly to very strongly important | 1/6 (0.167) |
| 7 | Very strongly important | 1/7 (0.143) |
| 8 | Very strongly to extremely important | 1/8 (0.125) |
| 9 | Extremely important | 1/9 (0.111) |
Finally, the logical coherence of the experts’ judgments was verified by calculating the Consistency Ratio (CR), ensuring that the pairwise comparisons were sufficiently consistent. This rigorous application of AHP ensured that the sustainability indicators were weighted accurately, thereby underpinning the robustness and reliability of the SUPI model in the context of urban planning for developing countries.
CR = CI/RI
Where CR is Consistency Ratio and CI is Consistency Index, calculated as:
CI = λ(max -n)/(n- 1)
Where λmax is Maximum eigenvalue of the pairwise comparison matrix, and n: Number of indicators while RI is Random Index, based on the size of the comparison matrix (Saaty provides standard RI values).
Hybrid Weighting and Final SUPI Computation
To integrate sectoral and sub-indicator rankings, a hybrid weighting model was applied. The final Hybrid Weight (HW) for each sustainability indicator was derived by integrating the Relative Importance Index (RII) and Analytical Hierarchy Process (AHP) sectoral weights to ensure a balanced and statistically validated ranking system. The formula used for computing HW is:
ΗWι= (RIIi/(∑RIIsector ))Χ AHPsector
Where:
The final hybrid weight (HW_i) for each indicator is calculated by normalizing its Relative Importance Index (RII_i) within its sector (∑ RII_sector) and adjusting it using the sectoral weight from the Analytical Hierarchy Process (AHP_sector). This approach ensures a balanced weighting system that maintains intra-sector comparability while reflecting the overall priority of each sector in urban sustainability assessment.
This methodological approach ensured that sectors identified as high priority received proportionally greater weights in the final ranking, preserving the integrity of sectoral significance in the evaluation process. To establish a balanced and statistically robust ranking of urban planning criteria, a hybrid Analytical Hierarchy Process (AHP) weighting approach was employed, integrating two independently derived AHP-based priority weight tables while maintaining sectoral consistency.
The process commenced with the normalization of AHP weights from both datasets to ensure comparability. Given that pairwise comparisons in AHP can introduce variations due to subjective expert judgments, normalizing each weight set to sum to one mitigated discrepancy arising from differences in expert evaluations. This step was critical in enhancing methodological rigor and ensuring a standardized ranking framework.
To align both rankings, a hybrid weighted averaging approach was implemented using an equal 0.5:0.5 weighting ratio, assigning equal influence to both datasets. This approach balanced sectoral priorities while preventing the overemphasis of any single criterion, ensuring a structured multi-criteria decision-making (MCDM) framework that integrates expert-driven insights with statistical validation. The final hybrid weights were ranked according to their relative importance, providing a comprehensive and methodologically sound foundation for sustainable urban planning assessment.
RESULT AND DISCUSSION
The results of the data analysis are presented through structured ranking and weighting methodologies, including Relative Importance Index (RII), Analytical Hierarchy Process (AHP), and Fractional Ranking (FR). A comparative assessment was conducted to evaluate the significance of sectoral indicators in urban sustainability, measuring their relative contributions to sustainable master planning. The expert-based analysis utilized AHP to establish indicator weights, ensuring logical consistency through consistency ratio (CR) validation. Additionally, inter-rater reliability assessments were performed to verify expert consensus on indicator rankings. The findings provide a structured evaluation framework, offering insights into the effectiveness of urban master plans in developing countries.
Indicator Identification and Categorization
The study successfully identified and categorized sustainability indicators, ensuring their alignment with both global sustainability benchmarks and local planning requirements. The results confirm that the selected indicators comprehensively address key aspects of urban sustainability, including land use efficiency, governance, infrastructure resilience, and environmental management. This structured categorization provides a clear framework for evaluating and ranking sustainability priorities, forming the basis for assessing master plan execution and sustainable urban development strategies.
The table presents 30 sustainability indicators classified under seven sectoral domains, each contributing to the assessment of urban sustainability and master plan efficiency. These indicators were rigorously selected through expert consultation and sectoral analysis, ensuring their relevance to sustainable urban development, governance efficiency, environmental resilience, and infrastructure performance.
The Physical Characteristics sector includes key indicators such as land development, climate resilience, and groundwater management, emphasizing the importance of planned urban expansion and ecological sustainability. Socio-Economic indicators highlight employment opportunities, urban growth, and income equity, underlining their role in economic stability and inclusive urbanization. The Land Use and Urban Form category prioritizes mixed-use development, land conservation, and transport accessibility, reinforcing efficient spatial planning and land utilization.
In the Housing sector, the focus is on affordability, density regulations, and informal settlement management, which are critical to urban housing accessibility and population distribution. Transportation indicators emphasize mobility integration, congestion reduction, and accessibility, reinforcing the need for well-connected and sustainable transport networks. Environmental indicators such as carbon reduction, waste management, and flood resilience stress the significance of climate adaptation and resource efficiency. Lastly, Governance & Institutional Efficiency covers public participation, transparency, and digital governance, which are fundamental to effective urban management and service delivery.
This table forms the core structure of the Sustainable Urban Planning Index (SUPI) framework, providing a structured reference for evaluating and ranking sustainability priorities. These indicators serve as a practical tool for urban master plan assessment, framework development, and sustainability evaluation models, ensuring that planning strategies align with both global sustainability goals and localized urban challenges.
Table 4.1: Sectoral Indicators Forming the Basis of the Sustainable Urban Planning Index (SUPI)
| Sectoral Indicator | Indicator | Indicator Description | Label | Reference |
| Physical Characteristics | Land Development & Slope Stabilization | Land Development Percentage & Stabilize Slopes | PSS | (56) |
| Urban Climate Resilience | Urban Heat Island reduction, stormwater management | UHIR | (57) | |
| Groundwater and Water Quality Management | Groundwater recharge, quality compliance, water balance | GWB | (58) | |
| Green Infrastructure and Biodiversity | Green cover, Accessibility, Biodiversity, Air quality impact | GCA | (59) | |
| Socio-Economic | Urban Growth and Demographics | Growth rate, Urban density, Urbanization rate | GRUD | (60) |
| Employment and Economic Opportunity | Employment rate, Job creation, Sectoral distribution | ERJC | (61) | |
| Socioeconomic Equity | Income / Wealth Difference, Median income, Poverty rate | IWDMI | (62) | |
| Land Use and Urban Form | Land Use and Efficiency | Land use efficiency, Employment density, Revenue generation | LUED | (63) |
| Environmental Compliance and Transport Accessibility | Land utilization, Environmental compliance, Transport proximity | LUEC | (63) | |
| Land Conservation and Agricultural Preservation | Vacant land reduction, Agricultural land preservation | VLDALP | (63) | |
| Mixed-Use Development and Density | FAR, Mixed-use ratio | FARM | (64) | |
| Housing | Housing Affordability and Ownership | Housing affordability index, Supply, Ownership rate | HAISOR | (65) |
| Housing Density and Accessibility | Housing density, Affordability ratio, Access to services | HRAR | (66) | |
| Compact Development and Residential Accessibility | Residential/population density, Compact development ratio, Transport access | PDCD | (67) | |
| Informal Settlement and Resettlement | Informal settlement regularization, Access to services, Resettlement success | ISRA | (68) | |
| Vertical Housing Compliance | Proportion of high-rises, Compliance with zoning, Vertical housing ratio | PHCZ | (69) | |
| Housing Utilization and Overcrowding | Housing unit density, Overcrowding rate, Land use efficiency for housing | HUDOR | (70) | |
| Transportation | Transportation Accessibility | Accessibility coverage, Service frequency, Ridership growth | ACSFF | (71) |
| Traffic and Safety Management | Traffic flow efficiency, Congestion index, Accident rate | TFECI | (71) | |
| Active and Sustainable Mobility | Path coverage, Usage rate, Bicycle parking, Connectivity index | PCUB | (72) | |
| Integrated and Sustainable Transportation | Integration, sustainability, investment, emissions reduction | ISIELL | (73) | |
| Environment | Carbon Reduction and Tree Canopy | Emissions reduction, Tree canopy cover | SWAG | (74) |
| Water Resource Management | Safe water access, Groundwater compliance, Reuse rate, Loss rate | SWAGC | (75) | |
| Waste Management | Waste collection, Recycling rate, Landfill compliance, Composting | WCRL | (76) | |
| Renewable Energy and Energy Efficiency | Outages/year, Renewable energy share, Energy efficiency | RES | (77) | |
| Flood Resilience and Stormwater Management | Coverage, Flood-prone reduction, Stormwater capture rate | CFR | (78) | |
| Governance & institutional efficiency | Governance and Public Participation | Consultation coverage, Participation rate, Inclusivity index | CC | (77) |
| Transparency and Anti-Corruption | Public plan access, Budget transparency, Corruption perception | PPABT | (79) | |
| Service Efficiency and Resource Management | Service delivery time, Revenue collection, HR capacity | SDTRC | (80) | |
| Digital Governance and User Experience | Digital service coverage, User satisfaction, System uptime | DSC | (81) |
Expert Representation in Sustainability Indicator Evaluation
The Figure presents the organizational and academic background of the 64 experts involved in the evaluation and ranking of sustainability indicators. These experts were selected from local government bodies, urban development authorities, private consultancy firms, academia, and professional institutions, ensuring a diverse and multidisciplinary approach to urban sustainability assessment. Their qualifications range from bachelor’s and master’s degrees to PhDs, reflecting a high level of expertise in urban planning, governance, and environmental management.
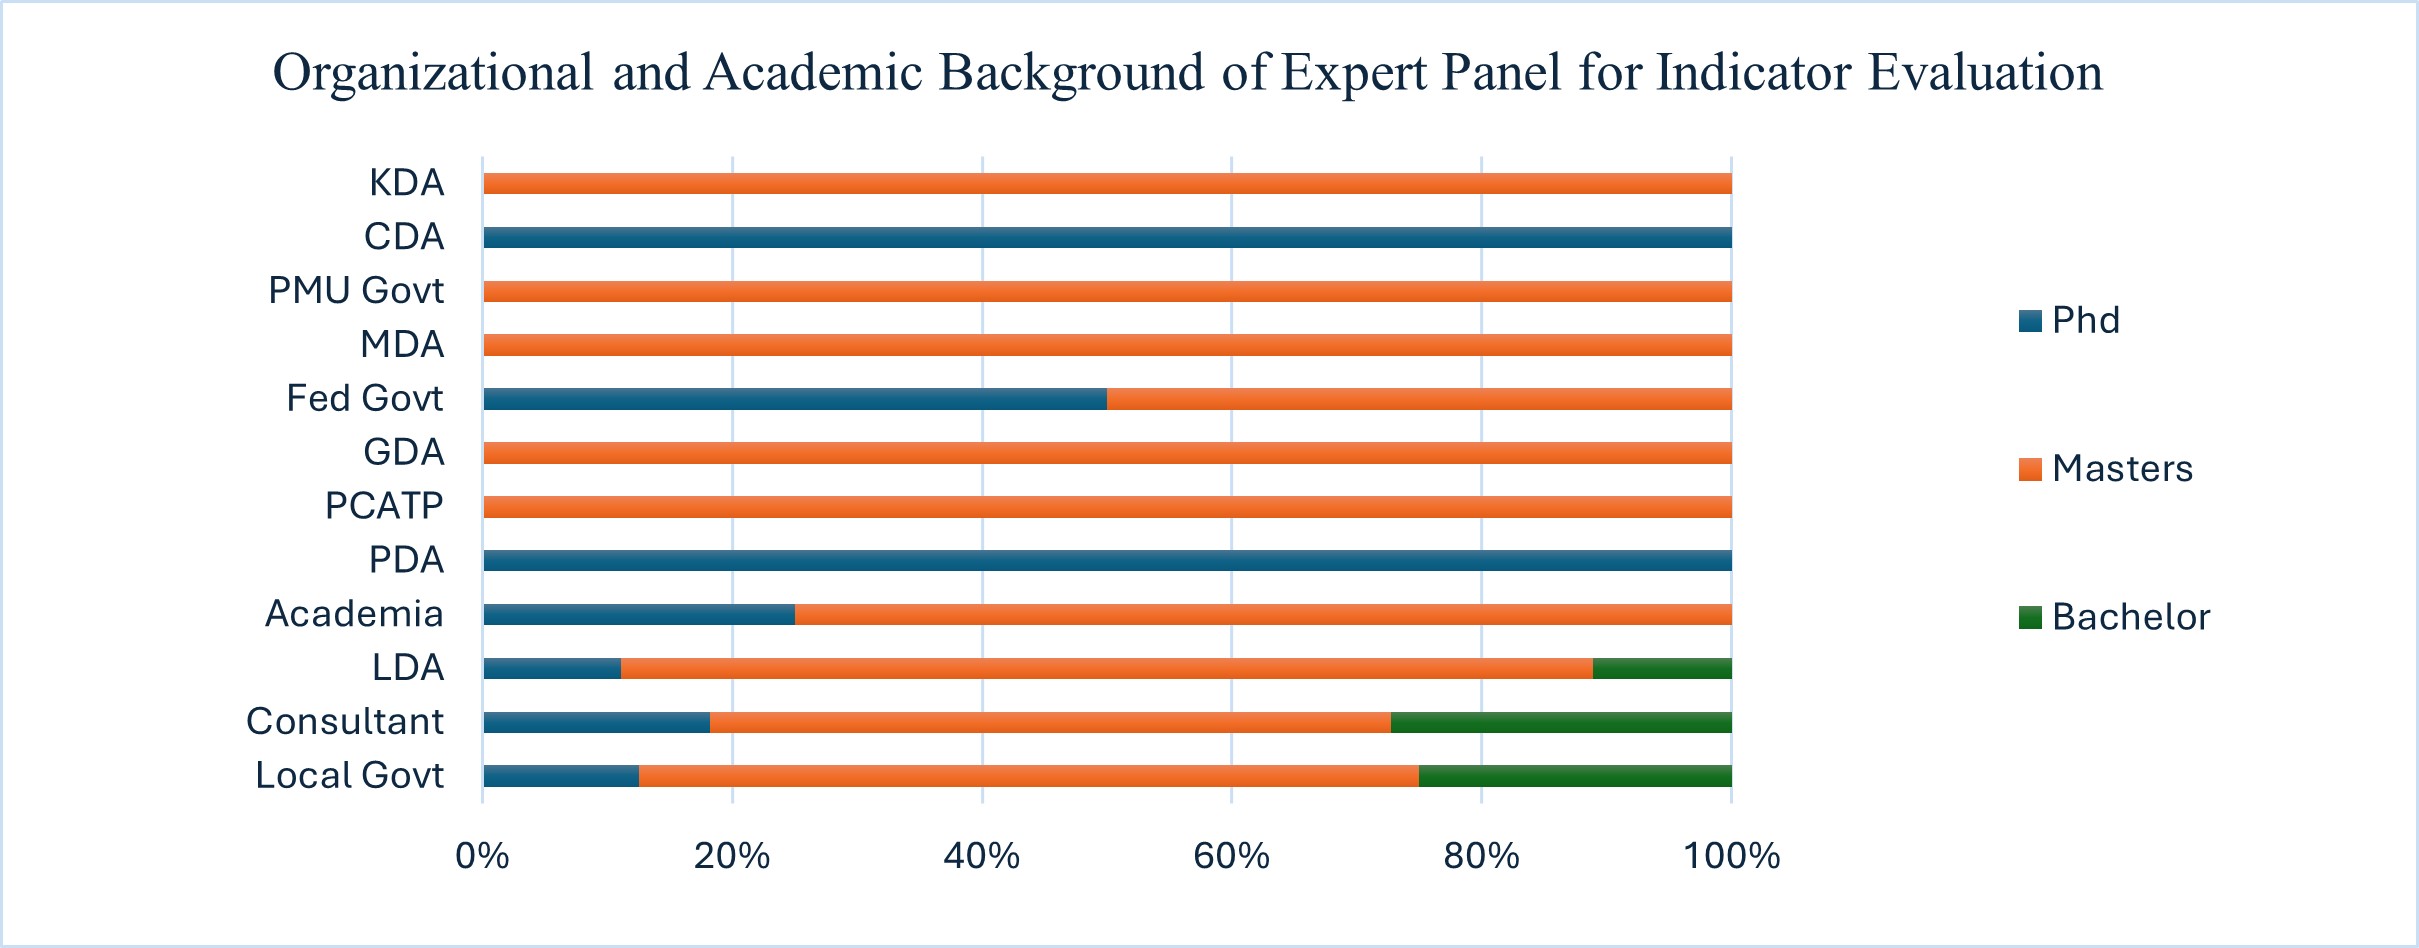
Figure 4 : Organizational and Academic Background of Expert Panel for Indicator Evaluation
The largest representation comes from Local Government (24 experts), emphasizing the importance of practitioners involved in policy implementation and municipal governance in shaping sustainability frameworks. Consultants (11 experts) and urban development authorities such as LDA (9 experts) and PDA, PCATP, GDA, and CDA (smaller groups) contribute specialized knowledge in planning, infrastructure, and regulatory frameworks. The inclusion of academia (8 experts) ensures that the indicator selection and ranking process is grounded in research-based methodologies. The results reflect a balanced mix of policymakers, practitioners, researchers, and private-sector consultants, providing a comprehensive assessment of sustainability indicators. The diversity of qualifications and organizational backgrounds enhances the credibility of the indicator ranking and weighting methodology, ensuring that both theoretical and practical insights were incorporated.
These findings demonstrate that the expert selection process was rigorous and inclusive, reinforcing the robustness of the Sustainable Urban Planning Index (SUPI) framework. The participation of various institutional stakeholders ensures that the indicators used for the development of the SUPI Index will serve as an evaluation model for urban sustainability in developing countries, helping cities assess, compare, and improve their sustainability performance based on data-driven insights.
Ranking of 30 Indicators Based on Expert Evaluation Using RII and AHP by Level of Importance
This table 4.2 presents the ranking of 30 sustainability indicators based on expert evaluations using the Relative Importance Index (RII). Experts rated each indicator across four importance levels, and the RII scores determined their ranking and priority weight. The highest-ranked indicator, Urban Growth and Demographics (GRUD, RII = 0.8633, Rank 1), highlights its critical role in urban sustainability. Other top indicators include Digital Service Coverage (DSC, Rank 2) and Groundwater Management (GWB, Rank 3), emphasizing the importance of technological advancement and water security. Lower-ranked indicators, such as Housing Overcrowding (HUDOR, Rank 16) and Land Development & Slope Stabilization (PSS, Rank 15), indicate less immediate influence compared to governance, environmental, and infrastructure priorities. The ranking provides a structured framework for urban sustainability assessment, ensuring that high-impact indicators are prioritized in evaluation models for developing countries.
Pairwise Comparison of Sustainability Indicators
The pairwise comparison of 30 sustainability indicators was conducted to evaluate their relative importance in urban sustainability assessment. Each value in the matrix represents the comparative weight assigned to one indicator over another, based on expert evaluations. This structured comparison ensures a systematic ranking approach, forming the basis for final weight assignment. Please refer to Table [4.3] below for detailed pairwise comparisons.
Table 4.2: Ranking of 30 Sustainability Indicators Based on Relative Importance Index (RII) and Expert Evaluation
| Variable | Description | VUNIMP | UNIMP | IMP | VIMP | TOTAL | Weight | RII | Rank | Priority Weight |
| PSS | Percentage for Land Development & Stabilize Slopes | 1 | 6 | 44 | 13 | 64 | 197 | 0.7695 | 15 | 0.031799 |
| UHIR | Urban Heat Island reduction, stormwater management | 1 | 11 | 28 | 24 | 64 | 203 | 0.7930 | 11 | 0.03277 |
| GWB | Groundwater recharge, quality compliance, water balance | 0 | 5 | 30 | 29 | 64 | 216 | 0.8438 | 3 | 0.034869 |
| GCA | Green cover, Accessibility, Biodiversity, Air quality impact | 1 | 3 | 35 | 25 | 64 | 212 | 0.8281 | 5 | 0.03422 |
| GRUD | Growth rate, Urban density, Urbanization rate | 1 | 1 | 30 | 32 | 64 | 221 | 0.8633 | 1 | 0.035675 |
| ERJC | Employment rate, Job creation, Sectoral distribution | 0 | 6 | 42 | 16 | 64 | 202 | 0.7891 | 12 | 0.032609 |
| IWDMI | Income / Wealth Difference, Median income, Poverty rate | 1 | 12 | 31 | 20 | 64 | 198 | 0.7734 | 14 | 0.03196 |
| LUED | Land use efficiency, Employment density, Revenue generation | 1 | 7 | 30 | 26 | 64 | 209 | 0.8164 | 7 | 0.033737 |
| LUEC | Land utilization, Environmental compliance, Transport proximity | 2 | 4 | 35 | 23 | 64 | 207 | 0.8086 | 8 | 0.033414 |
| VLDALP | Vacant land reduction, Agricultural land preservation | 3 | 4 | 28 | 29 | 64 | 211 | 0.8242 | 6 | 0.034059 |
| FARM | FAR, Mixed-use ratio | 1 | 10 | 41 | 12 | 64 | 192 | 0.7500 | 17 | 0.030993 |
| HAISOR | Housing affordability index, Supply, Ownership rate | 0 | 9 | 34 | 21 | 64 | 204 | 0.7969 | 10 | 0.032931 |
| HRAR | Housing density, Affordability ratio, Access to services | 1 | 8 | 31 | 24 | 64 | 206 | 0.8047 | 9 | 0.033253 |
| PDCD | Residential/population density, Compact development ratio, Transport access | 1 | 6 | 35 | 22 | 64 | 206 | 0.8047 | 9 | 0.033253 |
| ISRA | Informal settlement regularization, Access to services, Resettlement success | 2 | 2 | 32 | 28 | 64 | 214 | 0.8359 | 4 | 0.034542 |
| PHCZ | Proportion of high-rises, Compliance with zoning, Vertical housing ratio | 3 | 8 | 34 | 19 | 64 | 197 | 0.7695 | 15 | 0.031799 |
| HUDOR | Housing unit density, Overcrowding rate, Land use efficiency for housing | 1 | 13 | 33 | 17 | 64 | 194 | 0.7578 | 16 | 0.031315 |
| ACSFF | Accessibility coverage, Service frequency, Ridership growth | 2 | 5 | 31 | 26 | 64 | 209 | 0.8164 | 7 | 0.033737 |
| TFECI | Traffic flow efficiency, Congestion index, Accident rate | 2 | 4 | 35 | 23 | 64 | 207 | 0.8086 | 8 | 0.033414 |
| PCUB | Path coverage, Usage rate, Bicycle parking, Connectivity index | 2 | 1 | 34 | 27 | 64 | 214 | 0.8359 | 4 | 0.034542 |
| ISIELL | Integration, sustainability, investment, emissions reduction | 2 | 5 | 40 | 17 | 64 | 200 | 0.7813 | 13 | 0.032286 |
| SWAG | Emissions reduction, Tree canopy cover | 1 | 10 | 30 | 23 | 64 | 203 | 0.7930 | 11 | 0.03277 |
| SWAGC | Safe water access, Groundwater compliance, Reuse rate, Loss rate | 1 | 7 | 33 | 23 | 64 | 206 | 0.8047 | 9 | 0.033253 |
| WCRL | Waste collection, Recycling rate, Landfill compliance, Composting | 0 | 3 | 38 | 23 | 64 | 212 | 0.8281 | 5 | 0.03422 |
| RES | Outages/year, Renewable energy share, Energy efficiency | 1 | 3 | 33 | 27 | 64 | 214 | 0.8359 | 4 | 0.034542 |
| CFR | Coverage, Flood-prone reduction, Stormwater capture rate | 1 | 8 | 43 | 12 | 64 | 194 | 0.7578 | 16 | 0.031315 |
| CC | Consultation coverage, Participation rate, Inclusivity index | 1 | 10 | 27 | 26 | 64 | 206 | 0.8047 | 9 | 0.033253 |
| PPABT | Public plan access, Budget transparency, Corruption perception | 1 | 7 | 30 | 26 | 64 | 209 | 0.8164 | 7 | 0.033737 |
| SDTRC | Service delivery time, revenue collection, HR capacity | 1 | 3 | 33 | 27 | 64 | 214 | 0.8359 | 4 | 0.034542 |
| DSC | Digital service coverage, User satisfaction, System uptime | 1 | 2 | 31 | 30 | 64 | 218 | 0.8516 | 2 | 0.035191 |
Table 4.3: Pairwise Comparison of 30 Sustainability Indicators Based on Importance
| PSS | UHIR | GWB | GCA | GRUD | ERJC | IWDMI | LUED | LUEC | VLDALP | FARM | HAISOR | HRAR | PDCD | ISRA | PHCZ | HUDOR | ACSFF | TFECI | PCUB | ISIELL | SWAG | SWAGC | WCRL | RES | CFR | CC | PPABT | SDTRC | DSC | |
| PSS | 1.00 | 0.97 | 0.91 | 0.93 | 0.89 | 0.98 | 1.00 | 0.94 | 0.95 | 0.93 | 1.03 | 0.97 | 0.96 | 0.96 | 0.92 | 1.00 | 1.02 | 0.94 | 0.95 | 0.92 | 0.99 | 0.97 | 0.96 | 0.93 | 0.92 | 1.02 | 0.96 | 0.94 | 0.92 | 0.90 |
| UHIR | 1.03 | 1.00 | 0.94 | 0.96 | 0.92 | 1.01 | 1.03 | 0.97 | 0.98 | 0.96 | 1.06 | 1.00 | 0.99 | 0.99 | 0.95 | 1.03 | 1.05 | 0.97 | 0.98 | 0.95 | 1.02 | 1.00 | 0.99 | 0.96 | 0.95 | 1.05 | 0.99 | 0.97 | 0.95 | 0.93 |
| GWB | 1.10 | 1.06 | 1.00 | 1.02 | 0.98 | 1.07 | 1.09 | 1.03 | 1.04 | 1.02 | 1.13 | 1.06 | 1.05 | 1.05 | 1.01 | 1.10 | 1.11 | 1.03 | 1.04 | 1.01 | 1.08 | 1.06 | 1.05 | 1.02 | 1.01 | 1.11 | 1.05 | 1.03 | 1.01 | 0.99 |
| GCA | 1.08 | 1.04 | 0.98 | 1.00 | 0.96 | 1.05 | 1.07 | 1.01 | 1.02 | 1.01 | 1.10 | 1.04 | 1.03 | 1.03 | 0.99 | 1.08 | 1.09 | 1.01 | 1.02 | 0.99 | 1.06 | 1.04 | 1.03 | 1.00 | 0.99 | 1.09 | 1.03 | 1.01 | 0.99 | 0.97 |
| GRUD | 1.12 | 1.09 | 1.02 | 1.04 | 1.00 | 1.09 | 1.12 | 1.06 | 1.07 | 1.05 | 1.15 | 1.08 | 1.07 | 1.07 | 1.03 | 1.12 | 1.14 | 1.06 | 1.07 | 1.03 | 1.11 | 1.09 | 1.07 | 1.04 | 1.03 | 1.14 | 1.07 | 1.06 | 1.03 | 1.01 |
| ERJC | 1.03 | 1.00 | 0.94 | 0.95 | 0.91 | 1.00 | 1.02 | 0.97 | 0.98 | 0.96 | 1.05 | 0.99 | 0.98 | 0.98 | 0.94 | 1.03 | 1.04 | 0.97 | 0.98 | 0.94 | 1.01 | 1.00 | 0.98 | 0.95 | 0.94 | 1.04 | 0.98 | 0.97 | 0.94 | 0.93 |
| IWDMI | 1.01 | 0.98 | 0.92 | 0.93 | 0.90 | 0.98 | 1.00 | 0.95 | 0.96 | 0.94 | 1.03 | 0.97 | 0.96 | 0.96 | 0.93 | 1.01 | 1.02 | 0.95 | 0.96 | 0.93 | 0.99 | 0.98 | 0.96 | 0.93 | 0.93 | 1.02 | 0.96 | 0.95 | 0.93 | 0.91 |
| LUED | 1.06 | 1.03 | 0.97 | 0.99 | 0.95 | 1.04 | 1.06 | 1.00 | 1.01 | 0.99 | 1.09 | 1.02 | 1.02 | 1.02 | 0.98 | 1.06 | 1.08 | 1.00 | 1.01 | 0.98 | 1.05 | 1.03 | 1.02 | 0.99 | 0.98 | 1.08 | 1.02 | 1.00 | 0.98 | 0.96 |
| LUEC | 1.05 | 1.02 | 0.96 | 0.98 | 0.94 | 1.03 | 1.05 | 0.99 | 1.00 | 0.98 | 1.08 | 1.02 | 1.01 | 1.01 | 0.97 | 1.05 | 1.07 | 0.99 | 1.00 | 0.97 | 1.04 | 1.02 | 1.01 | 0.98 | 0.97 | 1.07 | 1.01 | 0.99 | 0.97 | 0.95 |
| VLDALP | 1.07 | 1.04 | 0.98 | 1.00 | 0.96 | 1.04 | 1.07 | 1.01 | 1.02 | 1.00 | 1.10 | 1.03 | 1.02 | 1.02 | 0.99 | 1.07 | 1.09 | 1.01 | 1.02 | 0.99 | 1.06 | 1.04 | 1.02 | 1.00 | 0.99 | 1.09 | 1.02 | 1.01 | 0.99 | 0.97 |
| FARM | 0.98 | 0.95 | 0.89 | 0.91 | 0.87 | 0.95 | 0.97 | 0.92 | 0.93 | 0.91 | 1.00 | 0.94 | 0.93 | 0.93 | 0.90 | 0.98 | 0.99 | 0.92 | 0.93 | 0.90 | 0.96 | 0.95 | 0.93 | 0.91 | 0.90 | 0.99 | 0.93 | 0.92 | 0.90 | 0.88 |
| HAISOR | 1.04 | 1.01 | 0.94 | 0.96 | 0.92 | 1.01 | 1.03 | 0.98 | 0.99 | 0.97 | 1.06 | 1.00 | 0.99 | 0.99 | 0.95 | 1.04 | 1.05 | 0.98 | 0.99 | 0.95 | 1.02 | 1.01 | 0.99 | 0.96 | 0.95 | 1.05 | 0.99 | 0.98 | 0.95 | 0.94 |
| HRAR | 1.05 | 1.02 | 0.95 | 0.97 | 0.93 | 1.02 | 1.04 | 0.99 | 1.00 | 0.98 | 1.07 | 1.01 | 1.00 | 1.00 | 0.96 | 1.05 | 1.06 | 0.99 | 1.00 | 0.96 | 1.03 | 1.02 | 1.00 | 0.97 | 0.96 | 1.06 | 1.00 | 0.99 | 0.96 | 0.95 |
| PDCD | 1.05 | 1.02 | 0.95 | 0.97 | 0.93 | 1.02 | 1.04 | 0.99 | 1.00 | 0.98 | 1.07 | 1.01 | 1.00 | 1.00 | 0.96 | 1.05 | 1.06 | 0.99 | 1.00 | 0.96 | 1.03 | 1.02 | 1.00 | 0.97 | 0.96 | 1.06 | 1.00 | 0.99 | 0.96 | 0.95 |
| ISRA | 1.09 | 1.05 | 0.99 | 1.01 | 0.97 | 1.06 | 1.08 | 1.02 | 1.03 | 1.01 | 1.12 | 1.05 | 1.04 | 1.04 | 1.00 | 1.09 | 1.10 | 1.02 | 1.03 | 1.00 | 1.07 | 1.05 | 1.04 | 1.01 | 1.00 | 1.10 | 1.04 | 1.02 | 1.00 | 0.98 |
| PHCZ | 1.00 | 0.97 | 0.91 | 0.93 | 0.89 | 0.98 | 1.00 | 0.94 | 0.95 | 0.93 | 1.03 | 0.97 | 0.96 | 0.96 | 0.92 | 1.00 | 1.02 | 0.94 | 0.95 | 0.92 | 0.99 | 0.97 | 0.96 | 0.93 | 0.92 | 1.02 | 0.96 | 0.94 | 0.92 | 0.90 |
| HUDOR | 0.99 | 0.96 | 0.90 | 0.92 | 0.88 | 0.96 | 0.98 | 0.93 | 0.94 | 0.92 | 1.01 | 0.95 | 0.94 | 0.94 | 0.91 | 0.99 | 1.00 | 0.93 | 0.94 | 0.91 | 0.97 | 0.96 | 0.94 | 0.92 | 0.91 | 1.00 | 0.94 | 0.93 | 0.91 | 0.89 |
| ACSFF | 1.06 | 1.03 | 0.97 | 0.99 | 0.95 | 1.04 | 1.06 | 1.00 | 1.01 | 0.99 | 1.09 | 1.02 | 1.02 | 1.02 | 0.98 | 1.06 | 1.08 | 1.00 | 1.01 | 0.98 | 1.05 | 1.03 | 1.02 | 0.99 | 0.98 | 1.08 | 1.02 | 1.00 | 0.98 | 0.96 |
| TFECI | 1.05 | 1.02 | 0.96 | 0.98 | 0.94 | 1.03 | 1.05 | 0.99 | 1.00 | 0.98 | 1.08 | 1.02 | 1.01 | 1.01 | 0.97 | 1.05 | 1.07 | 0.99 | 1.00 | 0.97 | 1.04 | 1.02 | 1.01 | 0.98 | 0.97 | 1.07 | 1.01 | 0.99 | 0.97 | 0.95 |
| PCUB | 1.09 | 1.05 | 0.99 | 1.01 | 0.97 | 1.06 | 1.08 | 1.02 | 1.03 | 1.01 | 1.12 | 1.05 | 1.04 | 1.04 | 1.00 | 1.09 | 1.10 | 1.02 | 1.03 | 1.00 | 1.07 | 1.05 | 1.04 | 1.01 | 1.00 | 1.10 | 1.04 | 1.02 | 1.00 | 0.98 |
| ISIELL | 1.02 | 0.99 | 0.93 | 0.94 | 0.91 | 0.99 | 1.01 | 0.96 | 0.97 | 0.95 | 1.04 | 0.98 | 0.97 | 0.97 | 0.94 | 1.02 | 1.03 | 0.96 | 0.97 | 0.94 | 1.00 | 0.99 | 0.97 | 0.94 | 0.94 | 1.03 | 0.97 | 0.96 | 0.94 | 0.92 |
| SWAG | 1.03 | 1.00 | 0.94 | 0.96 | 0.92 | 1.01 | 1.03 | 0.97 | 0.98 | 0.96 | 1.06 | 1.00 | 0.99 | 0.99 | 0.95 | 1.03 | 1.05 | 0.97 | 0.98 | 0.95 | 1.02 | 1.00 | 0.99 | 0.96 | 0.95 | 1.05 | 0.99 | 0.97 | 0.95 | 0.93 |
| SWAGC | 1.05 | 1.02 | 0.95 | 0.97 | 0.93 | 1.02 | 1.04 | 0.99 | 1.00 | 0.98 | 1.07 | 1.01 | 1.00 | 1.00 | 0.96 | 1.05 | 1.06 | 0.99 | 1.00 | 0.96 | 1.03 | 1.02 | 1.00 | 0.97 | 0.96 | 1.06 | 1.00 | 0.99 | 0.96 | 0.95 |
| WCRL | 1.08 | 1.04 | 0.98 | 1.00 | 0.96 | 1.05 | 1.07 | 1.01 | 1.02 | 1.01 | 1.10 | 1.04 | 1.03 | 1.03 | 0.99 | 1.08 | 1.09 | 1.01 | 1.02 | 0.99 | 1.06 | 1.04 | 1.03 | 1.00 | 0.99 | 1.09 | 1.03 | 1.01 | 0.99 | 0.97 |
| RES | 1.09 | 1.05 | 0.99 | 1.01 | 0.97 | 1.06 | 1.08 | 1.02 | 1.03 | 1.01 | 1.12 | 1.05 | 1.04 | 1.04 | 1.00 | 1.09 | 1.10 | 1.02 | 1.03 | 1.00 | 1.07 | 1.05 | 1.04 | 1.01 | 1.00 | 1.10 | 1.04 | 1.02 | 1.00 | 0.98 |
| CFR | 0.99 | 0.96 | 0.90 | 0.92 | 0.88 | 0.96 | 0.98 | 0.93 | 0.94 | 0.92 | 1.01 | 0.95 | 0.94 | 0.94 | 0.91 | 0.99 | 1.00 | 0.93 | 0.94 | 0.91 | 0.97 | 0.96 | 0.94 | 0.92 | 0.91 | 1.00 | 0.94 | 0.93 | 0.91 | 0.89 |
| CC | 1.05 | 1.02 | 0.95 | 0.97 | 0.93 | 1.02 | 1.04 | 0.99 | 1.00 | 0.98 | 1.07 | 1.01 | 1.00 | 1.00 | 0.96 | 1.05 | 1.06 | 0.99 | 1.00 | 0.96 | 1.03 | 1.02 | 1.00 | 0.97 | 0.96 | 1.06 | 1.00 | 0.99 | 0.96 | 0.95 |
| PPABT | 1.06 | 1.03 | 0.97 | 0.99 | 0.95 | 1.04 | 1.06 | 1.00 | 1.01 | 0.99 | 1.09 | 1.02 | 1.02 | 1.02 | 0.98 | 1.06 | 1.08 | 1.00 | 1.01 | 0.98 | 1.05 | 1.03 | 1.02 | 0.99 | 0.98 | 1.08 | 1.02 | 1.00 | 0.98 | 0.96 |
| SDTRC | 1.09 | 1.05 | 0.99 | 1.01 | 0.97 | 1.06 | 1.08 | 1.02 | 1.03 | 1.01 | 1.12 | 1.05 | 1.04 | 1.04 | 1.00 | 1.09 | 1.10 | 1.02 | 1.03 | 1.00 | 1.07 | 1.05 | 1.04 | 1.01 | 1.00 | 1.10 | 1.04 | 1.02 | 1.00 | 0.98 |
| DSC | 1.11 | 1.07 | 1.01 | 1.03 | 0.99 | 1.08 | 1.10 | 1.04 | 1.05 | 1.03 | 1.14 | 1.07 | 1.06 | 1.06 | 1.02 | 1.11 | 1.12 | 1.04 | 1.05 | 1.02 | 1.09 | 1.07 | 1.06 | 1.03 | 1.02 | 1.12 | 1.06 | 1.04 | 1.02 | 1.00 |
Sectoral Consolidation of Sustainability Indicators
The pairwise comparison of 30 sustainability indicators was consolidated into 7 sectoral categories, ensuring a structured evaluation of urban sustainability priorities.
Table 4.4: Pairwise Comparison of 30 Sustainability Indicators Consolidated into 7 Sectoral Categories
| E&I | G&IE | H | LU&UF | PC | SE | T | |
| E&I | 1.000 | 1.215 | 1.269 | 0.837 | 1.243 | 1.657 | 1.240 |
| G&IE | 0.823 | 1.000 | 1.044 | 0.689 | 1.023 | 1.364 | 1.020 |
| H | 0.788 | 0.957 | 1.000 | 0.660 | 0.979 | 1.306 | 0.977 |
| LU&UF | 1.194 | 1.451 | 1.515 | 1.000 | 1.484 | 1.979 | 1.481 |
| PC | 0.805 | 0.978 | 1.021 | 0.674 | 1.000 | 1.333 | 0.998 |
| SE | 0.604 | 0.733 | 0.766 | 0.505 | 0.750 | 1.000 | 0.748 |
| T | 0.807 | 0.980 | 1.023 | 0.675 | 1.002 | 1.337 | 1.000 |
Table 4.4 presents the sectoral-level pairwise comparisons, where Land Use & Urban Form (LU&UF) holds the highest comparative importance, reinforcing its role in shaping sustainable urban environments. Environmental & Infrastructure (E&I) and Governance & Institutional Efficiency (G&IE) also rank highly, emphasizing their significance in climate resilience, resource management, and policy implementation.
Table 4.5: Priority Weights and Rankings of 30 Sustainability Indicators Consolidated into 7 Sectoral Categories
| Sector | Priority Weight (Normalized) | Rank |
| Land use & Urban Form | 0.198 | 1 |
| Environmental and Infrastructure | 0.166 | 2 |
| Governance and Institutional Efficiency | 0.137 | 3 |
| Transportation | 0.134 | 4 |
| Physical Characteristics | 0.134 | 5 |
| Housing | 0.131 | 6 |
| Socio Economic factors | 0.100 | 7 |
Table 4.5 further refines these comparisons into normalized priority weights, ranking LU&UF (0.198) as the most influential sector, followed by E&I (0.166) and G&IE (0.137). Transportation (0.134), Physical Characteristics (0.134), and Housing (0.131) hold moderate influence, while Socio-Economic factors (0.100) rank lowest, indicating their dependence on governance and infrastructure support. These rankings form the foundation for further integration with AHP analysis, ensuring a data-driven approach to sustainability assessment in developing urban frameworks.
AHP-Based Evaluation of Sectoral Indicators
The Analytical Hierarchy Process (AHP) was applied to determine the relative importance of sectoral indicators using Saaty’s 1–9 scale. This scale facilitates pairwise comparisons, allowing experts to assign weights based on the influence of one sector over another in urban sustainability. The AHP method ensures logical consistency in rankings, forming the basis for prioritizing sectoral contributions to the Sustainable Urban Planning Index (SUPI).
Table 4.6: Sectoral Weights and Rankings of Sustainability Indicators Based on AHP
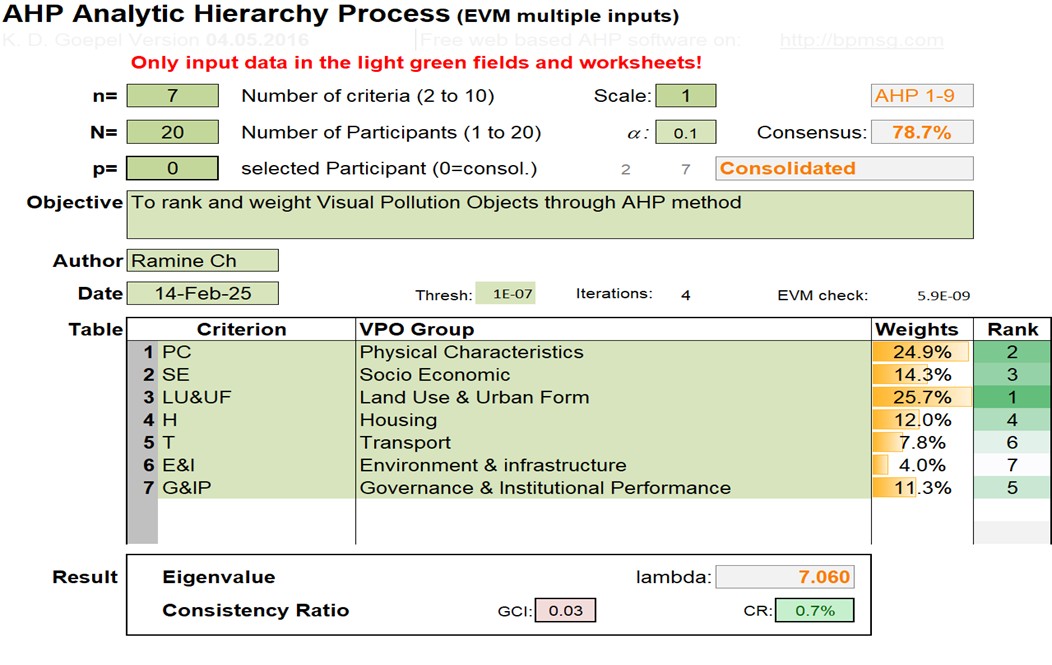
This table 4.6 presents the AHP-derived priority weights and rankings for seven sectoral categories in urban sustainability. Land Use & Urban Form (25.7%) emerged as the most influential criterion, followed by Physical Characteristics (24.9%) and Socio-Economic Factors (14.3%). Housing (12.0%) and Governance & Institutional Performance (11.3%) held moderate influence, while Transportation (7.8%) and Environment & Infrastructure (4.0%) ranked lower. The consistency ratio (CR = 0.7%) confirms the logical coherence of expert evaluations, ensuring a reliable weighting system for sustainability assessment.
Table 4.7: Pairwise Comparison Matrix and Normalized Weights for Sectoral Criteria Using AHP
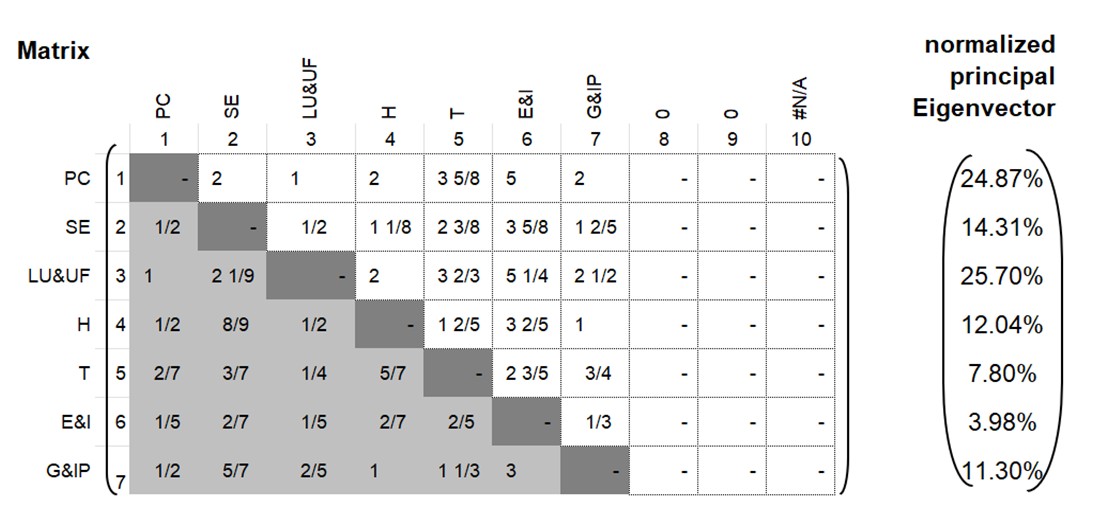
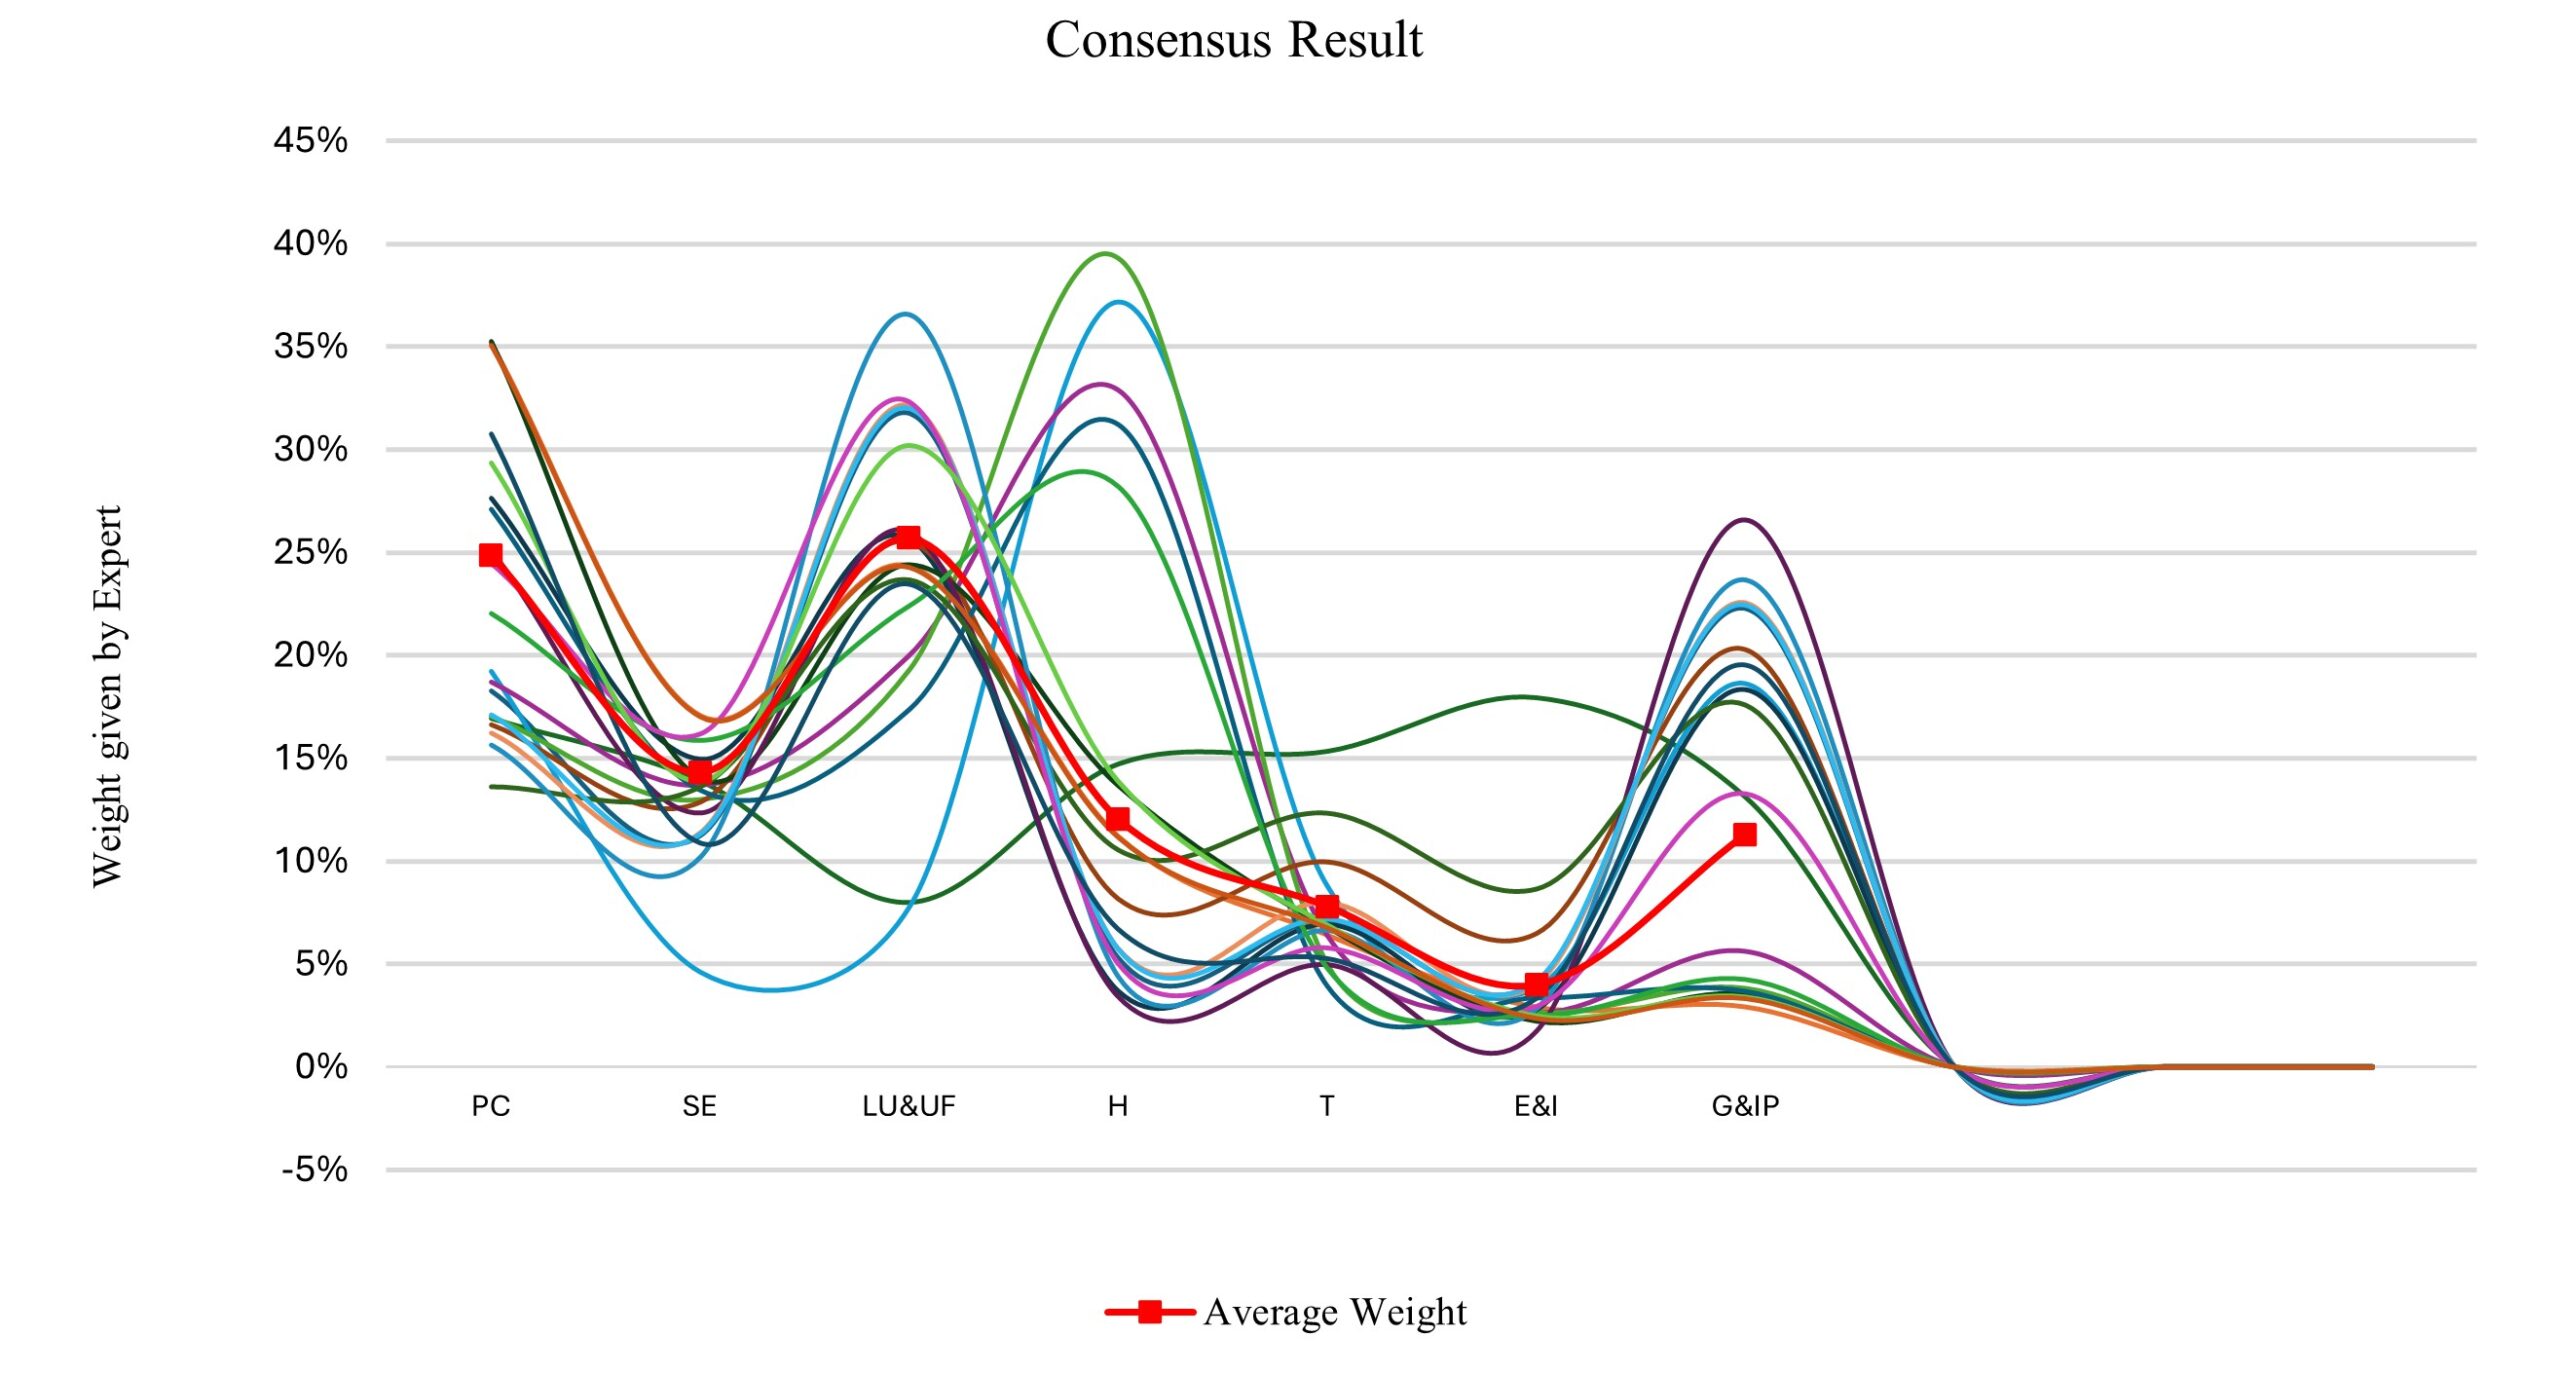
Figure 5 Expert Consensus on Sectoral Weights for Sustainability Indicators Using AHP
This figure 5 illustrates the consensus results of expert evaluations for the relative importance of sustainability sectors using the Analytic Hierarchy Process (AHP). Each curve represents an expert’s assigned weight to different sectoral indicators, namely Physical Characteristics (PC), Socio-Economic Factors (SE), Land Use & Urban Form (LU&UF), Housing (H), Transportation (T), Environment & Infrastructure (E&I), and Governance & Institutional Performance (G&IP).
The red line with markers represents the average weight assigned to each sector across all experts, capturing the overall trend of expert consensus. The fluctuations in individual curves indicate variability in expert opinions, while the red trend line smooths out these variations to depict a final consensus ranking. The highest peaks reflect sectors with greater perceived importance, while the lower points indicate less prioritized sectors in the sustainability assessment framework.
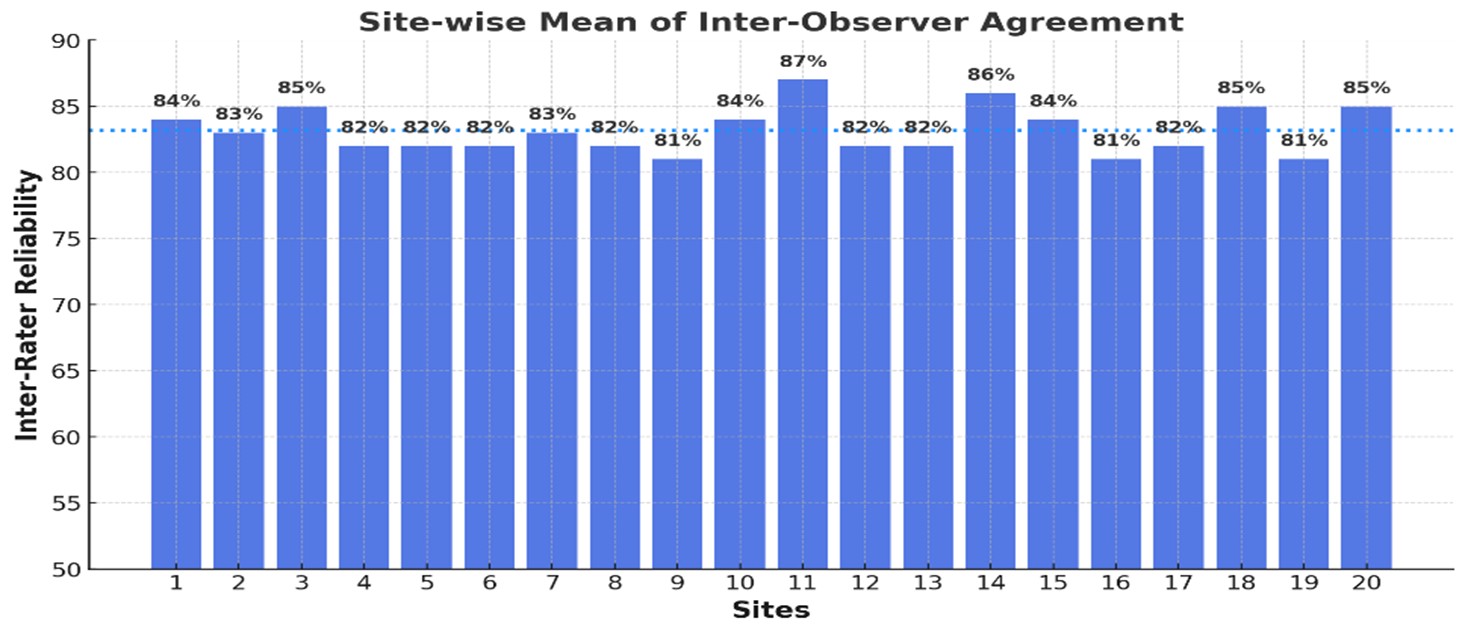
Figure 6 Site-wise Mean of Inter-Observer Agreement for Inter-Rater Reliability (IRR) Test
This figure 6 presents the Inter-Rater Reliability (IRR) test results, depicting the site-wise mean of inter-observer agreement across 20 different sites. The IRR test assesses the consistency and reliability of expert judgments in evaluating sustainability indicators. The y-axis represents the inter-rater reliability percentage, while the x-axis represents the sites where assessments were conducted. The blue bars indicate the agreement level at each site, with values ranging between 81% and 87%, showing strong consistency in expert evaluations. The dotted blue line represents the average agreement across all sites, serving as a benchmark for assessing overall reliability. A higher IRR percentage signifies greater consistency among experts, ensuring that the indicator rankings and evaluations used in this study are statistically valid and reliable for sustainability assessments.
Final Normalization and Weighted Hybrid Scoring of RII and AHP Pairwise Comparison
The final normalization and weighted hybrid scoring integrated the Relative Importance Index (RII) and Analytical Hierarchy Process (AHP) pairwise comparisons to ensure a balanced assessment of sustainability indicators. This hybrid approach mitigated potential biases from individual methodologies, creating a structured ranking system that aligns sectoral priorities with expert-driven weighting. The normalized weights provided a comprehensive evaluation framework, enhancing the adaptability of the Sustainable Urban Planning Index (SUPI) for application in data-limited environments. The results highlight a refined prioritization of sustainability indicators, ensuring their contextual relevance and practical applicability in urban planning assessment models.
Table 4.8: Final Hybrid Weighting and Ranking of Sectoral Criteria
| Criteria | Hybrid Weight (%) | Rank |
| Physical Characteristics | 0.191157 | 2 |
| Socio Economic Factors | 0.121655 | 5 |
| Land Use & Urban Form | 0.22771 | 1 |
| Housing | 0.125657 | 3 |
| Transportation | 0.106007 | 6 |
| Environmental and Infrastructure | 0.102958 | 7 |
| Governance and Institutional Efficiency | 0.124857 | 4 |
The table 4.8 presents the final hybrid weight distribution for sectoral criteria after the normalization of Relative Importance Index (RII) and Analytical Hierarchy Process (AHP) results. This ensures a balanced hybrid weighting approach, preventing dominance by either AHP’s structured hierarchy or RII’s expert consensus. Land Use & Urban Form (22.77%) ranked highest, indicating its critical role in sustainable urban planning, followed by Physical Characteristics (19.12%) and Housing (12.57%). Governance and Institutional Efficiency (12.48%) also held significance, reflecting its role in implementation effectiveness. Environmental and Infrastructure (10.29%) and Transportation (10.60%) ranked lowest, signifying their relative weight in the evaluation framework. These weights will be utilized for further model convergence in sustainable urban planning assessment.
The table presents the final hybrid priority weights for sustainability indicators after normalizing the RII and AHP results. VLDALP (0.05866) ranks highest, followed closely by LUED (0.05811) and LUEC (0.05755), underscoring their critical importance. In contrast, indicators like CFR (0.01625), ISIELL (0.01676), and HUDOR (0.01996) rank lowest. These weights form the basis for further refinement of the SUPI framework.
Table 4.9: Hybrid Priority Weights and Ranking of Sustainability Indicators
| Variable | Hybrid Priority Weight | Rank |
| PSS | 0.04547877 | 8 |
| UHIR | 0.046867489 | 7 |
| GWB | 0.049869469 | 5 |
| GCA | 0.048941272 | 6 |
| GRUD | 0.043294782 | 9 |
| ERJC | 0.039573919 | 10 |
| IWDMI | 0.038786299 | 11 |
| LUED | 0.058109515 | 2 |
| LUEC | 0.057553172 | 3 |
| VLDALP | 0.058664137 | 1 |
| FARM | 0.053383176 | 4 |
| HAISOR | 0.020995219 | 22 |
| HRAR | 0.021200511 | 20 |
| PDCD | 0.021200511 | 20 |
| ISRA | 0.022022315 | 19 |
| PHCZ | 0.02027351 | 23 |
| HUDOR | 0.019964935 | 24 |
| ACSFF | 0.035168184 | 13 |
| TFECI | 0.034831482 | 14 |
| PCUB | 0.036007334 | 12 |
| ISIELL | 0.016755729 | 29 |
| SWAG | 0.017006914 | 28 |
| SWAGC | 0.017257581 | 27 |
| WCRL | 0.017759432 | 26 |
| RES | 0.017926543 | 25 |
| CFR | 0.016251801 | 30 |
| CC | 0.030367018 | 18 |
| PPABT | 0.030809012 | 17 |
| SDTRC | 0.031544148 | 16 |
| DSC | 0.032136822 | 15 |
The SUPI framework is a comprehensive multi-criteria decision-support tool that integrates both expert consensus (via the Relative Importance Index) and structured pairwise comparisons (using the Analytical Hierarchy Process) to evaluate urban sustainability. By combining these methodologies, it produces a balanced model that systematically identifies and prioritizes key indicators—for example, sectors such as Land Use & Urban Form may contribute around 22.77% while Physical Characteristics and Housing also hold significant weights. This balanced approach ensures that the most critical aspects of urban planning are highlighted, providing policymakers with a robust tool to guide sustainable master plan assessments and informed decision-making.
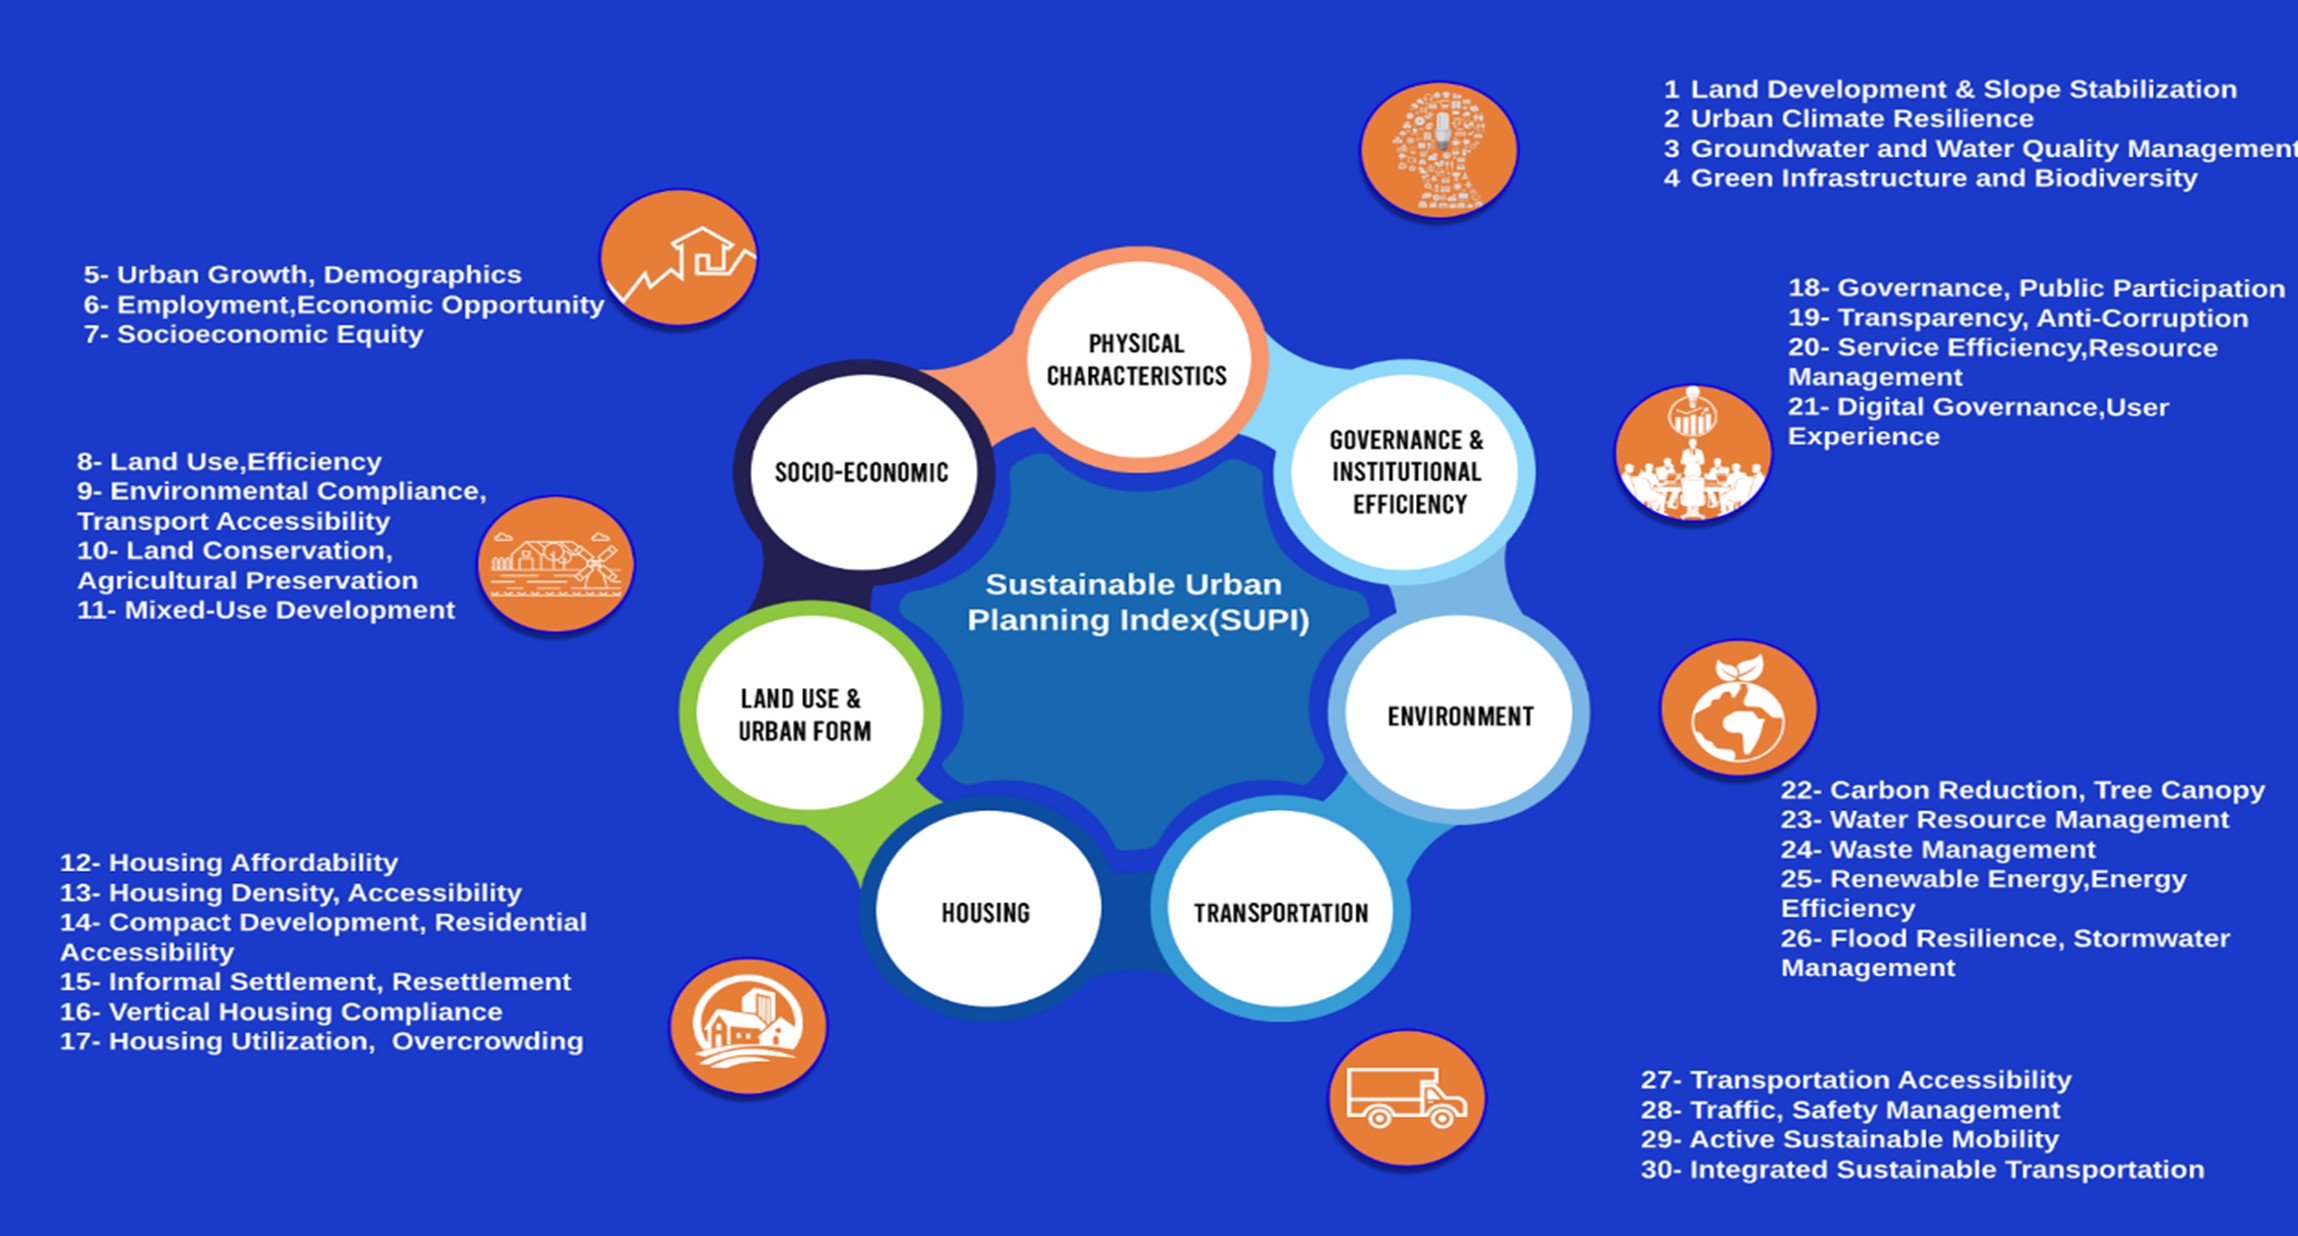
Figure 7: Proposed framework of SUPI for developing countries
CONCLUSIONS AND FUTURE WORK
This study developed a Sustainable Urban Planning Index (SUPI) by integrating AHP, RII, and hybrid weighting methods to systematically evaluate sectoral indicators critical for urban sustainability. The findings highlight Land Use & Urban Form, Environmental & Infrastructure, Governance, and Transportation as key determinants in assessing urban development effectiveness. The hybrid approach ensured balanced indicator ranking, minimizing biases and enhancing applicability in developing countries. The SUPI framework provides a structured evaluation tool for policymakers and urban planners to assess master plans and guide sustainable urban development.
Future work should focus on refining the framework through expanded datasets, GIS-based monitoring, and scenario-based modelling to enhance predictive capabilities. Institutional adoption of the SUPI framework, particularly in urban planning policies, will strengthen decision-making and transparency. Further research is needed to analyse sectoral interdependencies, integrate digital governance tools, and assess applicability in diverse urban settings. By advancing these areas, the SUPI framework can evolve into a scalable and adaptive tool for evaluating sustainability across different urban environments.
REFERENCES
- Arora NK, Mishra I. United Nations Sustainable Development Goals 2030 and environmental sustainability: race against time. Environmental Sustainability. 2019;2(4):339-42.
- Verma P, Raghubanshi AS. Urban sustainability indicators: Challenges and opportunities. Ecological Indicators. 2018;93:282-91.
- Ameen RFM, Mourshed M. Urban sustainability assessment framework development: The ranking and weighting of sustainability indicators using analytic hierarchy process. Sustainable Cities and Society. 2019;44:356-66.
- Mori K, Christodoulou A. Review of sustainability indices and indicators: Towards a new City Sustainability Index (CSI). Environmental impact assessment review. 2012;32(1):94-106.
- Zhou X, Mori K, Christodoulou A. Evolution of Urban Sustainability Assessments: A Multi-Dimensional Approach. Sustainable Cities and Society. 2019;45:101512.
- United Nations Environment P. The Role of Sustainable Urban Planning in Achieving SDG 11. 2021.
- Foroozesh F, Monavari SM, Salmanmahiny A, Robati M, Rahimi R. Assessment of sustainable urban development based on a hybrid decision-making approach: Group fuzzy BWM, AHP, and TOPSIS–GIS. Sustainable Cities and Society. 2022;76:103402.
- Joss S, Cowley R, Tomozeiu D. Towards the ‘ubiquitous eco-city’: An analysis of the development of sustainable urban policy across 100 cities. Urban Studies. 2020;57(5):1015-35.
- Ahmad S, Bai X. Infrastructural Barriers to Urban Sustainability in Developing Regions. Journal of Urban Planning and Development. 2021;146(2):04020020.
- Hickel J. The Divide: A Brief Guide to Global Inequality and Its Solutions. London, UK: Penguin Books; 2020.
- Patel R, Ko Y. Adapting Global Sustainability Frameworks to Local Urban Planning. International Journal of Urban and Regional Research. 2021;45(3):511-29.
- Mensah J. Sustainable development: Meaning, history, principles, pillars, and implications for human action: Literature review. Cogent Social Sciences. 2019;5(1):1653531.
- Sharma M, Luthra S, Joshi S, Kumar A. Developing a framework for enhancing survivability of sustainable supply chains during and post-COVID-19 pandemic. International Journal of Logistics Research and Applications. 2022;25(4-5):433-53.
- Mannucci S. Climate Adaptation in Urban Planning: Toward Sustainable and Resilient Urban Environments: Springer Nature; 2024.
- Puchol-Salort P, O’Keeffe J, van Reeuwijk M, Mijic A. An urban planning sustainability framework: Systems approach to blue green urban design. Sustainable Cities and Society. 2021;66:102677.
- Sharifi A. Urban sustainability assessment: An overview and bibliometric analysis. Ecological Indicators. 2021;121:107102.
- (UNEP) UNEP. United Nations Environment Programme. 2021;UNEP.
- Michalina D, Mederly P, Diefenbacher H, Held B. Sustainable urban development: A review of urban sustainability indicator frameworks. Sustainability. 2021;13(16):9348.
- Wiedmann T, Allen C. City footprints and SDGs provide untapped potential for assessing city sustainability. Nature Communications. 2021;12(1):3758.
- Patrão C, Moura P, Almeida ATd. Review of smart city assessment tools. Smart Cities. 2020;3(4):1117-32.
- Giles-Corti B, Lowe M, Arundel J. Achieving the SDGs: Evaluating indicators to be used to benchmark and monitor progress towards creating healthy and sustainable cities. Health Policy. 2020;124(6):581-90.
- Kayisu AK, Mikusova M, Bokoro PN, Kyamakya K. Exploring Smart Mobility Potential in Kinshasa (DR-Congo) as a Contribution to Mastering Traffic Congestion and Improving Road Safety: A Comprehensive Feasibility Assessment. Sustainability. 2024;16(21):9371.
- Nash KL, Blythe JL, Cvitanovic C, Fulton EA, Halpern BS, Milner-Gulland E, et al. To achieve a sustainable blue future, progress assessments must include interdependencies between the sustainable development goals. One Earth. 2020;2(2):161-73.
- Shmelev SE, Shmeleva IA. Smart and sustainable benchmarking of cities and regions in Europe: The application of multicriteria assessment. Cities. 2025;156:105533.
- Carrilho J, Trindade J. Sustainability in peri-urban informal settlements: a review. Sustainability. 2022;14(13):7591.
- Merino-Saum A, Halla P, Superti V, Boesch A, Binder CR. Indicators for urban sustainability: Key lessons from a systematic analysis of 67 measurement initiatives. Ecological Indicators. 2020;119.
- Schraven D, Joss S, de Jong M. Past, present, future: Engagement with sustainable urban development through 35 city labels in the scientific literature 1990–2019. Journal of Cleaner Production. 2021;292.
- Jamshed A, Patel C, Puriya A, Iqbal N, Rana IA, McMillan JM, et al. Flood resilience assessment from the perspective of urban (in) formality in Surat, India: Implications for sustainable development. Natural Hazards. 2024;120(10):9297-326.
- Shmelev SE, Lefievre N, Saadi N, Shmeleva IA. Interdisciplinary Linkages among Sustainability Dimensions in the Context of European Cities and Regions Research. Sustainability. 2023;15(20):14738.
- Vaidya C. Role of Urban Planning in Achieving SDG – 11 in India. JOURNAL OF ITPI. 2020:77-85
- Vaidya H, Chatterji T. SDG 11 sustainable cities and communities: SDG 11 and the new urban agenda: Global sustainability frameworks for local action. Actioning the global goals for local impact: Towards sustainability science, policy, education and practice. 2020:173-85.
- Shmelev SE, Shmeleva IA. Multidimensional sustainability benchmarking for smart megacities. Cities. 2019;92:134-63.
- Almulhim AI, Bibri SE, Sharifi A, Ahmad S, Almatar KM. Emerging trends and knowledge structures of urbanization and environmental sustainability: a regional perspective. Sustainability. 2022;14(20):13195.
- Leavesley A, Trundle A, Oke C. Cities and the SDGs: realities and possibilities of local engagement in global frameworks. Ambio. 2022;51(6):1416-32.
- Liu B, Yang Z, Xue B, Zhao D, Sun X, Wang W. Formalizing an integrated metric system measuring performance of urban sustainability: Evidence from China. Sustainable Cities and Society. 2022;79:103702.
- Bizarrias FS. Governance and Sustainability in Developing Countries: Intelectual Structure, Trends and Lessons From Brazil and China. ESG Studies Review. 2024;7(esg):e01618.
- Napoli G, Barbaro S, Giuffrida S, Trovato MR, editors. The European green deal: new challenges for the economic feasibility of energy retrofit at district scale. INTERNATIONAL SYMPOSIUM: New Metropolitan Perspectives; 2020: Springer.
- Bizarrias FS. Governance and Sustainability in Developing Countries: Intelectual Structure, Trends and Lessons From Brazil and China. ESG Studies Review. 2024;7:e01618-e.
- Agyabeng AN, Peprah AA, Mensah JK, Mensah EA. Informal settlement and urban development discourse in the Global South: Evidence from Ghana. Norsk Geografisk Tidsskrift – Norwegian Journal of Geography. 2022;76(4):242-53.
- Abujder Ochoa WA, Iarozinski Neto A, Vitorio Junior PC, Calabokis OP, Ballesteros-Ballesteros V. The Theory of complexity and sustainable urban development: A systematic literature review. Sustainability. 2025;17(1):3.
- Adewumi AS, Opoku A, Dangana Z. Sustainability assessment frameworks for delivering Environmental, Social, and Governance (ESG) targets: A case of Building Research Establishment Environmental Assessment Method (BREEAM) UK New Construction. Corporate Social Responsibility and Environmental Management. 2024;31(5):3779-91.
- Bi C, Little JC. Integrated assessment across building and urban scales: A review and proposal for a more holistic, multi-scale, system-of-systems approach. Sustainable Cities and Society. 2022;82:103915.
- Satterthwaite D. Sustainable cities or cities that contribute to sustainable development? The Earthscan reader in sustainable cities: Routledge; 2021. p. 80-106.
- Vandervaeren C, Galle W, Stephan A, De Temmerman N. More than the sum of its parts: Considering interdependencies in the life cycle material flow and environmental assessment of demountable buildings. Resources, conservation and recycling. 2022;177:106001.
- Kondo Nakada LY, Urban RC. Priority areas for the use of solar water disinfection (SODIS) in Brazil: a spatial approach. Journal of Water, Sanitation and Hygiene for Development. 2024;14(10):950-62.
- Liu H, Hamel P, Tardieu L, Remme RP, Han B, Ren H. A geospatial model of nature-based recreation for urban planning: Case study of Paris, France. Land Use Policy. 2022;117:106107.
- Rane N, Achari A, Choudhary S. Multi-Criteria Decision-Making (MCDM) as a powerful tool for sustainable development: Effective applications of AHP, FAHP, TOPSIS, ELECTRE, and VIKOR in sustainability. International Research Journal of Modernization in Engineering Technology and Science. 2023;5(4):2654-70.
- Dabous SA, Zeiada W, Zayed T, Al-Ruzouq R. Sustainability-informed multi-criteria decision support framework for ranking and prioritization of pavement sections. Journal of Cleaner Production. 2020;244:118755.
- Daimi S, Rebai S. Sustainability performance assessment of Tunisian public transport companies: AHP and ANP approaches. Socio-Economic Planning Sciences. 2023;89:101680.
- Munier N, Hontoria E. Uses and Limitations of the AHP Method: Springer; 2021.
- Genc O. Identifying principal risk factors in Turkish construction sector according to their probability of occurrences: a relative importance index (RII) and exploratory factor analysis (EFA) approach. International Journal of Construction Management. 2023;23(6):979-87.
- De Pascale A, Arbolino R, Szopik-Depczyńska K, Limosani M, Ioppolo G. A systematic review for measuring circular economy: The 61 indicators. Journal of cleaner production. 2021;281:124942.
- Jamali A, Robati M, Nikoomaram H, Farsad F, Aghamohammadi H. Urban resilience assessment using hybrid MCDM model based on DEMATEL-ANP method (DANP). Journal of the Indian Society of Remote Sensing. 2023;51(4):893-915.
- Shukla N, Das A, Mazumder T. Assessment of urban form resilience: a review of literature in the context of the Global South. Environment, Development and Sustainability. 2023:1-37.
- Oyefusi ON, Arowoiya VA, Chan M. Hybrid MCDM approach for analyzing barriers and formulating strategies for the adoption of modular construction in developing countries. Engineering, Construction and Architectural Management. 2024.
- Jhinkwan VS, Chore HS, Kumar A. Assessment of Stability of Slopes and Remedial Measures in Lesser Himalayan Region: An Overview. Indian Geotechnical Journal. 2024:1-23.
- Hopkins LP, January‐Bevers DJ, Caton EK, Campos LA. A simple tree planting framework to improve climate, air pollution, health, and urban heat in vulnerable locations using non‐traditional partners. Plants, People, Planet. 2022;4(3):243-57.
- Ravenscroft P, Lytton L. Practical manual on groundwater quality monitoring. 2022.
- Costadone L, Vierikko K. Are traditional urban greening actions compliant with the European Greening Plans guidance? Urban Forestry & Urban Greening. 2023;90:128131.
- Mudau N, Mwaniki D, Tsoeleng L, Mashalane M, Beguy D, Ndugwa R. Assessment of SDG indicator 11.3. 1 and urban growth trends of major and small cities in South Africa. Sustainability. 2020;12(17):7063.
- Nasr-Allah A, Gasparatos A, Karanja A, Dompreh EB, Murphy S, Rossignoli CM, et al. Employment generation in the Egyptian aquaculture value chain: implications for meeting the sustainable development goals (SDGs). Aquaculture. 2020;520:734940.
- Poirier MJ, Grépin KA, Grignon M. Approaches and alternatives to the wealth index to measure socioeconomic status using survey data: a critical interpretive synthesis. Social Indicators Research. 2020;148(1):1-46.
- Baker M. Land-use planning. Encyclopedia of quality of life and well-being research: Springer; 2024. p. 3786-8.
- Yablonskii L, editor Volume-planning and town-planning organization of mixed residential development in the complex development of the territory. E3S Web of Conferences; 2020: EDP Sciences.
- Molloy R, Nathanson CG, Paciorek A. Housing supply and affordability: Evidence from rents, housing consumption and household location. Journal of Urban Economics. 2022;129:103427.
- Azmoodeh M, Haghighi F, Motieyan H, Maghsoodi Tilaki MJ. Investigating the relationship between housing policy and accessibility, based on developing a multi-perspectives accessibility index: a case study in Tehran, Iran. Journal of Housing and the Built Environment. 2020;35(4):1237-59.
- Kotharkar R, Bahadure P. Achieving compact city form through density distribution: Case of Indian cities. Journal of Urban Planning and Development. 2020;146(1):04019022.
- Hosseini A, Finn BM, Momeni A. The complexities of urban informality: A multi-dimensional analysis of residents’ perceptions of life, inequality, and access in an Iranian informal settlement. Cities. 2023;132:104099.
- Kazazi AK, Rabiei-Dastjerdi H, McArdle G. Emerging paradigm shift in urban indicators: Integration of the vertical dimension. Journal of Environmental Management. 2022;316:115234.
- Santillan JR, Heipke C. Assessing Patterns and Trends in Urbanization and Land Use Efficiency Across the Philippines: A Comprehensive Analysis Using Global Earth Observation Data and SDG 11.3. 1 Indicators. PFG–Journal of Photogrammetry, Remote Sensing and Geoinformation Science. 2024;92(5):569-92.
- Lee J, Yoon Y. Indicators development to support intelligent road infrastructure in urban cities. Transport Policy. 2021;114:252-65.
- Tran NH, Yang S-H, Huang T. Comparative analysis of traffic-and-transportation-planning-related indicators in sustainable transportation infrastructure rating systems. International journal of sustainable transportation. 2021;15(3):203-16.
- Ikram M, Ferasso M, Sroufe R, Zhang Q. Assessing green technology indicators for cleaner production and sustainable investments in a developing country context. Journal of Cleaner Production. 2021;322:129090.
- Estoque RC, Johnson BA, Gao Y, DasGupta R, Ooba M, Togawa T, et al. Remotely sensed tree canopy cover-based indicators for monitoring global sustainability and environmental initiatives. Environmental Research Letters. 2021;16(4):044047.
- Namavar M, Moghaddam MRA, Shafiei M. Developing an indicator-based assessment framework for assessing the sustainability of urban water management. Sustainable Production and Consumption. 2023;40:1-12.
- Rashid MI, Shahzad K. Food waste recycling for compost production and its economic and environmental assessment as circular economy indicators of solid waste management. Journal of Cleaner Production. 2021;317:128467.
- Wiik MRK, Fufa SM, Fjellheim K, Lien SK, Krogstie J, Ahlers D, et al. Zero emission neighbourhoods in smart cities. definition, key performance indicators and assessment criteria: Version 2.0. 2021.
- Mabrouk M, Han H, Mahran MGN, Abdrabo KI, Yousry A. Revisiting Urban Resilience: A Systematic Review of Multiple-Scale Urban Form Indicators in Flood Resilience Assessment. Sustainability. 2024;16(12):5076.
- Fotopoulou E, Mandilara I, Zafeiropoulos A, Laspidou C, Adamos G, Koundouri P, et al. SustainGraph: A knowledge graph for tracking the progress and the interlinking among the sustainable development goals’ targets. Frontiers in Environmental Science. 2022;10:1003599.
- Onat NC, Mandouri J, Kucukvar M, Kutty AA, Al‐Muftah AA. Driving Sustainable Business Practices With Carbon Accounting and Reporting: A Holistic Framework and Empirical Analysis. Corporate Social Responsibility and Environmental Management. 2025.
- Goliath L. Sustainable Urban Development and Management: A case study of Nelson Mandela Bay Metropolitan Municipality (Gqeberha). 2023.
APPENDIX A
Please indicate the level of impact each indicator has on Sustainable Urban Planning by selecting one of the following options: 1 for Very Unimportant (V-UNIMP), 2 for Unimportant (UNIMP), 3 for Important (IMP), and 4 for Very Important (V-IMP).
- How strongly does Physical Character impact Sustainable Urban Planning?
- Land Development & Slope Stabilization ☐ 1 ☐ 2 ☐ 3 ☐ 4
- Urban Climate Resilience ☐ 1 ☐ 2 ☐ 3 ☐ 4
- Groundwater and Water Quality Management ☐ 1 ☐ 2 ☐ 3 ☐ 4
- Green Infrastructure and Biodiversity ☐ 1 ☐ 2 ☐ 3 ☐ 4
- How strongly does Socio-Economic Development impact Sustainable Urban Planning?
- Urban Growth and Demographics ☐ 1 ☐ 2 ☐ 3 ☐ 4
- Employment and Economic Opportunity ☐ 1 ☐ 2 ☐ 3 ☐ 4
- Socioeconomic Equity ☐ 1 ☐ 2 ☐ 3 ☐ 4
- How strongly does Land Use & Urban Form impact Sustainable Urban Planning?
- Land Use and Efficiency ☐ 1 ☐ 2 ☐ 3 ☐ 4
- Environmental Compliance and Transport Accessibility ☐ 1 ☐ 2 ☐ 3 ☐ 4
- Land Conservation and Agricultural Preservation ☐ 1 ☐ 2 ☐ 3 ☐ 4
- Mixed-Use Development and Density ☐ 1 ☐ 2 ☐ 3 ☐ 4
- How strongly does Housing impact Sustainable Urban Planning?
- Housing Affordability and Ownership ☐ 1 ☐ 2 ☐ 3 ☐ 4
- Housing Density and Accessibility ☐ 1 ☐ 2 ☐ 3 ☐ 4
- Compact Development and Residential Accessibility ☐ 1 ☐ 2 ☐ 3 ☐ 4
- Informal Settlement and Resettlement ☐ 1 ☐ 2 ☐ 3 ☐ 4
- Vertical Housing Compliance ☐ 1 ☐ 2 ☐ 3 ☐ 4
- Housing Utilization and Overcrowding ☐ 1 ☐ 2 ☐ 3 ☐ 4
- How strongly does Transportation impact Sustainable Urban Planning?
- Transportation Accessibility ☐ 1 ☐ 2 ☐ 3 ☐ 4
- Traffic and Safety Management ☐ 1 ☐ 2 ☐ 3 ☐ 4
- Active and Sustainable Mobility ☐ 1 ☐ 2 ☐ 3 ☐ 4
- Integrated and Sustainable Transportation ☐ 1 ☐ 2 ☐ 3 ☐ 4
- How strongly does Environmental & Infrastructure impact Sustainable Urban Planning?
- Carbon Reduction and Tree Canopy ☐ 1 ☐ 2 ☐ 3 ☐ 4
- Water Resource Management ☐ 1 ☐ 2 ☐ 3 ☐ 4
- Waste Management ☐ 1 ☐ 2 ☐ 3 ☐ 4
- Renewable Energy and Energy Efficiency ☐ 1 ☐ 2 ☐ 3 ☐ 4
- Flood Resilience and Stormwater Management ☐ 1 ☐ 2 ☐ 3 ☐ 4
- How strongly does Governance & Institutional Performance impact Sustainable Urban Planning?
- Governance and Public Participation ☐ 1 ☐ 2 ☐ 3 ☐ 4
- Transparency and Anti-Corruption ☐ 1 ☐ 2 ☐ 3 ☐ 4
- Service Efficiency and Resource Management ☐ 1 ☐ 2 ☐ 3 ☐ 4
- Digital Governance and User Experience ☐ 1 ☐ 2 ☐ 3 ☐ 4
APPENDIX B
This questionnaire aims to gather expert opinions on prioritizing sectoral indicators for sustainable urban planning using the Analytic Hierarchy Process (AHP). You will compare two indicators at a time and assign a score based on Saaty’s 1-9 scale: 1 (equal importance), 3 (moderate), 5 (strong), 7 (very strong), and 9 (extreme), with 2, 4, 6, 8 as intermediate values. For each pair, select the more important criterion and assign a score reflecting its significance. If both are equally important, assign 1. Please complete all 21 pairwise comparisons to ensure statistical consistency. Your expertise is highly valued. Thank you for your participation.
Name:_________Affiliation:__________Position:__________Years of Experience in Urban Planning: _______
| Physical Characteristics vs. Socio-Economic Factors | ☐ Physical Characteristics (PC) | ☐ 1 ☐ 2 ☐ 3 ☐ 4 ☐ 5 ☐ 6 ☐ 7 ☐ 8 ☐ 9 |
| ☐ Socio-Economic Factors (SE) | ||
| Physical Characteristics vs. Land Use & Urban Form | ☐ Physical Characteristics (PC) | ☐ 1 ☐ 2 ☐ 3 ☐ 4 ☐ 5 ☐ 6 ☐ 7 ☐ 8 ☐ 9 |
| ☐ Land Use & Urban Form (LU&UF) | ||
| Physical Characteristics vs. Housing | ☐ Physical Characteristics (PC) | ☐ 1 ☐ 2 ☐ 3 ☐ 4 ☐ 5 ☐ 6 ☐ 7 ☐ 8 ☐ 9 |
| ☐ Housing (H) | ||
| Physical Characteristics vs. Transportation | ☐ Physical Characteristics (PC) | ☐ 1 ☐ 2 ☐ 3 ☐ 4 ☐ 5 ☐ 6 ☐ 7 ☐ 8 ☐ 9 |
| ☐ Transportation (T) | ||
| Physical Characteristics vs. Environment & Infrastructure | ☐ Physical Characteristics (PC) | ☐ 1 ☐ 2 ☐ 3 ☐ 4 ☐ 5 ☐ 6 ☐ 7 ☐ 8 ☐ 9 |
| ☐ Environment & Infrastructure (E&I) | ||
| Physical Characteristics vs. Governance & Institutional Performance | ☐ Physical Characteristics (PC) | ☐ 1 ☐ 2 ☐ 3 ☐ 4 ☐ 5 ☐ 6 ☐ 7 ☐ 8 ☐ 9 |
| ☐ Governance & Institutional Performance | ||
| Socio-Economic Factors vs. Land Use & Urban Form | ☐ Socio-Economic Factors (SE) | ☐ 1 ☐ 2 ☐ 3 ☐ 4 ☐ 5 ☐ 6 ☐ 7 ☐ 8 ☐ 9 |
| ☐ Land Use & Urban Form (LU&UF) | ||
| . Socio-Economic Factors vs. Housing | ☐ Socio-Economic Factors (SE) | ☐ 1 ☐ 2 ☐ 3 ☐ 4 ☐ 5 ☐ 6 ☐ 7 ☐ 8 ☐ 9 |
| ☐ Housing (H) | ||
| Socio-Economic Factors vs. Transportation | ☐ Socio-Economic Factors (SE) | ☐ 1 ☐ 2 ☐ 3 ☐ 4 ☐ 5 ☐ 6 ☐ 7 ☐ 8 ☐ 9 |
| ☐ Transportation (T) | ||
| Socio-Economic Factors vs. Environment & Infrastructure | ☐ Socio-Economic Factors (SE) | ☐ 1 ☐ 2 ☐ 3 ☐ 4 ☐ 5 ☐ 6 ☐ 7 ☐ 8 ☐ 9 |
| ☐ Environment & Infrastructure (E&I) | ||
| Socio-Economic Factors vs. Governance & Institutional Performance | ☐ Socio-Economic Factors (SE) | ☐ 1 ☐ 2 ☐ 3 ☐ 4 ☐ 5 ☐ 6 ☐ 7 ☐ 8 ☐ 9 |
| ☐ Governance & Institutional Performance | ||
| Land Use & Urban Form vs. Housing | ☐ Land Use & Urban Form (LU&UF) | ☐ 1 ☐ 2 ☐ 3 ☐ 4 ☐ 5 ☐ 6 ☐ 7 ☐ 8 ☐ 9 |
| ☐ Housing (H) | ||
| Land Use & Urban Form vs. Transportation | ☐ Land Use & Urban Form (LU&UF) | ☐ 1 ☐ 2 ☐ 3 ☐ 4 ☐ 5 ☐ 6 ☐ 7 ☐ 8 ☐ 9 |
| ☐ Transportation (T) | ||
| Land Use & Urban Form vs. Environment & Infrastructure | ☐ Land Use & Urban Form (LU&UF) | ☐ 1 ☐ 2 ☐ 3 ☐ 4 ☐ 5 ☐ 6 ☐ 7 ☐ 8 ☐ 9 |
| ☐ Environment & Infrastructure (E&I) | ||
| Land Use & Urban Form vs. Governance & Institutional Performance | ☐ Land Use & Urban Form (LU&UF) | ☐ 1 ☐ 2 ☐ 3 ☐ 4 ☐ 5 ☐ 6 ☐ 7 ☐ 8 ☐ 9 |
| ☐ Governance & Institutional Performance | ||
| Housing vs. Transportation | ☐ Housing (H) | ☐ 1 ☐ 2 ☐ 3 ☐ 4 ☐ 5 ☐ 6 ☐ 7 ☐ 8 ☐ 9 |
| ☐ Transportation (T) | ||
| Housing vs. Environment & Infrastructure | ☐ Housing (H) | ☐ 1 ☐ 2 ☐ 3 ☐ 4 ☐ 5 ☐ 6 ☐ 7 ☐ 8 ☐ 9 |
| ☐ Transportation (T) | ||
| Housing vs. Governance & Institutional Performance | ☐ Housing (H) | ☐ 1 ☐ 2 ☐ 3 ☐ 4 ☐ 5 ☐ 6 ☐ 7 ☐ 8 ☐ 9 |
| ☐ Governance & Institutional Performance | ||
| Transportation vs. Environment & Infrastructure | ☐ Transportation (T) | ☐ 1 ☐ 2 ☐ 3 ☐ 4 ☐ 5 ☐ 6 ☐ 7 ☐ 8 ☐ 9 |
| ☐ Environment & Infrastructure (E&I) | ||
| Transportation vs. Governance & Institutional Performance | ☐ Transportation (T) | ☐ 1 ☐ 2 ☐ 3 ☐ 4 ☐ 5 ☐ 6 ☐ 7 ☐ 8 ☐ 9 |
| ☐ Governance & Institutional Performance | ||
| Environment & Infrastructure vs. Governance & Institutional Performance | ☐ Environment & Infrastructure (E&I) | ☐ 1 ☐ 2 ☐ 3 ☐ 4 ☐ 5 ☐ 6 ☐ 7 ☐ 8 ☐ 9 |
| ☐ Governance & Institutional Performance |