
Eatery Environmental Atmosphere and Eating Behaviors among Customers
- Jessyl M. Licera1
- Jessa Mae M. Licera
- John Mark B. Lazaro
- 2520-2534
- Mar 10, 2025
- Environment
Eatery Environmental Atmosphere and Eating Behaviors among Customers
Jessyl M. Licera1, Jessa Mae M. Licera2, John Mark B. Lazaro3
1Student, Santo Tomas College of Agriculture Sciences and Technology
2Teacher, Sto. Tomas National High School,
3Instructor, Santo Tomas College of Agriculture Sciences and Technology
DOI: https://dx.doi.org/10.47772/IJRISS.2025.9020196
Received: 04 February 2025; Accepted: 10 February 2025; Published: 11 March 2025
ABSTRACT
This study assessed the level of eatery environmental atmosphere and eating behaviors among customers in Santo Tomas, Davao del Norte. Descriptive-correlational research design was employed to determine the relationship between the two variables. The respondents of this study were 170 customers of the eatery business establishments of Santo Tomas, Davao del Norte. The respondents were identified through a stratified random sampling technique. Two sets of adapted questionnaires were used to obtain the information from the respondents. The findings of this study revealed that the level of the eatery’s environmental atmosphere in terms of place management and place design was very high. Moreover, the investigation found that the level of eating behaviors among customers in terms of enjoyment of food, emotional over-eating, emotional under-eating, food fussiness, and food responsiveness was very high. It was also found in the study that there was a significant relationship between the eatery’s environmental atmosphere and eating behaviors among customers. Furthermore, the findings of this research hold practical implications for enhancing workforce stability, customer satisfaction, and overall community prosperity.
Keywords: Eatery Environmental Atmosphere, Eating Behaviors, Descriptive-Correlational, Philippines
INTRODUCTION
Eating behaviors have been recognized as a crucial aspect of life, significantly influencing long-term health outcomes ([1]). These complex behaviors, learned particularly during formative years, are essential for growth and survival. They encompass a variety of aspects, including how often we eat, the types of food we choose, portion sizes, and even the speed at which we consume our meals. Physiological, psychological, social, and environmental factors all played a role in shaping our eating habits ([2]). Dieting and established eating patterns reflected these behaviors and the underlying motivations behind them. However, research has also identified concerning trends in consumer consumption patterns. Unfavorable emotions like sadness, anger, frustration, anxiety, fear, and boredom triggered unhealthy food choices in the past ([3]). Furthermore, consumers often exhibited unpredictable eating patterns. Both normal-weight and overweight individuals were heavily influenced by negative emotions, leading to unhealthy dietary behaviors and poor food choices ([4]).
For several years, both obesity and overweight were defined by an excessive accumulation of fat that posed a health risk. The World Health Organization ([5]) established a body mass index (BMI) of 30 percent or higher as the threshold for obesity, with overweight being defined by a BMI exceeding 25. Studies (e.g., poll, 2020) revealed that nearly 75% of respondents frequently dined out at least once a week, with over 50% favoring full-service restaurants. While some fast-food establishments offered nutritional information, it was not always readily available or easily understandable.
Research demonstrated that in the UK, approximately 25% of men’s and 20% of women’s daily calorie intake came from eating out, with one in six meals consumed away from home. This highlighted the growing concern of obesity as a significant social issue. Therefore, stakeholders should collaborate to educate and empower individuals about obesity, underweight conditions, and unhealthy eating habits ([6]). Furthermore, the United States held the highest global childhood and young adult obesity rate in 2015, with nearly 13% of the population affected. In contrast, Egypt possessed the highest adult obesity rate at around 35%. Ignoring weight gain could lead to potentially fatal diseases like diabetes, cancer, and heart disease ([7]). The World Health Organization (2024) reported that the average prevalence of overweight and obesity ranged from 74% to 86% for women and 69% to 77% for men in Egypt, Saudi Arabia, the United Arab Emirates, Kuwait, Jordan, and Bahrain. Consequently, informing customers about the nutritional content of their food purchases became essential.
In the Philippines, particularly in Muntinlupa City, residents exhibited a diverse range of eating behaviors. These behaviors spanned a spectrum, encompassing everything from selective eating to problematic patterns like disordered or disinhibited eating, irregular meals, and overconsumption. Several studies documented that poor nutrition remained a significant concern in Filipino eateries, with improper eating habits identified as a contributing factor ([8]). Meanwhile, in Tondo, Manila, a shift in eating habits and personality types had been observed. This transformation stemmed from a desire for self-actualization and a boost in self-esteem. To achieve this, residents readily embraced culinary exploration, venturing beyond their established food preferences (past tense of “experiment” and “disregarding”). A multitude of factors undoubtedly influence eating behaviors, but research suggested that specific lifestyle choices and sociodemographic characteristics significantly impact customer behavior within eateries ([9]).
A recent study in Davao City, Philippines, found an 11% higher prevalence of overweight and obesity among teenagers. ([10]). Given that adolescence is a period of rapid growth and significant dietary changes compared to childhood, poor eating habits during this time can have lasting consequences. These consequences included decreased workforce productivity and health problems later in life ([11]).
On the other hand, a review of existing literature revealed comparable research on the relationship between eating behaviors and environments. The study by Kvalsvik et al. ([12]) titled “Environmental Factors that Impact the Eating Behaviors of Home-Living Older Adults” contributed to this knowledge base by identifying environmental factors that influence the eating habits of elderly individuals living at home. However, no prior research was found that specifically examined customers as a mediating factor between the ambiance of an eatery and their eating behaviors. In relation, ([13]) argued for the importance of public health initiatives that encourage healthy eating practices in restaurants. These initiatives could include removing high-calorie, high-fat, and high-salt options from menus, along with employing healthier and visually appealing cooking methods. While previous research has established the influence of restaurant ambiance on eating behaviors, the specifics of these spatial variations remain unclear.
Therefore, this study aimed to address the concerns of customers regarding the social and physical environment of restaurants. These factors included the presence of other people, sound, temperature, smell, color, and distractions within the dining space. The study sought also to investigate how these factors might influence food intake and behaviors, ultimately impacting customer food choices, preferences, and overall dining experience. Furthermore, the urgency to conduct this study stemmed from the potential to improve overall health through insights into the eating behaviors of this demographic. Researchers embarked on this project to explore, via extensive observations, whether the eatery’s environmental atmosphere in Tibal-og, Santo Tomas, Davao del Norte impacted customer behavior.
Statement of the Problem
This study aimed to determine the significant relationship between the Eatery Environmental Atmosphere and Eating Behaviors among Customers at Tibal-Og, Santo Tomas Davao del Norte. Specifically, the study sought to answer the following questions:
1. What is the level of Eatery Environmental Atmosphere in terms of:
- place management; and
- place design?
2. What is the level of Eating Behaviors in terms of:
- enjoyment of food;
- emotional over-eating;
- emotional under-eating;
- food fussiness; and
- food responsiveness?
3. Is there any significant relationship between the Eatery Environmental Atmosphere and Eating Behaviors among Customers at Tibal-Og, Santo Tomas Davao del Norte?
Hypothesis
In this study, the researchers tested the null hypothesis at a 0.05 level of significance. This hypothesis proposed that there is no significant relationship between the eatery’s environmental atmosphere and customers’ eating behaviors.
Theoretical Framework
This study drew upon Bandura’s ([14]) Learning Theory on Knowledge, Attitude, and Practice (KAP) as its foundation. Building on the work of Wang et al. ([15]), which identified three phases of behavior change such as learning, establishing practices, and forming beliefs, the study explored the connection between knowledge and food-related behaviors. Additionally, the study incorporated the ASE model, developed by De Vries et al. ([16]). This model posits that eating behaviors are driven by the intention to perform them, which can be influenced by three cognitive factors such as self-efficacy, social context, and perceived behavioral control. The inclusion of the ASE model ensured the framework’s applicability across cultures. However, as Green LW et al. ([17]) elaborated upon with the socio-ecological model, the psychological factors of the ASE model like attitude, social influences, and self-efficacy became embedded within the social, cultural, and physical environment of teenagers’ settings. This broader perspective recognized eating behaviors as the product of a complex interplay between various factors operating at different levels.
Conceptual Framework
This study sought to investigate the association between the eatery’s environmental atmosphere and customer eating behaviors in Tibal-Og, Santo Tomas, Davao del Norte. As illustrated in Figure 1, a conceptual model was developed to depict how the independent variable influences the dependent variable related to customer eating behaviors.
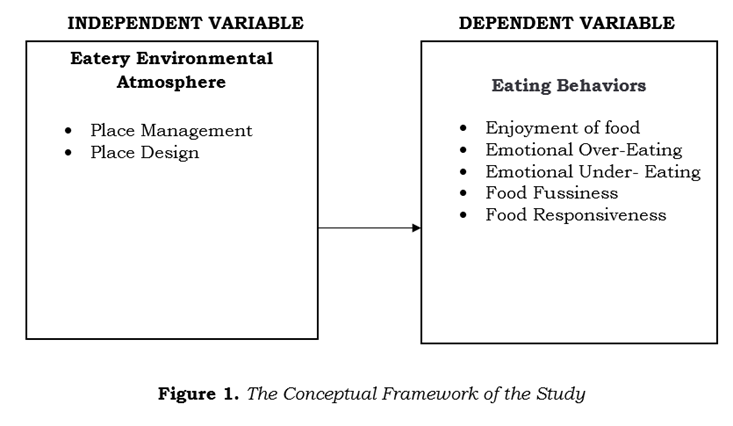
Drawing on the work of Ji & Ko ([18]), the eatery environmental atmosphere served as the independent variable in this study. This variable encompassed two indicators: place management (PM) and place design (PD). These indicators aimed to understand how an individual’s surrounding environment might impact their eating behaviors.
Conversely, eating behaviors constituted the dependent variable, as defined by Hunot et al. ([19]). This variable was further broken down into five indicators: enjoyment of food (EF), emotional overeating (EOE), emotional undereating (EUE), food fussiness (FF), and food responsiveness (FR).
METHODOLOGY
In this chapter, the research design, research subjects, research instruments, data-gathering procedures, and statistical treatments employed were described. These methods aimed to collect data and information relevant to the relationship between the eatery’s environmental atmosphere and eating behaviors among customers in Tibal-Og, Santo Tomas, Davao del Norte.
Research Design
In this study, a descriptive-correlational research design was employed. Descriptive research aimed to provide a precise and systematic account of populations, situations, or phenomena ([20]). Correlational research, on the other hand, examined two variables, evaluated their statistical relationship, and allowed researchers to conclude using a non-experimental methodology ([21]).
A quantitative approach was adopted to investigate the eatery’s environmental atmosphere and eating behaviors. This involved collecting numerical data. Quantitative research, by definition, involves collecting numerical data and applying mathematical, statistical, or computational methods for interpretation ([22]). The quantitative approach follows a methodical research process established by predetermined guidelines. It begins with developing research questions and culminates with interpretations and conclusions drawn from data analysis and selection, all based on the chosen study design. Therefore, this study emphasized processing data from variable experiments to identify significant relationships between the environmental atmosphere of eateries and eating behaviors.
Research Subject
The study targeted customers of the eatery in Tibal-og, Santo Tomas, Davao del Norte. These customers, with their diverse experiences and perceptions, possessed the ability to provide valuable insights about the eatery’s environmental atmosphere. Given the information gathered, the total customer base across the three eateries amounted to 450 individuals. Due to the population’s size, a stratified random sampling technique was employed. This method is particularly advantageous for large populations, as evidenced by Taherdoost ([23]). Stratified random sampling also aligns well with this study’s goals, as it enables researchers to select a sample that accurately reflects the entire population ([24]). In this approach, the researchers first divided the students into distinct strata, followed by a random selection of respondents from each stratum.
Research Instrument
In this study, the researchers employed two adapted survey questionnaires. Specifically, one for the independent variable, and another for the dependent, to explore the connection between an eatery’s environmental atmosphere and customer eating behaviors. To ensure the questionnaires’ validity, these instruments underwent validation by a panel of experts and an external validator. This rigorous process guaranteed a high level of dependability for the questionnaires, making them well-suited to achieve the study’s primary objective.
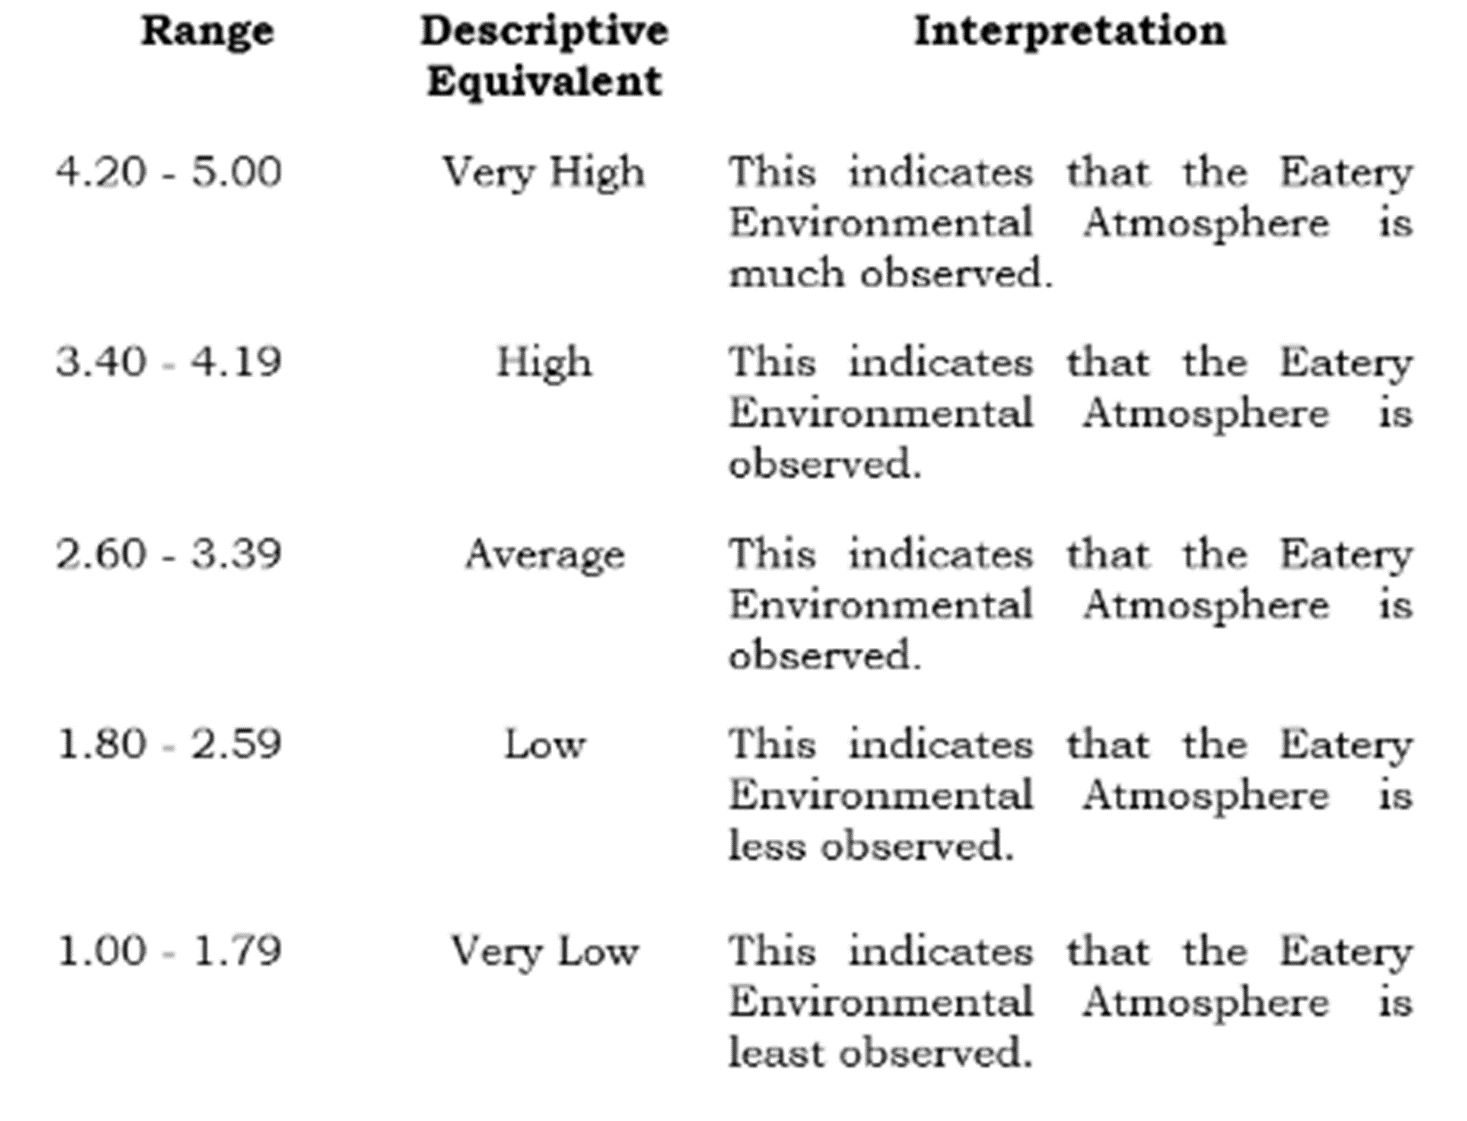
Eatery Environmental Atmosphere Questionnaire (EEAQ). Adapted from the study of Ji and Ko, ([18]) titled “Developing a Catering Quality Scale for University Canteens in China: From the Perspective of Food Safety”, the eatery atmosphere was the independent variable that was measured by the survey questionnaire. Two (2) indicators were included in the instrument’s six-item survey questionnaire such as place management (3 items), and place design (3 items). The Likert scale, which had five points ranging from five (5) for extremely satisfied, four (4) for agree, three (3) for neutral, two (2) for disagree, and one (1) for strongly disagree, collectively served as the basis for this questionnaire.
The following range, descriptive equivalent, and interpretation were applied in determining the level of eatery environmental atmosphere:
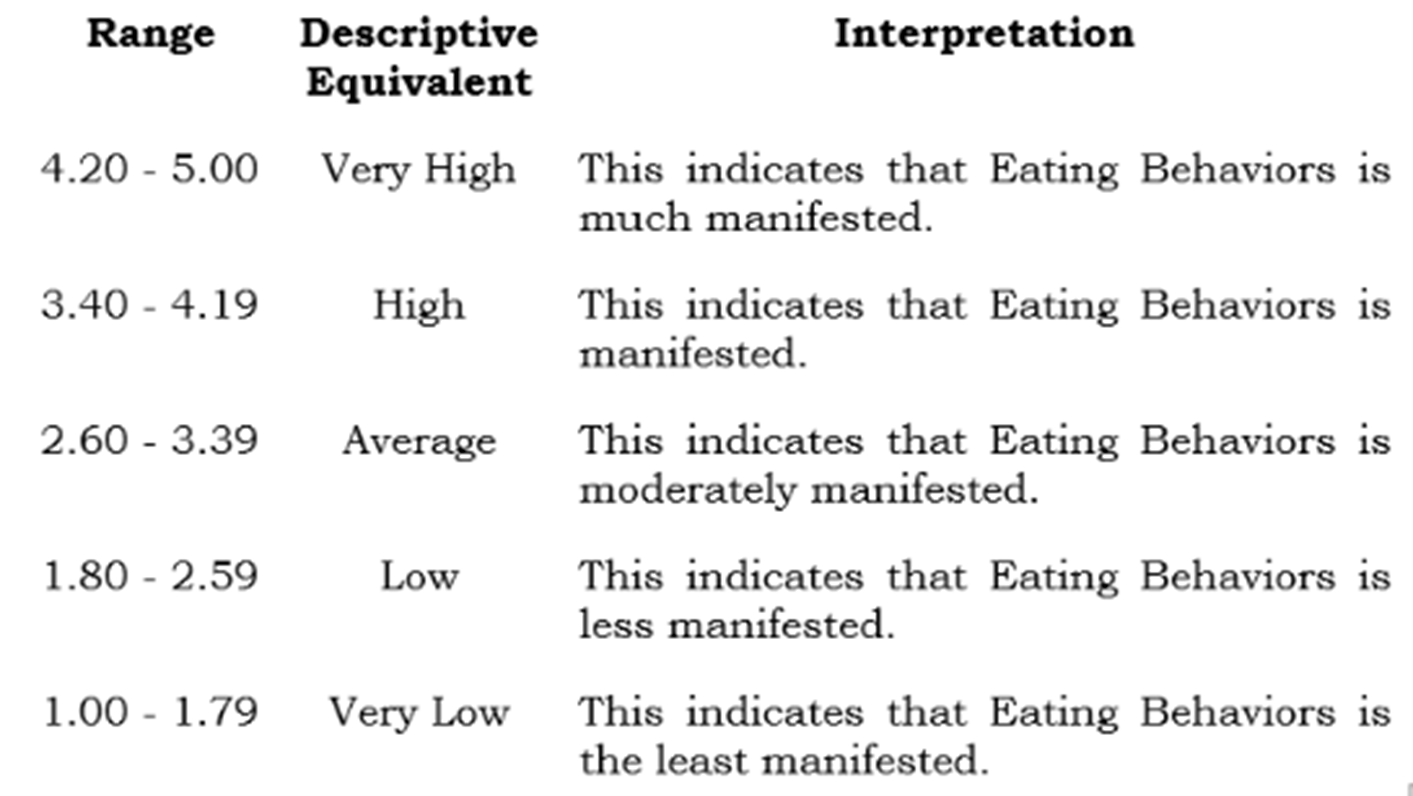
Eating Behaviors Questionnaire (EBQ). Adapted from the study of Mostafazadeh et al. ([25]) titled “Assessing the association between nutrition literacy and eating behaviors among nursing students: a cross-sectional study”, the eating behaviors were the dependent variable that were measured by the survey questionnaire. This instrument consisted of a 22-item survey questionnaire with five indicators such as food responsiveness (4 things), food fussiness (5 items), emotional undereating (5 items), emotional overeating (5 items), and enjoyment of food (3 items). The Likert scale that was used for this questionnaire had five points ranging from five (5) for very satisfied, four (4) for agree, three (3) for neutral, two (2) for disagree, and one (1) for strongly disagree.
The following range, descriptive equivalent, and interpretation were applied in determining the level of eating behaviors:
Statistical Treatment of Data
The statistical tools that the researchers used for data analysis and interpretation were the following:
Mean. This was used to determine the level of the eatery’s environmental atmosphere and customers’ eating behaviors.
Pearson (r). This was used to determine the relationship between the eatery’s environmental atmosphere and customers’ eating behaviors.
RESULTS AND DISCUSSIONS
This chapter analyzed and interpreted data collected from customers of the Santo Tomas, Davao del Norte eatery. The data focused on the eatery’s environmental atmosphere and customer eating behaviors. The researchers arranged the data to address the statement of the problem identified earlier.
Level of Eatery Environmental Atmosphere in terms of Place Management
Table 1 presented the level of place management for the Santo Tomas eatery’s ambient setting in Davao del Norte. The table revealed an overall mean of 4.67, a standard deviation of 0.51, and a very high descriptive quality. This data aimed to illustrate the consistently high level of place management observed at the eatery.
Among the individual items assessed, number 3 stood out with the highest mean score of 4.74. Following closely behind was item number 4, with a mean of 4.72. Item number 5, despite having the lowest mean of 4.60, still possessed a very high descriptive level. This consistently strong performance across all items (ranging from 4.60 to 4.74) suggested close monitoring of place management practices.
Table 1 Level of Eatery Environmental Atmosphere in Terms of Place Management
| Items | Mean | SD | Descriptive Equivalent |
| 1. The washroom is clean and disinfected. | 4.64 | 0.56 | Very High |
| 2. The eatery provides regular inspection of firefighting equipment. | 4.67 | 0.51 | Very High |
| 3. The dining place is equipped with ample sinks and taps. | 4.74 | 0.47 | Very High |
| 4. The eatery includes marks for flammable/hazardous materials, storage conditions, and brand elements. | 4.72 | 0.51 | Very High |
| 5. The facility arrangement is well-ordered and easy to find. | 4.60 | 0.53 | Very High |
| Average | 4.67 | 0.51 | Very High |
In the past, research has emphasized the importance of considering the surrounding environment in eateries as a key component of place management ([26]). Studies have shown that improvements to an eatery’s environmental atmosphere can lead to a multitude of benefits, including increased sales, happier customers, reduced expenses, and even a shift in customer eating habits. Furthermore, ensuring a kitchen layout that promotes hygiene habits has been a crucial aspect of eatery design. This focus on food safety is often reflected in the placement of the sink, which acts as the main focal point, positioned directly opposite the preparation area ([27]). Historically, eatery design has tended to follow a fairly standard layout, likely due to the core function of these establishments being focused on cooking. However, it is important to note that the frequent use of heat sources and flames makes eateries one of the most common types of establishments for fire outbreaks ([28]).
Level of Eatery Environmental Atmosphere in terms of Place Design
Table 2 illustrated the degree of place design that characterized the eatery’s environmental atmosphere. As evidenced by the overall mean of 4.57, a very high descriptive level), and a standard deviation of 0.62, this table indicated that careful attention had been paid to the eatery’s environmental ambiance and place design in Santo Tomas, Davao del Norte.
Among the design elements, item number 5 achieved the highest mean (4.63), followed closely by item number 4 (4.61) and item number 3 (4.48), which had the lowest mean. However, every item in the place design category fell between 4.48 and 4.63, which translates to “very high” descriptively. Even item number seven, despite having the lowest mean, maintained a very high descriptive level, reinforcing the conclusion that the eatery’s place design was well-observed.
Table 2 Level Eatery Environmental Atmosphere in terms of Place Design
| Items | Mean | SD | Descriptive Equivalent |
| 1. The lighting and music are enjoyable and adjusted to appropriate levels. | 4.54 | 0.63 | Very High |
| 2. The space planning and design of dining places is well planned. | 4.58 | 0.60 | Very High |
| 3. The seating arrangements provide comfort. | 4.48 | 0.63 | Very High |
| 4. The ambiance of the eatery was inviting. | 4.61 | 0.59 | Very High |
| 5. The temperature in the eatery is comfortable. | 4.63 | 0.63 | Very High |
| Average | 4.57 | 0.62 | Very High |
Previously, researchers focused on how the design and ambiance of an eatery influenced customer assessments and eating behaviors ([29]). Studies suggested that place design played a more prominent role in shaping these behaviors. This influence often involved systematic exposure to the environment’s design elements.
However, recent trends have shifted the focus to the impact of external factors. As the climate changes, researchers are increasingly interested in how extreme weather events affect customer behavior. Zhang et al. ([30]) proposed that surrounding temperature might indirectly influence eating habits and even happiness levels by impacting a person’s emotional state. Similarly, research by Pijls et al. ([31]) explored the connection between chair design and well-being. They investigated whether the materials and design of chairs could affect comfort, which in turn, might lead to feelings of relaxation and ultimately, a greater awareness of one’s eating practices.
Summary of Level of Eatery Environmental Atmosphere
Table 3 provided a summary of the environmental atmosphere within the eateries. The table displayed a total mean score of 4.62 with a standard deviation of 0.57, indicating a very high descriptive level. This suggested that the eateries in Santo Tomas, Davao del Norte, maintained a well-maintained level of environmental atmosphere.
Among all the evaluated items, place management scored the highest mean, at 4.67, which was descriptively similar to “very high.” This demonstrated that the eatery environment for customers was well monitored. Conversely, place design items had the lowest mean of 4.57, which still translates to “very high” descriptively. Even with the lowest ranking, this indicated that the eateries in Santo Tomas, Davao del Norte, possessed a well-observed spatial design.
Table 3 Summary of the Level of Eatery Environmental Atmosphere
| Indicators | SD | Mean | Descriptive Equivalent |
| 1. Place Management | 0.51 | 4.67 | Very High |
| 2.Place Design | 0.62 | 4.57 | Very High |
| Overall | 0.57 | 4.62 | Very High |
Studies have shown that the environmental atmosphere of eateries plays a significant role in shaping customer behavior. Before and following direct interactions with customers, elements like place management and design have an impact ([32]). Research by Pijls ([33]) further demonstrated that factors such as chair comfort and acoustics also influence how patrons behave within a restaurant setting. In essence, these findings suggested that an environment that evokes positive emotions can influence stress management, dietary choices, and even eatery layouts. Ultimately, as highlighted by Ariffin et al. ([34]), this manipulation of psychological states can lead customers to desire and ultimately purchase specific goods or services.
Level of Eating Behaviors in terms of Enjoyment of Food
Table 4 presented the degree of eating behaviors about meal preparation and enjoyment. The table revealed a quite high descriptive level, with an overall mean of 4.58 and a standard deviation of 0.59. This data suggested a high expectation for the quality of meals at Santo Tomas eatery in Davao del Norte.
Among the individual items, number 1 held the highest mean at 4.61, followed closely by items 2 and 4 (both at 4.60) and item 5 (at 4.52). Interestingly, every item in the food preparation area demonstrated a very high descriptive level, ranging from 4.5 to 2.61. Even item number two, which possessed the lowest mean, maintained a very high degree of description. This implies that the act of cooking itself might be more prominent than the specific details of preparation.
Table 4 Level of Eating Behaviors in terms of Enjoyment of Food
| Items | SD | Mean | Descriptive Equivalent |
| 1. I love the food. | 0.57 | 4.61 | Very High |
| 2. I enjoy eating. | 0.56 | 4.60 | Very High |
| 3. I look forward to mealtime | 0.60 | 4.55 | Very High |
| 4. I always pay attention to my nutritional knowledge. | 0.56 | 4.60 | Very High |
| 5. I like to eat fast food. | 0.65 | 4.52 | Very High |
| Average | 0.59 | 4.58 | Very High |
The satisfaction of a primal urge that results in a feeling of well-being is the enjoyment of food. A person’s fondness for food might elicit feelings that support eating well ([34]). Moreover, the emphasis placed on food’s health benefits and enjoyment when trying to persuade people to alter their eating behaviors may help to partially explain why customer-wellness initiatives have not been as successful as they could be ([35]).
Level of Eating Behaviors in terms of Emotional Over-Eating
Table 5 revealed the extent of emotional overeating among the eatery’s customers. The overall mean score, as shown in the table, was a high 4.46 with a standard deviation of 0.67, indicating a very high descriptive level of emotional overeating. This suggests that customers frequently engage in emotional overeating behavior.
Table 5 Level of Eating Behavior in terms of Emotional Over-Eating
| Items | Mean | SD | Descriptive Equivalent |
| 1. I eat more when I’m annoyed. | 4.52 | 0.67 | Very High |
| 2. I eat more when I’m worried. | 4.54 | 0.63 | Very High |
| 3. I eat more when I’m upset. | 4.46 | 0.71 | Very High |
| 4. I eat more when I’m anxious. | 4.33 | 0.66 | Very High |
| 5. I eat more when I’m angry. | 4.47 | 0.70 | Very High |
| Average | 4.46 | 0.67 | Very High |
Breaking down the data by item, number 2 had the highest mean score (4.54), followed closely by number 1 (4.52). Item number 4, with a score of 4.33, had the lowest mean. Interestingly, despite having the lowest mean, item 4 also displayed a very high descriptive level, suggesting a relatively narrow range of scores (4.33 – 4.54) for emotional overeating associated with that particular item. This pattern further reinforces the notion that emotional overeating is prevalent among the clientele.
A customer’s eating behaviors may be motivated by emotions. The strongest predictor of emotional overeating was found to be emotional regulation challenges, indicating that people with emotional regulation issues are more prone to emotional eating behavior ([36]). Moreover, the tendency to overeat in reaction to feelings is known as emotional overeating. This has been determined to be an important risk factor for repeated weight gain. Because of the increased energy intake and potential mental health risks, this type of overeating may have an impact on overall health ([37]). Stress, worry, disappointment, and feelings of loneliness are examples of unpleasant emotions that might lead to emotional eating ([38]).
Level of Eating Behaviors in terms of Emotional Under-Eating
Table 6 presented data on the prevalence of emotional undereating in eating behaviors. The descriptive level for all items was quite high, with an overall mean of 4.58 and a standard deviation of 0.61. This finding suggested that customers at the Santo Tomas, Davao del Norte eatery displayed a significant tendency towards emotional undereating.
Among the items, numbers 3 and 4 had the highest means, both at 4.63. Item number 2 followed closely with a mean of 4.56, while item number 5 had the lowest mean at 4.52. Interestingly, (previously despite) even with the lowest mean, item number five still exhibited a very high descriptive level. This consistency across all meal delivery items, with a range of 4.52-4.63, further reinforced the notion that customers’ emotional undereating was highly prevalent.
Table 6 Eating Behaviors in terms of Emotional Under-Eating
| Items | Mean | SD | Descriptive Equivalent |
| 1. I eat less when I’m worried. | 4.55 | 0.60 | Very High |
| 2. I eat less when I’m angry. | 4.56 | 0.59 | Very High |
| 3. I eat less when I’m upset. | 4.63 | 0.63 | Very High |
| 4. I eat less when I’m annoyed. | 4.63 | 0.59 | Very High |
| 5. I eat less when I’m anxious. | 4.52 | 0.64 | Very High |
| Average | 4.58 | 0.61 | Very High |
Anxiety and depressive feelings can affect appetite and cause some people to eat less ([39]). Emotional undereating is the inclination to eat in reaction to feelings. It is thought to be a significant risk factor for recurrent weight loss. Due to a lack of calorie intake and mental health, such undereating can have an impact on overall health ([40]). Moreover, eating behaviors are influenced by emotions and stress. Some people may experience a reverse effect on appetite from anxiety and depression, wanting to eat less ([41]).
Level of Eating Behaviors in terms of Food Fussiness
Table 7 presented the degree of food fussiness associated with eating behaviors. As the table revealed, the descriptive level was quite high, with an overall mean of 4.55 and a standard deviation of 0.64. It aimed to demonstrably illustrate the degree of food fussiness in eating behaviors.
The item with the highest mean, number 2, was followed by item number 4 with a mean of 4.64, and item number 5 with a mean of 4.42. All items in the food fussiness category exhibited a quite high descriptive level, with a range of 4.42-4.66. Interestingly, despite having the lowest mean, item number five presented a very high descriptive equivalent, suggesting that customers’ food fussiness was particularly evident in this category.
Table 7 Level of Eating Behaviors in terms of Food Fussiness
| Items | Mean | SD | Descriptive Equivalent |
| 1. I often decided that I don’t like a food, before tasting it. | 4.45 | 0.75 | Very High |
| 2. I refuse new foods at first. | 4.66 | 0.58 | Very High |
| 3. I enjoy tasting new foods. | 4.59 | 0.64 | Very High |
| 4. I am interested in tasting new food I haven’t tasted before. | 4.64 | 0.59 | Very High |
| 5. I enjoy wide variety of foods. | 4.42 | 0.67 | Very High |
| Average | 4.55 | 0.64 | Very High |
According to Harmancıoğlu and Kabaran ([42]), food fussiness is defined by a restricted food intake, a reluctance to try new meals, and a preference for some foods over others based on characteristics like color, texture, scent, or appearance. Furthermore, food fussiness has been linked to high levels of worry and annoyance that have a significant impact on customers’ eating patterns, as well as conflict in the family and arguments over meals ([43]). Fussy eating is defined as consuming too few or too few different foods by turning down a significant portion of both known and unknown items ([44]).
Level of Eating Behaviors in terms of Food Responsiveness
Table 8 displayed the degree of food responsiveness in eating behaviors. The overall mean score, as shown in the table, was 4.48, indicating a very high descriptive level and a standard deviation of 0.71. This suggested that customers at the eatery in Santo Tomas, Davao del Norte, were quite receptive to the cuisine.
The highest mean score, 4.57, belonged to item number 3. This was followed closely by item number 4 with a mean of 4.51, and item number 1 with a mean of 4.38. Notably, every item in the impulse buying table fell within a very high descriptive range, between 4.38 and 4.57. Even though item number one had the lowest mean, it still achieved a very high descriptive level. This implied that the food responsiveness at the eatery in Santo Tomas, Davao del Norte, had a considerably strong influence on customers’ eating behavior.
Table 8 Level of Eating Behaviors in terms of Food Responsiveness
| Items | Mean | SD | Descriptive Equivalent |
| 1. I often feel hungry when I am with someone who is eating. | 4.38 | 0.76 | Very High |
| 2. Given the choice, I would eat most of the time. | 4.45 | 0.74 | Very High |
| 3. I am always thinking about food. | 4.57 | 0.68 | Very High |
| 4. When I see or smell food that is like, it makes me want to eat. | 4.51 | 0.72 | Very High |
| 5. Eating the way I do gives me a sense of satisfaction. | 4.48 | 0.67 | Very High |
| Average | 4.48 | 0.71 | Very High |
High food responsiveness happens when there is a feeling of hunger while you observe, smell, or taste palatable food ([45]). A distinguishing feature that clients can notice is food responsiveness; higher food responsiveness has been connected to being overweight and a rapid increase in weight ([46]). Apart from appetitive characteristics, several elements can also cause food responses, such as the aroma of the food, life satisfaction, and the customer’s emotional condition at that particular moment ([47]).
Summary of the Level of Eating Behaviors
Table 9 presented a summary of customer eating behaviors. The data revealed a very high descriptive level with an overall mean of 4.53 and a standard deviation of 0.64. This suggested that customers at the Santo Tomas, Davao del Norte eatery exhibited highly visible eating behaviors.
Furthermore, enjoying food and emotional undereating displayed the highest means (both 4.58) which translated to a “very high” descriptive level. This indicated that customers in Santo Tomas, Davao del Norte exhibited more pronounced eating behaviors in these areas. Conversely, emotional overeating had the lowest mean (4.46), although it still fell under the “very high” descriptive category. This suggested that customers displayed less pronounced behavior in emotional overeating compared to other aspects.
Eating behaviors include food choices and motives, feeding patterns, dieting, and eating-related conditions like overweight or obesity, eating problems, and feeding disorders ([48]). The timing of meals, the amount of food consumed, the kind of food preferred, and the choice of food are all influenced by the intricate interactions of physiologic, psychological, social, and genetic factors ([49]). Thus, it would seem that eating behaviors can influence people’s psychology to make them desire and eventually consume a specific food or good ([50]).
Table 9 Summary of the Level of Eating Behaviors
| Indicators | Mean | SD | Descriptive Equivalent |
| 1. Enjoyment of Food | 4.58 | 0.59 | Very High |
| 2. Emotional Over-Eating | 4.46 | 0.67 | Very High |
| 3. Emotional Under-Eating | 4.58 | 0.61 | Very High |
| 4. Food Fussiness | 4.55 | 0.64 | Very High |
| 5. Food Responsiveness | 4.48 | 0.71 | Very High |
| Overall | 4.53 | 0.64 | Very High |
Significance of the Relationship Between Eatery Environmental Atmosphere and Eating Behaviors
Table 10 examined the correlation between eating at eateries, the environmental atmosphere, and customer eating behaviors. The table revealed an overall r-value of 0.312 with a p-value of 0.001. Since this p-value was less than 0.05, the null hypothesis was rejected. This result indicated a statistically significant relationship between the environmental atmosphere of eateries and eating behaviors. In other words, the data suggested that the environmental design of the eatery in Santo Tomas, Davao del Norte, had a more established and positive influence on customer eating behaviors. Therefore, a more developed environmental atmosphere appeared to be associated with improved customer eating behaviors.
Table 10 Significance of the Relationship between Eatery Environmental Atmosphere and Eating Behaviors
| Variables Correlated | r | p-value | Decision on Ho | Decision on Relationship |
| Environmental Atmosphere and Eating Behaviors | 0.312 | 0.001 | Rejected | Significant |
This research examined the impact of the eatery’s environmental atmosphere on customer behavior. Two key indicators were used to measure the quality of service and the overall ambiance. The findings revealed a significant influence of customers’ perceptions on both the eatery’s atmosphere and their eating behaviors. This highlighted the fact that different settings can interpret customer dining habits in varying ways.
Furthermore, the study explored the role of attitudes in shaping behavior. Previous research by Niewczas-Dobrowoslka ([51]) has shown that attitudes serve a multitude of crucial purposes, including directing decisions and behaviors and fostering a sense of self and community. Additionally, Brinol et al. ([52]) suggested that attitudes can change depending on the degree to which a person’s thinking and eating patterns are affected. Moreover, the research also built upon the understanding of how emotions influence dietary choices. Moreover, Heidari et al. ([53]) noted that humans frequently modify their dietary preferences or selections in response to their cyclical psychological moods. Examples of this included seeking comfort foods during periods of depression or experiencing appetite fluctuations during stressful situations.
SUMMARY OF FINDINGS, CONCLUSIONS, AND RECOMMENDATIONS
Summary of Findings
- The study found that the eatery environmental atmosphere fostered a very positive atmosphere, with an average mean score of 4.62, descriptively considered as very high. The standard deviation of 0.57 indicated good consistency in these observations.
- The level of eating behaviors had an overall mean of 4.53, with a descriptive equivalent of very high. It obtained an overall standard deviation of 0.64, which indicated that eating behaviors were much more manifest.
- The relationship between the eatery environmental atmosphere and eating behaviors showed a positive correlation with a p-value of 001, which was lower than the level of significance of 0.05. The result indicated that the null hypothesis was rejected.
Conclusions
- The level of the eatery’s environmental atmosphere was very high. The findings revealed that the environmental atmosphere of eateries had a great influence on eating behaviors among customers. It was one of the most important factors that resulted in higher levels of eating behaviors. The results of the analysis showed that the customers had the power to explain the environmental atmosphere of eateries, followed by place design and place management. Concerning the two factors, it was noted that customers went to the eatery not just to eat but also to enjoy good service provided with adequate design and placement.
- The level of eating behavior was very high. The findings showed that eating behaviors were among the variables influencing customers’ healthy eating practices. Customers purchased and enjoyed the products that ensured safety and quality. To make the customers go to the eatery and purchase the products and services, the eatery ensured the quality of the service and the environmental atmosphere were good for the customers’ preferences. Hence, considering factors that encouraged the enhancement of the eatery’s environmental atmosphere was crucial considering various factors influencing customers’ eating behaviors at the market, as customers can easily switch eateries if the quality does not meet their expectations.
- There was a significant relationship between the level of eatery environmental atmosphere and eating behaviors. It was noted that the higher the eatery’s environmental atmosphere, the higher the eating behaviors improved. Based on the results of this study, the relationship between the eatery’s environmental atmosphere and eating behaviors among customers was found to be significant. For owners in the eatery, it was hoped that this study could influence them to implant more effective strategies in terms of the environmental atmosphere of the eatery by providing good quality service, placement, and design to enhance the positive effect on the eating behaviors of the customers.
Recommendations
- Management may maintain and focus on the atmosphere of the eatery by applying standards to each placement and design of the eatery.
- Customers were encouraged to enhance their knowledge of the eatery’s environmental atmosphere, management, and place design. However, to prevent bad eating behaviors among customers at the eatery, customers may know the importance of the ambiance to enhance their health and well-being. In addition, the customer’s inadequate eating behavior may be addressed through self-discipline by eating under their decisions and actions and providing a feeling of self-identity and belonging.
- For future researchers, this study may open avenues for further exploration into the relationship between the eatery’s environmental atmosphere and eating behaviors among customers. Future research may go more deeply into the precise tactics and measures that produce the best results in raising customers’ engagement and lowering attrition rates.
REFERENCES
- El Ansari, W., Suominen, S., & Samara, A. (2015). Eating habits and dietary intake: is adherence to dietary guidelines associated with importance of healthy eating among undergraduate university students in Finland?. Central European journal of public health, 23(4), 306-313.
- Fernandes, Vanessa, Filipe Rodrigues, Miguel Jacinto, Diogo Teixeira, Luis Cid, Raul Antunes, Rui Matos, Rafael Reigal, Antonio Hernández-Mendo, Verónica Morales-Sánchez, and et al. (2023). “How Does the Level of Physical Activity Influence Eating Behavior? A Self-Determination Theory Approach” https://doi.org/10.3390/life13020298 Life 13, no. 2:298.
- Vila-Marti, A.; Elío, I.; Sumalla-Cano, S. (2021). Eating Behavior during First- Year College Students, including Eating Disorders – RUVICRUNEAT-CA Project. Protocol of an Observational Multicentric Study. Int. J. Environ. Res. Public Health, 18, 9457. Https: / / doi.org/ 10.3390/ ijerph18189457
- Zenk, S. N., Horoi, I., McDonald, A., Corte, C., Riley, B., & OdomsYoung, A.M. (2014). Ecological momentary assessment of environmental and personal factors and snack food intake in African American women. Appetite, 83, 333-341.
- World Health Organization. (2024). Obesity. Available at http://www.emro.who.int/health-topics/obesity/, Retrieved May 29 2020.
- Rizkallah, É., & Feiler, K.E. (2013). The Effects Of Calorie Count Display On Consumer Eating Behavior: Would It Solve The Obesity Problem? An Empirical Perspective. American Journal of Health Sciences, 4, 79-88.
- Afshin, A., Forouzanfar, M. H., Reitsma, M. B., Sur, P., Estep, K., Lee, A., Marczak, L., Mokdad, A. H., Moradi-Lakeh, M., Naghavi, M., Salama, J. S., Vos, T., Abate, K. H., Abbafati, C., Ahmed, M. B., Al-Aly, Z., Alkerwi, A., Al-Raddadi, R., Amare, A. T., … Murray, C. J. L. (2017). Health Effects of Overweight and Obesity in 195 Countries over 25 Years. The New England journal of medicine, 377(1), 13–27. https://doi.org/10.1056/NEJMoa1614362
- Navarro GC, Tandang NA, Arlan RLC. Nutritional Status among Filipino Elderly: Prevalence and Correlates. Acta Medica [Internet]. 2020 Dec. 31 [cited 2025 Jan. 4];51(4):54-65. Available from: https://actamedica.org/index.php/actamedica/article/view/411
- Angeles-Agdeppa, I., & Custodio, M. R. S. (2020). Food Sources and Nutrient Intakes of Filipino Working Adults. Nutrients, 12(4), 1009. https://doi.org/10.3390/nu12041009
- Espinosa, I. (2023). Alarming 46% surge in obesity among Pinoys. https://www.sunstar.com.ph/amp/story/davao/alarming-46- surge-in-obesity-among-pinoys
- Sato, Y., Miyanaga, M., Wang, D.H. (2020). Psychosocial determinants of fruit and vegetable intake in Japanese adolescents: a school-based study in Japan. Int J Environ Res, 17 (15), pp. 1-11, 10.3390/ijerph17155550
- Kvalsvik, F., Ogaard, T., & Jensen, 0. (2021). Environmental factors that impact the eating behavior of home-living older adults. International Journal of Nursing Studies Advances,3, 100046. https://doi.org/10.1016/j.ijnsa.2021.100046
- Mostafa M. M. Hussein., (2020). Factors Influencing Customers’ Behavior Toward Eating Healthy Food in Restaurants at Minia Governorate in Egypt.PP.227-257. (JAAUTH) Vol. 19, No. 2, https://jaauth.journals.ekb.eg/article_142271_f6a592399ffdbbd95 5e bf040ed9ff258.pdf
- Bandura, A., & National Inst of Mental Health. (1986). Social foundations of thought and action: A social cognitive theory. Prentice-Hall, Inc. https://psycnet.apa.org/record/1985-98423-000
- Wang, J., Chen, L., Yu, M., & He, J. (2020). Impact of knowledge, attitude, and practice (KAP)-based rehabilitation education on the KAP of patients with intervertebral disc herniation. Annals Of Palliative Medicine, 9(2), 388-393. doi:10.21037/apm.2020.03.01
- De Vries H, Dijkstra M, Kuhlman P (1988) Self-efficacy: the third factor besides attitude and subjective norm as a predictor of behavioural intentions. Health Educ Res 3: 273–282.
- Green, L. W., Richard, L., & Potvin, L. (1996). Ecological foundations of health promotion. American journal of health promotion : AJHP, 10(4), 270–281. https://doi.org/10.4278/0890-1171-10.4.270
- Ji, Y. -G., & Ko, W. -H. (2022). Developing a Catering Quality Scale for University Canteens in China: From the Perspective of Food Safety. Sustainability, 14(3), 1281. https://doi.org/10.3390/su14031281
- Hunot-Alexander, C., Arellano-Gómez, L. P., Smith, A. D., Kaufer-Horwitz, M., Vásquez-Garibay, E. M., Romero-Velarde, E., Fildes, A., Croker, H., Llewellyn, C. H., & Beeken, R. J. (2022). Examining the validity and consistency of the Adult Eating Behaviour Questionnaire-Español (AEBQ-Esp) and its relationship to BMI in a Mexican population. Eating and weight disorders : EWD, 27(2), 651–663. https://doi.org/10.1007/s40519-021-01201-9
- McCombes, S (2020). Descriptive Research. Scribbr. https://www.scribbr.com/methodology/descriptive-research/
- Devi, Barkha & Lepcha, Mrs & Basnet, Shakeela. (2023). APPLICATION OF CORRELATIONAL RESEARCH DESIGN IN NURSING AND MEDICAL RESEARCH. Xi’an Shiyou Daxue Xuebao (Ziran Kexue Ban)/Journal of Xi’an Shiyou University. 65. 60-69. 10.17605/OSF.IO/YRZ68.
- Ghanad, A. (2023). An Overview of Quantitative Research Methods. INTERNATIONAL JOURNAL OF MULTIDISCIPLINARY RESEARCH AND ANALYSIS. 06. 10.47191/ijmra/v6-i8-52.
- Taherdoost, Hamed. (2016). Sampling Methods in Research Methodology; How to Choose a Sampling Technique for Research. International Journal of Academic Research in Management. 5. 18-27. 10.2139/ssrn.3205035.
- Nguyen, Trong & Shih, Ming-Hung & Srivastava, Divesh & Tirthapura, Srikanta & Xu, Bojian. (2021). Stratified random sampling from streaming and stored data. Distributed and Parallel Databases. 39. 1-46. 10.1007/s10619-020-07315-w.
- Mostafazadeh, P., Jafari, M. J., Mojebi, M. R., Nemati-Vakilabad, R., & Mirzaei, A. (2024). Assessing the relationship between nutrition literacy and eating behaviors among nursing students: a cross-sectional study. BMC public health, 24(1), 18. https://doi.org/10.1186/s12889-023-17468-9
- Bichler, B.F., Pikkemaat, B. and Peters, M. (2021), “Exploring the role of service quality, atmosphere and food for revisits in restaurants by using a e-mystery guest approach”, Journal of Hospitality and Tourism Insights, Vol. 4 No. 3, pp. 351-369. https://doi.org/10.1108/JHTI-04-2020-0048
- Moreira, Inês & Albano, Helena & Silva, Joana & Teixeira, Paula. (2014). Food safety in the domestic environment. Food Control. 37. 272-276. 10.1016/j.foodcont.2013.09.058.
- Hassanain, M. & Hafeez, M. (2023). Fire safety evaluation of restaurant facilities. Structural Survey. 23. 298-309. 10.1108/02630800510630475.
- Bschaden, A., Dörsam, A.F., Cvetko, K., Kalamala, T., Stroebele-Benschop, N. (2020). The impact of lighting and table linen as ambient factors on meal intake and taste perception, Food Quality and Preference, Volume 79, 103797, ISSN 0950-3293, https://doi.org/10.1016/j.foodqual.2019.103797.
- Zhang, P., O. Deschenes, K. Meng, and J. Zhang, (2018). Temperature effects on productivity and factor reallocation: Evidence from a half million Chinese manufacturing plants. J. Environ. Econ. Manage., 88, 1–17, https://doi.org/10.1016/j.jeem.2017.11.001.
- Pijls, Ruth & Galetzka, Mirjam & Groen, Brenda & Pruyn, Ad. (2019). Comfortable seating: The influence of seating comfort and acoustic comfort on customers’ experience of hospitality in a self-service restaurant. Applied Ergonomics. 81. 102902. 10.1016/j.apergo.2019.102902.
- Miteva, Natasha & Dusica, Saneva. (2022). Relationship between restaurant management and customer satisfaction.
- Ariffin, Hashim & Bibon, Mohamad Fahmi & Raja Abdullah, Raja Puteri Saadiah. (2016). Restaurant’s Atmospheric Elements: What the customer wants. Journal of ASIAN Behavioural Studies. 2. 10.21834/jabs.v2i2.182.
- Ha Oh-Ryeong , Lim Seung-Lark (2023) .The role of emotion in eating behavior and decisions. Frontiers in Psychology, 14, ISSN=1664-1078. URL=https://www.frontiersin.org/journals/psychology/articles/10.3389/fpsyg.2023.1265074
- Werle, Carol & Cuny, Caroline. (2012). The boomerang effect of mandatory sanitary messages to prevent obesity. Marketing Letters. 23. 10.1007/s11002-012-9195-0.
- Stapleton, P., & Whitehead, M. (2014). Dysfunctional eating in an Australian community sample: the role of emotion regulation, impulsivity, and reward and punishment sensitivity. Australian Psychologist, 49(6), 358-368.
- Dakanalis, A., Mentzelou, M., Papadopoulou, S. K., Papandreou, D., Spanoudaki, M., Vasios, G. K., Pavlidou, E., Mantzorou, M., & Giaginis, C. (2023). The Association of Emotional Eating with Overweight/Obesity, Depression, Anxiety/Stress, and Dietary Patterns: A Review of the Current Clinical Evidence. Nutrients, 15(5), 1173. https://doi.org/10.3390/nu15051173
- Herle, M., Fildes, A., Rijsdijk, F., Steinsbekk, S. & Llewellyn, C. (2018). The home environment shapes emotional eating. Child Dev. doi:10.1111/cdev.12799)
- Evers, C., Dingemans, A., Junghans, A. F., and Boeve, A. (2018). Feeling bad or feeling good, does emotion affect your consumption of food? A meta-analysis of the experimental evidence. Neurosci. Biobehav. Rev. 92, 195–208. doi: 10.1016/j.neubiorev.2018.05.028
- Zhou, Y., and Tse, C.-S. (2021). Sweet taste brings happiness, but happiness does not taste sweet: the unidirectionality of tasteemotion metaphoric association. J. Cogn. Psychol. 34, 339–361. doi: 10.1080/20445911.2021.202079
- Buja, A., Manfredi, M., Zampieri, C., Minnicelli, A., Bolda, R., Brocadello, F., … & Baldo, V. (2022). Is emotional eating associated with behavioral traits and Mediterranean diet in children? A crosssectional study. BMC Public Health, 22(1), 1794.
- Harmancıoğlu, B. & Kabaran, S. (2023). Food Fussiness in Children: Relationship With Dietary Diversity, Eating Behaviors, and Parental Feeding Practices Among 3-to 5-Year-Olds. Topics in Clinical Nutrition. 38. 2-16. 10.1097/TIN.0000000000000301.
- Wolstenholme, H., Kelly, C., Hennessy, M., & Heary, C. (2020). Childhood fussy/picky eating behaviours: a systematic review and 50 STUDENT RESEARCH (BES-HML) SANTO TOMAS COLLEGE OF AGRICULTURE, SCIENCES AND TECHNOLOGY synthesis of qualitative studies. The International Journal of Behavioral Nutrition and Physical Activity, 17(1), 2. https://doi.org/10.1186/s12966-019-0899-x
- Brown, C. L., Vander Schaaf, E. B., Cohen, G. M., Irby, M. B., & Skelton, J. A. (2016). Association of picky eating and food neophobia with weight: a systematic review. Childhood_Obesity, 12(4), 247-262.
- [45] Derks, I. P. K., et al. (2024) Early childhood appetitive traits and eating disorder symptoms in adolescence: a 10-year longitudinal follow-up study in the Netherlands and the UK. The Lancet Child & Adolescent Health. doi.org/10.1016/S2352-4642(23)00342-5.
- Quah PL, Chan YH, Aris IM, Pang WW, Toh JY, Tint MT, et al. (2015) Prospective associations of appetitive traits at 3 and 12 months of age with body mass index and weight gain in the first 2 years of life. BMC Pediatr. 15:153. doi: 10.1186/s12887-015-0467-8
- Scaglioni, S., De Cosmi, V., Ciappolino, V., Parazzini, F., Brambilla, P., & Agostoni, C. (2018). Factors Influencing Children’s Eating 49 STUDENT RESEARCH (BES-HML) SANTO TOMAS COLLEGE OF AGRICULTURE, SCIENCES AND TECHNOLOGY Behaviours. Nutrients, 10(6), 706. https://doi.org/10.3390/nu10060706
- Troncoso, M., Wilson, C., Scott. J., & Deuster, P. (2023). Exploring Influences of Eating Behaviors Among Emerging Adults in the Military, Journal of Nutrition Education and Behavior, Volume 55, Issue 5, Pages 331-342, ISSN 1499-4046, https://doi.org/10.1016/j.jneb.2023.02.004.
- Grimm, E. R., & Steinle, N. I. (2011). Genetics of eating behavior: established and emerging concepts. Nutrition reviews, 69(1), 52–60. https://doi.org/10.1111/j.1753-4887.2010.00361.x
- Heidari, M., Khodadadi Jokar, Y., Madani, S., Shahi, S., Shahi, M. S., & Goli, M. (2023). Influence of Food Type on Human Psychological-Behavioral Responses and Crime Reduction. Nutrients, 15(17), 3715. https://doi.org/10.3390/nu15173715
- Niewczas-Dobrowolska, M. (2022), “Consumers attitude toward lack of food safety”, British Food Journal, Vol. 124 No. 13, pp. 432-444. https://doi.org/10.1108/BFJ-03-2022-0277
- Brinol, P., Petty, R.E. and Guyer, J. (2019), “A historical view on attitudes and persuasion”, in Hegarty, P., Logan, C., Long, W., Pettikainen, P. and Ricken, W. (Eds), Oxford Encyclopedia of the History of Psychology, Oxford University Press, New York, NY.
- Heidari, M., Khodadadi Jokar, Y., Madani, S., Shahi, S., Shahi, M. S., & Goli, M. (2023). Influence of Food Type on Human Psychological-Behavioral Responses and Crime Reduction. Nutrients, 15(17), 3715. https://doi.org/10.3390/nu1517