
Effect of Road Transport Operations on the Environmental Quality of Air and Associated Health Implications in Ondo State, Nigeria.
- Odesanya, J. F
- Stephens M. S
- Okoko E. E
- 328-344
- May 30, 2023
- Environment +1 more
Effect of Road Transport Operations on the Environmental Quality of Air and Associated Health Implications in Ondo State, Nigeria.
Odesanya, J. F.1*, Stephens M. S.2, Okoko E. E.3
1,2Department of Logistics and Transport Technology, The Federal University of Technology,
Akure, Ondo State, Nigeria.
3Department of Urban and Regional Planning, Federal University Uyo, Uyo, Akwa-Ibom State, Nigeria.
DOI: https://doi.org/10.47772/IJRISS.2023.70528
Received: 25 April 2023; Accepted: 02 May 2023; Published: 30 May 2023
ABSTRACT
Transport movement along road corridors and freight movement generates on-street business for some individuals. Operations of fossil powered automobiles contribute to poor quality of air in the environment, using survey research and experimental design methods. Traffic survey of vehicles were carried out to determine the volume and composition of vehicles on selected roads in Ondo State. Altair 5X analyser was used to collect and analyse air pollutants of CO, SO2 and NO2, while, questionnaires were administered to randomly selected respondents for data collection on effect of air-borne transport pollutants on human health. The study revealed that about 4562 to 729 pcu/hr traverse through different road corridors in Ondo state, while about 13.690 to 2.190 ppm of CO, 0.020 to 0.006 ppm of SO2 and about 0.068 to 0.011 ppm of NO2 were produced. The study showed that the level of CO, SO2 and NO2 produced at some corridors exceeds the average minimum acceptable standard. Findings from respondents who subsist and do business along the selected corridors showed that 11.70% of them have high levels of cough which suggest a serious sign of danger as 4% is the allowable level for cough in a community, 9.10% have high throat irritation, 10.79% have nasal discharge and 4.45% have Asthma. The study recommended that vehicles plying on urban road in Ondo state should undergo regular check to meet up with recommended emission standard and that proactive measures taken to reduce over dependence on fossil fuel powered automobile.
Keywords: Road Transport, Environmental Quality, Air Pollution and Health implications
INTRODUCTION
Environmental quality describes the state of a surrounding area, subject to the predominant activities within the spatial spectrum. Global trends have shown that fossil powered road automobile contribute to poor quality of the environment by way of polluting the air around the environment, hence, affecting the people subsisting along these corridors.
Several researches around the world identifies road transport sector as a major contributor to environmental quality degradation resulting in a disunity between man and his immediate environment (Pona, Xiaoli, Ayantobo, & Tetteh, 2022; Kotowskaa & Kubowicza, 2019; Tonne, et al., 2015; Garba, Akan, & Ahmed, 2014; David & Sunday , 2012; Okoko, 2006).
Globally, the transport sector demand for fossil fuel-sourced energy increased from 25% of total energy in 2011 to 35% in 2013, International Energy Agency (IEA) (IEA, 2016). However, this increase in demand only occurs in countries that are not members of the Organization for Economic Cooperation and Development (OECD). The general demand for fossil fuel used in powering automobile is gradually declining in Europe and in more developed countries of the world (Simona, Rossell, Sanchez-Roemmele, & Vallbe, 2021) (ExxonMobil, 2018), a welcomed development that needs to be further worked on. The transport sector alone, accounts for 62% of the world’s global oil consumption (IEA, 2016) with energy consumption rate dominated by road vehicles, passenger cars and freight movement, this representing about 91%. While Air transport accounts for 5%; water transport and rail transport account together for 4% (IEA, 2016).
The Federal Highway and Administration (FHWA, 2019) defined Transportation System Management and Operation “as a set of strategies that focuses on operational improvements which can maintain and even restore the performance of the existing transportation system before extra capacity is needed so as to achieve improved quality of life, smoother and more reliable traffic flow, improved safety, reduced congestion, less wasted fuel, cleaner air, habitable quality environment, increased economic vitality and more efficient use of resources” (FHWA, 2019). Road transport operation is the daily operational system associated with vehicular and freight movement, maintenance and operations while environmental pollution is the negative externality associated with road transport operations. The most lethal effects of urban transportation on environmental quality are noise, air pollution and traffic queues (Okoko, 2018).
In the transportation sector, road transportation sector is ranked among the highest pollutants of environmental quality with the internal combustion of fossil fuel, making it the largest source of many key pollutants and greenhouse gases in the United Kingdom (Brown, Wakeling, Yvonne, & Murrells, 2018). The British Broadcasting Cooperation (BBC) recently described low level exposure to excessive automobile fumes due to internal combustion engine near road side as responsible for enlargement of heart. It is noteworthy that participants for the study were only exposed to pollution levels below United Kingdom guidelines (BBC, 2018). (Khan, Ketzel, Kakosimos, Sørensen, & Jensen , 2018) found that most studies on air pollution associated with road transport are conducted in cities of Europe such as London in the United Kingdom, Copehagen and Aarhus in Danmark, Madrid in Spain, Antwerp in Belgium, Oslo in Norway, Stockolm in Sweden and Leipzig in Germany but few are conducted in West Africa, especially in Ondo State.
In African economics, road transport contributes significantly to economic activities for commuters due to the movement of goods and services, and has become the single largest source of air pollution in urban areas (Odesanya, J. F., Okoko, & Stephens, 2019) (Agyemang-Bonsu, et al., 2010). Traffic congestion has caused vehicular emissions to increase appreciably especially in major African cities like Kumasi and Accra (Nesaman, Chu, McNally, & Jayakrishnan, 2007), Cape Town, South Africa (Westhuisena, Taylora , Bella, & Mbarawa, 2004), Nairobi, Kenya (US Environmental Protection Agency, 2002). Africa is rapidly urbanising, consequently, there is the growing relevance of daily air pollution during urban commuting. Yet, little is known about commuter exposures and environmental quality effect in Africa (Khan, Ketzel, Kakosimos, Sørensen, & Jensen , 2018) (Okokon, et al., 2018).
Nigeria’s, fossil fuel demand by road transport sector is high, this sector consumes about 80% of the total petroleum products (ExxonMobil, 2018) making Nigeria road transport sector the highest consumer of fossil fuels and translating to the largest polluter of the air because it is the most used form of commuting (Promise, Chukwu, Isa, Ojosu, & Olayande, 2015) which accounts for about 90% of all travels of freight and passenger movement in kilometres (Adetola, 2015) (Oni, 2010). This however, is not without its negative impact on the quality of the environment as part of the negative externality of transport is environmental pollution and degradation (Okoko, 2018).
Studies on vehicular road transportation operations have identified that road transport contribute significantly to the economic activities of all nations, and thus is one of the most important indicators of countries’ socioeconomic status (Odesanay, 2022) (Agyemang-Bonsu, et al., 2010). Nevertheless, it exerts numerous negative effects on society: Air pollution, congestion and accidents (Buron, Lopez, Aparicio, Miguel, & Garcia, 2004). just as (Douglas, Watkins, Gorman, & Higgins, 2011) describe vehicles as the new tobacco to environmental quality. The main objective of this research is to look at the effect of road transport operations on the environmental quality of air and then determine the associated health implications as it affects on-road users in Ondo State, Nigeria. The work is Sub-divided into: Conceptualisation; in which the concept of environment and concept of transport externalities are looked at, likewise, literature on the vehicular exhaust fumes (air pollution) was examined. The material and method section consist of the study areas, method of data collection and instrument for survey, air-borne pollution survey and respondence survey. Results of findings were discussed and further strengthen correlating vehicular traffic flow with the selected level of pollutant generated.
CONCEPT OF ENVIRONMENT
The word environment is derived from the French word “Environ” which means “surroundings’’. This includes biotic factors like human beings, plants, animals, microbes etc and abiotic factors such as light, air, water, soil etc (Jagodic, 2016) . Environment has several definitions subject to the viewpoint of the professionals attempting to define it (Oyeyemi, Adegoke, Oyeyemi, & Sallis, 2011). Hence, its definitions reflect the school of thought of each individual. Notwithstanding the various definitive nature of human inhabitation activities still depend on the environment. (Agwu, et al., 2011) defined environment as the combination of all external influence and condition affecting the development and ultimate survival of an organism including man’. Similarly, (Ola, 1977) classified environment as the totality of all external conditions and influences to which an organism is subjected to, while (Pona, Xiaoli, Ayantobo, & Tetteh, 2022) sees it as the total surroundings of living and non-living organism/component needed to sustain them. Hence, environment can be defined as the sum total of the surroundings where all living things activities take place whether on land, air or sea. And that includes all the activities of road vehicle operations.
The success or failure of an organism living in an environment depends on the activities carried out by humans; the need to assess air component in an environment resulting from road transport operations in Ondo State is of ultimate importance to humanity. The relationship between man’s activities and the environment should be given much consideration because the environment as it is, functions well based on the bye product of man’s activities either active or passive. Pollution occurs on a massive and unparalleled scale daily around the environment. (Stapp, 1969) opines that recent happenings point two dangers in the directions of the environment: the first, major one is from burning fossil fuels which releases large chemicals into the environment. Significantly, these chemicals are now altering the natural ecosystems on a worldwide dimension; and second, an upward trend in the use and release to the environment of countless biocidal products and harmful substances (Speth, 1988).
Road vehicle operations especially in both developing and developed countries are mostly associated with air pollution. The presence of pollutants from exhaust of vehicles generates waste at spots and corridors along the motorways, poses serious threat to the environment which leads to destruction of the ecosystem (biotic and abiotic environment).
CONCEPT OF TRANSPORT EXTERNALITIES
The concept of transport externalities could be positive or negative in nature. Spatial interaction in the transportation industry as a process in a city has its apparent problems which are demonstrated either as positive or negative externalities (Okoko, 2018). This work considers only the negative externalities of continuous usage of fossil power vehicles on the air around road side environment. A number of researchers have studied the negative externalities associated with fossil powered automobiles. These researches include (Degraeuwe, Pisoni, Christidis, Christidodoulou, & Thunis, 2020) who developed a web-based application to assess the effect of NO2 pollutant in European cities. the web-based solution requires the input of traffic flows data, fleet configuration, topology of the roadway, factors responsible for emission, pollution sources for NO2 different from roadside in the selected road corridor and data from meteorological sources that are sourced from EU based wide datasets and may not seamlessly characterize a precise local circumstance. In a related article by (Patiño-Aroca, Parra, & Borge, 2022) they noted CO, NOX, VOC, SO2, CO2 as some of the externalities from On-road vehicles when carrying out an inventory on its spatial and temporal distribution of these emission in the city of Guayaquil, Ecuador. They observe that these emissions have been of concerns as it affects plant and animal health and work against environmental sustainability serving as a catalyst for climate change. (Hata, Okada, Yanai, Kugata, & Hoshi, 2022) noted that with much effort in place worldwide to reduce and make to zero fuel-based automobiles in the market, the release of automobile pollutants and greenhouse emission from commuters vehicle are still going to be of great apprehension for the next 20 to 30 years, they observed that part of the externalities of passenger vehicles are the exhaust emissions of hydrocarbons (HC), Nitrogen Oxides (NOX), and Carbon monoxide (CO) during cold start at (1040 + min parking) is less compare to a dramatically increase recorded when the vehicle is just 60 to 120 min in parking, this work indicates the effect of parking durations of emissions from automobile on the atmosphere. (Simona, Rossell, Sanchez-Roemmele, & Vallbe, 2021) looked that the various laws that had been propagated in the UK to cater for externalities in the transport sector most especially as it relates to human health issues,
Vehicular exhaust fumes (air pollution)
Air pollution is the introduction or inclusion of substance or particle into the air which are considered harmful, toxic or poisonous to organic matters living in the eco-system. Gases such as oxides of nitrogen (NOx), Sulphur oxides (SOx), Carbon dioxide (CO2) and Hydrogen sulphate (H2S) are the primary sources of air pollution. (Omenikolo , Uduma , Chinekeokwu , & Abara, 2017) assessed air pollution generated by road transport in Owerri, a town located in the south eastern part of Nigeria observing that motor vehicle activities in Owerri municipal and its environs contribute to high level of urban air pollutions emitting substances like HydroCarbons (HC), Oxides of Nitrogen (NOx), Carbon monoxides (CO), Carbon dioxide (CO2). Analysis performed was based on secondary data of the trend of vehicles registered within Owerri spanning for a ten (10) years period. Secondary data and registered vehicles cannot be a true representation of true-life situation on ground. Finally, they suggested as a mitigation measure, vehicle inspection and enforcement of legislations as measures to reduce driving around the city. (Pasquier & Andre, 2017) assessed air pollution from traffic considering criteria related to spatial variability and noted that concentration of air pollutions are variable in space, and several parameters such as relationship between concentrations and distance to road, infrastructure geometries effects on concentrations, meteorological and topography conditions and how it affect concentrations and other external sources. They also checked on background concentrations of exhaust related road air pollutant and its effect on the environment. They went further to classify pollutions in different forms. Tables 1, shows the first degree of the classification of air pollutant, table 2, shows the second classification degree of air pollutant while table 3, Pollutant Limit values from the EU Air Quality Directive (2008/50/EC) and WHO Guidelines. These tables forms the different classes in which road emitted pollutant are classified.
Table 1. First Classification of Pollutions
| 1st classification | Pollutants | |||
| Pollution of inert pollutants | Benzene | Co | BS/BC | PM in mass |
| Pollution of reactive pollutants that form other pollutants | No | UFP | ||
| Pollution of reactive pollutants and are formed by other pollutants | No2 | PM | ||
| Pollution of non-traffic emitted pollutant, formed by other pollutants | O3 | |||
Source: Pasquier & Andre, (2017)
Table 2 Second Classification of Pollutions
| 2nd classification | Pollutant | Gradient | Distance at which Background concentrations are reached | Distance at which 50% of on road concentrations are reached |
| Pollution of “near road” pollutants | Co
No NOx UFP |
Yes
Yes Yes Yes |
<400m
<400m <400m <400m |
~50m
~60m ~100m ~150m |
| Pollution of non “near-road ”urban background pollutants” | NO2
PM10 PM2.5 EC |
Yes
No Yes Yes |
>400
– >400 >400 |
Source: Pasquier & Andre, (2017)
Table 3 Pollutant Limit values from the EU Air Quality Directive (2008/50/EC) and WHO Guidelines
| Meteorology | Effects |
| Wind context: direction and intensity
Precipitations: frequency Temperature/sunlight Boundary layer: height Seasons |
Horizontal dispersion
Leaching of pollutants Physico-chemical reactions Vertical mixing Cover previous elements |
Source: European Commission (2008)
MATERIALS AND METHODS
The Study Area
The study area comprises (Akure-South LGA, Okitipupa town in Okitipupa LGA and Ikare, Akoko North East LGA). Akure land is made up of two (2) Local Government Areas; Akure South and Akure North in Ondo State however, this study will focus on Akure South Local Government Area. Akure-south is located in the South Western part of Nigeria. It is the capital city of Ondo state and Ondo State is bounded in the North by Ekiti and Kogi states, in the East by Edo and Delta state and in the west by Osun and Ogun states. It shares an international boundary with the Atlantic Ocean in the Southern part. The study area lies on latitude 7° 4’ and 70 25’ north of the equator and longitude 5° 5’ 5°30’ east of the Greenwich meridian. The map of Nigeria presenting Ondo State is shown in Figure 1. While, figure 2 present the map of Ondo State showing the three (3) slected LGA’s.

Figure 1: Map of Nigeria Showing Ondo State

Figure 2: The map of Ondo state showing Akure south, Ikare, Akoko North East and Okitipupa LGA’s
The population of Akure south LGA in 1991 according to the population census was 239,124. Then it grew to 353,211 by year 2006 (NPC, 2006) and by projection using 2.5 growth rate, the city’s population is about 476,785 in 2018. Ondo state which has it capital in Akure exerts an influential role in Nigeria. The significance of this role is due partly to its historical and cultural background. Figure 2 is the map of Ondo state showing Akure south, Ikare, Akoko North East and Okitipupa LGA’s. Figure 3 shows Akure South Network of Road with the network of selected road corridors.Figure 4, shows the network of roads in Ikare, Akoko North East LGA with the selected road corridor. While, Figure 5, shows the network of roads in Okitipupa LGA with the selected road corridor.

Figure 3: Akure South Network of Road Showing Network of Selected Network of Road Corridor: Author’s work (2019).

Figure 4: Ikare, Akoko North East LGA Network of Road Showing Selected Road Corridor Author’s work (2019).

Figure 5. Okitipupa Network of Road Showing Selected Network of Road Corridor: Author’s work (2019).
Method of Data Collection and Instruments
Traffic Volume Collections
Similar study in which traffic count was conducted had been carried out by (Odesanya & Odesanya, 2021) (Okunola, Uzairu, Gimba, & Ndukwe, 2012) (Oguntoke & Yussuf, 2008). Similarly, the collected data is transformed for easy analyses into passenger car unit (PCU) (Okoko, Urban Transportation Planning and Modelling, 2006). To collect peak volume flows of automobiles at the selected road corridor, the following instruments were used. Stop watch, solar powered video camera, Global Positioning System locator GPS, Measuring Tape and Play back video device.
Hourly Traffic volume was monitored along each of the selected corridor with the help of solar powered video cameras. Data collected include traffic flow from 7am to 9am, afternoon traffic flow from 12pm to 2pm and evening peak flow from 5pm to 7pm. The locations of the corridor were taken with the aid of GPS. The time was taken with the aid of a stop watch. At the end of each recording the data collected by the video was played back with the play back video device to extract the traffic flow along the corridor and spot.
Air Pollution
Altair5X air analyser was used to collect data of Nitrogen dioxide (NO2), Sulphur dioxide (SO2), Carbon monoxide (CO). Gases in ambient air were colleccted and analysed in this device. The procedure followed is that the standby button when gently turned on, the device is held on for a waiting time of about (10 – 15) seconds allowing the next page to display on screen. Two (2) red alarm indicators make a beep sound, to indicate that the device is on and air is collected for analysis. The inlet pump of the device was then blocked for 10 seconds with the finger in order for the pump to perform preliminary test. The device (MSA Altair 5x) will then be gently pointed to the location/spot where measurements are taken. After a while the READ button on the device is pressed on simultaneously to display data for the gaseous value of each of the gases collected through the inlet pump.
Collection of Data from Respondents
Questionnaire Survey is the instrument used to collect data from workers who subsist near road to do business on daily basis. A questionnaire is a widely used and useful research instrument for gathering data from research respondents. In this instances it is administered by field enumerators to elucidate information relevant to the study.
A preliminary study was done to count the population of people along the corridors of study (petty traders, street hawkers, vulcanizers, roadside shop operators, police officers and traffic wardens etc.). These populations cover both sides of the roads. The width of coverage was 25 metres from the road median. Investigators were deployed to move along this corridor from 9am to 12 am and count people who subsist along the corridor. The preliminary survey shows the research population for this study in Akure South LGA in Table 4. For Ikare in Akoko North East LGA the preliminary survey is shown in Table 5. While those of Okitipupa town is shown in table 6. To make the work scientific, 5% of the population were randomly sampled.
Table 4. Population of People in the Selected Corridor to be sampled for Akure South LGA
| S/No | Corridor of Study | Population | 5% Population sampled |
| 1. | Cathedral to Road Block | 3626 | 182 |
| 2. | Idanre Road (from Arakale/Idanre Road Junction to Oba Afunbiowo Estate, Oke-Aro); | 3567 | 178 |
| 3. | Adekunle Ajasin Road/Parliament Road/Igbatoro Road (NEPA Junction to SCAAB Filling Station at Igbatoro Road) | 2146 | 107 |
| 4. | Arakale Road (from NEPA Roundabout to Isinkan Roundabout) | 2218 | 111 |
| 5. | Oba Adesida Road (from Nigeria Police Force “A” Division, Akure to Mobil Filing Station, Fiwasaye Junction). | 2109 | 105 |
| 6. | Oke-Ijebu Road (from Ijomu junction to Oke-Ijebu-Ijapo Roundabout) | 2875 | 144 |
| Total Population | 16,541 | 827 | |
Source: Author’s Pilot work (2019).
Table 5. Population of People in the Selected Corridor to be sampled in Ikare. Akoko North East LGA
| S/No | Corridor of Study | Population | 5% Population sampled |
| 1. | Oba Palace to Jubilee junction | 2088 | 104 |
| 2 | Oloko junction to Nysc Camp Gate | 870 | 44 |
| 3. | Iso-Onisu junction to Ubea junction | 1067 | 53 |
| Total Population | 4025 | 201 |
Source: Author’s Pilot work (2019).
Table 6. Population of People in the selected corridor to be sampled for Okitipupa LGA
| S/No | Corridor of Study | Population | 5% Population sampled |
| 1. | Roundabout of Okeraye street to First Bank junction | 1640 | 82 |
| 2 | Rocky junction to General Hospital junction | 1773 | 89 |
| 3. | Maryland Junction to Sera rose junction | 1108 | 55 |
| Total Population | 4521 | 226 |
Source: Author’s Pilot work (2019).
RESULTS AND DISCUSSION
The converted average traffic flow in passenger car unit (PCU) (Okoko, Urban Transportation Planning and Modelling, 2006) for motorcycles, car, buses and heavy trucks along each corridors of study as collected during the study for a period of three months starting from March, 2019 to May, 2019 in Akure-south Local Government Area are presented in Table 7. Likewise, average traffic flow along selected corridor between the months of March, 2019 to May, 2019 for Ikara, Akoko North East LGA, are presented in Table 8 and for Okitipupa Local Government Area, they are present in Table 9 respectively.
The results show that traffic flow and the level of pollutant produce are in a positive relationship, table 7, shows that the traffic flow in Akure attracted the most traffic volume flow with the highest number of pollutants. This is so because Akure-south holds the highest traffic flow of 4562pcu/hr in the morning. The cumulative average flow produces about 13.69ppm of CO, which also turns out to be the highest in the morning in Akure, the 0.02ppm of SO2 produced was the highest in Akure for the morning session while 0.068 ppm of NO2 was generated along the corridor making it the highest average of NO2 in the morning at Akure. In the Afternoon, the highest average traffic flow was recorded in Health centre point with an average traffic flow of 3835pcu/hr and a cumulative average of 11.51ppm of CO, 0.015ppm of SO2 and 0.058ppm of NO2 making this particular corridor, the one with the highest level of pollutant in the afternoon. This is so because this point is situated in the middle of the city, with lot of activities ranging from it close proximity to the main market of the town and its role as the route to the Central business district of the city (CBD). In the evening that health centre corridor still generated the highest traffic volume and the highest level of pollutant, the result for the average traffic flow and level of pollutant are in table 7.
The level of traffic and pollutant related release from Ikara, in Akoko North-East LGA is slightly different from what was obtainable in Akure. The traffic flow pattern in Ikare is lower than what obtain in Akure. This can be understood as the town is not as populated as Akure. The highest traffic flow in the morning session was recorded at Oba Palace corridor with an average of 2762 pcu/hr of traffic flow been recorded within the three (3) month in which the data was collected and an average pollutant level for CO, SO2 and NO2 where recorded in that corridor as 8.29ppm, 0.009ppm, 0.041ppm respectively. In the Afternoon, the highest average traffic flow was recorded in the Oba Palace with an average traffic flow of 2233pcu/hr and a cumulative average of 6.70ppm of CO, 0.008ppm of SO2 and 0.033ppm of NO2 making this particular corridor, the one with the highest level of pollutant in the afternoon. This is so because this point is situated in the middle of the city, with lot of activities and being the location of the main market of the town Central of business in the Akoko district. In the evening Oba Palace corridor still generated the highest traffic volume and the highest level of pollutant, the result of the on-street records for traffic flow and pollution are presented in table 8.
Okitipupa, has its highest traffic level in the morning session at old garage junction with an average cumulative traffic flow of 2612pcu/hr in the morning, generating a cumulative fossil fuel pollutant of 7.84ppm of CO, 0.009ppm of SO2 and 0.039ppm of NO2 respectively. In the Afternoon, the highest average traffic flow was recorded in the Oba Palace with an average traffic flow of 2280pcu/hr and a cumulative average of 6.46ppm of CO occurring at First bank Junction being the highest produced in the afternoon, 0.007ppm of SO2 and 0.032ppm of NO2 at both the first bank junction and rocky junction to have the highest level of NO2 pollutant in Okitipupa LGA in the afternoon. In the evening the Old Garage corridor generated the highest traffic volume and the highest level of pollutant. The total result for traffic generated and the level of pollutant generated in Okitipupa is hereby presented in table 9.
Table 7. Average Traffic flow and air Pollutant for Akure South L.G. March 2019 to May 2019
| S/N | Location | Average Traffic (Pcu/Hr) | Average CO (PPM) | Average SO2 (PPM) | Average N02 (PPM) | ||||||||
| Morn | Aft | Even | Morn | Aft | Even | Morn | Aft | Even | Morn | Aft | Even | ||
| 1 | Cathedral pt | 2223 | 1939 | 2117 | 6.67 | 5.82 | 6.88 | 0.008 | 0.008 | 0.008 | 0.033 | 0.029 | 0.035 |
| 2 | Ilesha Garage | 2691 | 1881 | 2269 | 8.07 | 5.64 | 7.38 | 0.01 | 0.008 | 0.009 | 0.04 | 0.028 | 0.037 |
| 3 | Road Block | 2316 | 1949 | 2097 | 6.95 | 5.85 | 6.82 | 0.009 | 0.008 | 0.008 | 0.035 | 0.029 | 0.035 |
| 4 | 1st bank | 2398 | 2314 | 2272 | 7.20 | 6.94 | 7.38 | 0.009 | 0.009 | 0.009 | 0.036 | 0.035 | 0.037 |
| 5 | A-division | 2452 | 2120 | 2051 | 7.36 | 6.36 | 6.67 | 0.009 | 0.008 | 0.008 | 0.037 | 0.032 | 0.034 |
| 6 | Fiwasaye | 3768 | 2309 | 3878 | 11.30 | 7.08 | 9.61 | 0.015 | 0.009 | 0.011 | 0.057 | 0.035 | 0.049 |
| 7 | Ijapo gate | 3079 | 1658 | 2958 | 9.24 | 4.98 | 9.61 | 0.010 | 0.006 | 0.011 | 0.046 | 0.025 | 0.049 |
| 8 | Ijomu Junction | 4562 | 2651 | 3649 | 13.69 | 7.95 | 11.86 | 0.020 | 0.01 | 0.014 | 0.068 | 0.04 | 0.06 |
| 9 | Oke-Ijebu Roundabout | 1808 | 1717 | 1674 | 5.43 | 5.15 | 5.44 | 0.008 | 0.007 | 0.007 | 0.027 | 0.026 | 0.028 |
| 10 | Health Centre | 3903 | 3835 | 4181 | 11.71 | 11.51 | 13.59 | 0.015 | 0.015 | 0.017 | 0.059 | 0.058 | 0.069 |
| 11 | Isinkan Roundabout | 2567 | 2120 | 2834 | 7.70 | 6.36 | 9.21 | 0.009 | 0.008 | 0.01 | 0.039 | 0.032 | 0.047 |
| 12 | Arakale/NEPA 1st Bus stop | 4136 | 3497 | 3798 | 12.41 | 10.49 | 12.34 | 0.017 | 0.013 | 0.015 | 0.062 | 0.052 | 0.063 |
| 13 | NEPA | 2478 | 2584 | 3095 | 7.43 | 7.75 | 10.06 | 0.009 | 0.009 | 0.011 | 0.037 | 0.039 | 0.051 |
| 14 | SCAB Filling Station | 1525 | 1399 | 973 | 4.58 | 4.20 | 3.16 | 0.007 | 0.007 | 0.007 | 0.023 | 0.021 | 0.016 |
| 15 | Shoprite | 2005 | 1537 | 1642 | 6.02 | 4.61 | 5.34 | 0.008 | 0.007 | 0.007 | 0.03 | 0.023 | 0.027 |
| 16 | Cashold | 3889 | 2749 | 3446 | 11.67 | 8.25 | 11.20 | 0.014 | 0.009 | 0.013 | 0.058 | 0.041 | 0.057 |
| 17 | Commercial | 4523 | 2405 | 2842 | 13.57 | 7.22 | 9.24 | 0.019 | 0.009 | 0.01 | 0.068 | 0.036 | 0.047 |
| 18 | Afunbiowo Estate | 1769 | 1473 | 1417 | 5.31 | 4.42 | 4.61 | 0.008 | 0.007 | 0.007 | 0.027 | 0.022 | 0.023 |
Table 8. Average traffic flow and air Pollutant for Ikare, Akoko North East L.G.A from March 2019 to May 2019
| S/N | Location | Average Traffic (Pcu/Hr) | Average CO (PPM) | Average SO2 (PPM) | Average N02 (PPM) | ||||||||
| Morn | Aft | Even | Morn | Aft | Even | Morn | Aft | Even | Morn | Aft | Even | ||
| 1 | Jubilee | 2437 | 2083 | 2431 | 7.31 | 6.25 | 7.90 | 0.008 | 0.007 | 0.009 | 0.037 | 0.031 | 0.04 |
| 2 | Oba Palace | 2762 | 2233 | 2733 | 8.29 | 6.70 | 8.88 | 0.009 | 0.008 | 0.01 | 0.041 | 0.033 | 0.045 |
| 3 | TotalMob | 2526 | 2231 | 2591 | 7.58 | 6.70 | 8.42 | 0.008 | 0.008 | 0.009 | 0.038 | 0.033 | 0.043 |
| 4 | Nysc gate | 1212 | 1151 | 1138 | 3.64 | 3.45 | 3.70 | 0.006 | 0.006 | 0.007 | 0.018 | 0.017 | 0.019 |
| 5 | Oloko Jt | 1586 | 1127 | 1344 | 4.76 | 3.38 | 4.37 | 0.006 | 0.006 | 0.007 | 0.024 | 0.017 | 0.022 |
| 6 | Owa place | 923 | 729 | 882 | 2.77 | 2.19 | 2.87 | 0.006 | 0.006 | 0.007 | 0.014 | 0.011 | 0.015 |
| 7 | Iso-Onisu | 1218 | 883 | 1128 | 3.66 | 2.65 | 3.66 | 0.006 | 0.006 | 0.007 | 0.018 | 0.013 | 0.019 |
| 8 | Nta Alap | 1398 | 1097 | 1356 | 4.19 | 3.29 | 4.41 | 0.006 | 0.006 | 0.007 | 0.021 | 0.016 | 0.022 |
| 9 | Ubea Jt | 945 | 909 | 963 | 2.84 | 2.73 | 3.13 | 0.006 | 0.006 | 0.007 | 0.014 | 0.014 | 0.016 |
Table 9. Average Traffic flow and air Pollutant for Okitipupa, Okitipupa L.G.A from March 2019 to May 2019
| S/N | Location | Average Traffic (Pcu/Hr) | Average CO (PPM) | Average SO2 (PPM) | Average N02 (PPM) | ||||||||
| Morn | Afte | Even | Morn | Aft | Even | Morn | Aft | Even | Morn | Aft | Even | ||
| 1 | First bank Jt | 2264 | 2154 | 2293 | 6.79 | 6.46 | 7.45 | 0.008 | 0.007 | 0.009 | 0.034 | 0.032 | 0.038 |
| 2 | Rt Okeraye str | 2277 | 2091 | 2193 | 6.83 | 6.27 | 7.13 | 0.008 | 0.007 | 0.008 | 0.034 | 0.031 | 0.036 |
| 3 | St. John Jt | 2251 | 2056 | 2213 | 6.75 | 6.17 | 7.19 | 0.008 | 0.007 | 0.008 | 0.034 | 0.031 | 0.037 |
| 4 | General Hosp | 1328 | 1297 | 1331 | 3.98 | 3.89 | 4.33 | 0.006 | 0.006 | 0.007 | 0.02 | 0.019 | 0.022 |
| 5 | Old Garage | 2612 | 2280 | 2599 | 7.84 | 6.23 | 8.45 | 0.009 | 0.007 | 0.009 | 0.039 | 0.031 | 0.043 |
| 6 | Rocky Jt | 2258 | 2128 | 2205 | 6.78 | 6.38 | 7.17 | 0.008 | 0.007 | 0.008 | 0.034 | 0.032 | 0.0364 |
| 7 | Mary Land | 1622 | 1191 | 1510 | 4.87 | 3.57 | 4.91 | 0.006 | 0.006 | 0.007 | 0.024 | 0.018 | 0.025 |
| 8 | Ogbeyi_Bar | 1714 | 1416 | 1721 | 5.14 | 4.25 | 5.59 | 0.007 | 0.006 | 0.007 | 0.026 | 0.021 | 0.028 |
| 9 | Sera Rose Jt | 1110 | 1038 | 1178 | 3.33 | 3.12 | 3.83 | 0.006 | 0.006 | 0.007 | 0.017 | 0.016 | 0.019 |
Health Related Challenges faced by respondence along the corridor
The combined gender analysis for the study of the three selected LGA is accessible in table 10., It shows that there are more male in the respondents than female with men having 53.2% of the total population sampled. This could be because most men are bread winners hence the need to work and support the family in the absences of white-collar jobs. About 47.7% of those sampled are married, while 41.6% are single, showing that most of those carrying out their daily businesses in these corridors of studies are mostly singles although a high percentage are also married. Other social economic variable measured are presented in Table 10.
Table 10. Social economic variable of respondent in Ondo State.
| S/N | Type | frequency | % Population | |
| 1 | Sex | Male | 667 | 53.2 |
| female | 587 | 46.8 | ||
| 2 | Marital status | Single | 522 | 41.6 |
| married | 598 | 47.7 | ||
| divorced | 84 | 6.7 | ||
| widowed | 50 | 4.0 | ||
| 3 | Educational Status | No Formal Education | 198 | 15.8 |
| Primary/Secondary education | 627 | 50.0 | ||
| Post-Secondary (NCE,OND,HND ETC) | 263 | 21.0 | ||
| University Education | 166 | 13.2 | ||
| 4. | Age | 15-29 | 389 | 31.0 |
| 30-44 | 531 | 42.3 | ||
| 44-49 | 272 | 21.7 | ||
| 60 and above | 62 | 4.9 | ||
| 5. | Occupational Status | Self employed | 660 | 52.6 |
| Private/public sector employer | 303 | 24.2 | ||
| Artisan | 244 | 19.5 | ||
| Others | 47 | 3.7 | ||
| 6 | Time spend around corridor of study | 2hour | 201 | 16.0 |
| 6hours | 369 | 29.4 | ||
| 8 hours | 448 | 35.7 | ||
| 0thers | 236 | 18.8 | ||
| 7 | Children/ward assisting | Yes | 454 | 36.2 |
| No | 796 | 63.5 | ||
| 8 | Years’ operating along corridor | Less than 2 years | 311 | 24.8 |
| 2 to 4 year | 469 | 37.4 | ||
| 4 to 6 year | 322 | 25.7 | ||
| Others | 152 | 12.1 | ||
| 9 | Do you smoke | Yes | 212 | 16.9 |
| No | 1042 | 83.1 | ||
| 10 | Source of energy to cook | Firewood | 131 | 10.4 |
| Kerosene stove | 379 | 30.2 | ||
| Electric stove/gas cooker | 694 | 55.3 | ||
| Others | 50 | 4.0 |
Respondent’s perception to Illness due to Air borne pollutants in Ondo State
Air borne diseases are largely indices of lung malfunctioning as a consequence of exposure to pollutants which enters into the respiratory tracts (Westhuisena, Taylora , Bella, & Mbarawa, 2004). Coughing according to (Oguntoke & Yussuf, 2008) could be signs of some health problems emanating from emission of pollutants, however, results from the study population shows that only 11.7% have high coughing problem. Figure 6, shows the frequency/rate of incidents cases of respondents to the effect of air pollutant along the corridor of study. About 50.62% of sampled respondents do not cough often while 37.59% of sampled respondents cough moderately; this is a sign of danger as the prevalence of chronic cough has been estimated at between 3% and 40% of the population (Ford, Forman, Moayayedi , & Morice, 2006). These indicate that pollutant from automobile in the corridor of study seems not to be a real serious problem but should be checked. However, result obtained are different from previous study carried out (Oguntoke & Yussuf, 2008) which observed that 56.4% have high level of cough in the corridor they study in Abeokuta metropolis of Ogun state. Breathlessness is another sign that could cause asthma, 59.92% of the respondents do not have breathlessness problems, 36.69% have moderate levels of breathlessness while 4.06% have high level of breathlessness. Figure 6 displays the distribution of level of breathlessness. The result is also in close association to those obtained by (Oguntoke & Yussuf, 2008) in which they obtain 23.4% for respondents in their study. For Nasal discharge, figure 6, elucidates the Nasal discharge pattern of respondent in the study. About 10.79% of the respondents have high Nasal discharge; this observed value is quite low to assume that the road side in which these respondence work could be the main contributor to it. About 52.03% of the respondents have low nasal discharge this result is higher than 3.6% reported by (Oguntoke & Yussuf, 2008) in their work. For Throat irritation, figure 6, expresses the throat irritation pattern of respondence in the study. About 9.10% of the respondents have high throat irritation and 48.05% have low throat irritation. This suggests that the effect of the discharge emission from automobile in these corridors is quite low to pose any serious health effect as it relates to throat irritations. Asthma is a disease caused by fine particle in the air that could affect effective breathing; figure 6, shows the Asthma distribution pattern of respondence for the study conducted in the selected corridor of study. A close study shows that about 4.45% of the respondents have high asthmatic conditions and 77.37% have low asthmatic condition. This suggests that the effect of the discharge emission from automobile in these corridors is quite low to pose any serious danger.
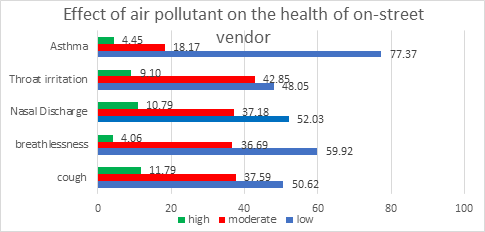
Figure 6. The frequency/rate of health incidents cases of air pollutant along selected corridor in Ondo State.
Inferential statistical test of traffic flow and air-borne pollutant
Table 11, shows the correlation between traffic flow in (pcu/hr) and Carbon monoxide (CO), Sulphur dioxide (SO2) and Nitrogen dioxide (NO2) produce along the traffic corridors for study conducted in the selected corridor, the result shows that a very strong positive correlation of 0.993, 0.967 and 0.990 exist between Traffic flow in pcu/hr and CO, SO2 and NO2 at a significant level of 0.01. This agrees with the work of (Ude, Anjorin, & Egila, 2016) (Okunola, Uzairu, Gimba, & Ndukwe, 2012) (Oguntoke & Yussuf, 2008). This is true because at ground level when the same experiment is carried out in an exclusive environment (control site) away from fossil powered automotive interference, no value was recorded for CO, SO2 and NO2.
Table 11. Correlation between traffic flow in (pcu/hr) and air pollutant in Ondo State
| PCU/HR | CO | SO2 | NO2 | |
| Pearson Correlation
Sig. (2-tailed) N |
1
108 |
.993**
0.000 108 |
.967**
0.000 108 |
.990**
0.000 108 |
**. Correlation is significant at the 0.01 level (2-tailed).
CONCLUSION AND RECOMMENDATIONS
This study has provided insights into the effect of air pollutant of road transport operations on environmental pollution and the health implications in Ondo State. It has also established that a significant variation existed between traffic flow and air pollution in Ondo state. It also reveals that Carbon Monoxide (CO), Sulphur dioxide (SO2), Nitrogen dioxide (NO2) increases significantly with increase of automobile traffic flow along road network and that their level of pollution to the environment is gradually increasing. Due to high traffic flow observed in some corridors, regular measurement and analysis of traffic flow along road corridor should be encouraged by the policy makers and policies that would help transit to green energy in powering automobile should be encouraged.
Conflict of Interest
We declare that there is no conflict of interest in this work
ACKNOWLEDGEMENT
The authors acknowledged these individuals for their contributions to this work.
Abdulsalam Azeez.O, Lawrence Faith Morenikeji, Tolu Odekunle, Taiye Samuel, Toba Babatope-Ojo, Michael Lawal, Oguntimehin Oluwaseun Funmi, Kolade Awoyelu,, Tolu Ajibade, Abdulahi Abdulfatai
FUNDING
This study was funded by Tertiary Education Trust Fund (TETFUND), Institution-Based Research Grant Award (IBR) under the general Research product development and Young Research
REFERENCE
- Adetola, A. E. (2015). PHD Thesis Title: A Conceptual Collaborative Engagement Framework for Road Infrastructure Management in Nigeria. Lancashire: University of Central Lancashire, uk.
- Afe, A. E. (2012). A Historical Survey of Socio-Political Administration in Akure region up to the contemporary period. European Scientific Journal, 196-204.
- Agwu, E. A., Egbule, C. I., Amadu, F. O., Morlai, , T. A., Wollor, E. T., & Cegbe, L. W. (2011). What Policy Options can Promote Agricultural Innovationfor Climate Change and Adoption and Food Security in West Africa Subregion. www.atpsmet.org. African Technology Policy Studies Network TECHNOPOLICY BRIEF No.29.
- Agyemang-Bonsu, K. W., Dontwi, I. K., Tutu-Benefoh, D., Bentil , D. E., Boateng, O. G., Asuobonteng, K., & Agyemang, W. (2010). Traffic-data driven modelling of vehicular emissions using COPERT III in Ghana: A case study of Kumasi. AMERICAN JOURNAL OF SCIENTIFIC AND INDUSTRIAL RESEARCH, 32-40.
- BBC. (2018, July 3). Low Levels of Air Pollution Linked to Changes in the Heart. Retrieved August 2018, 3 from Bristish Brocasting cooperation: https://www.bbc.co.uk/news/health-45034972
- Brown, B., Wakeling, D., Yvonne, O., & Murrells, T. (2018). Methodology for the UK’s road transport emissions inventory. . Harwell, Didcot. UK: Brown, B., Wakeling, D., Yvonne, P., & Murrells, T. (2018). Ricardo Energy & EnvironmentRicardo Energy & Environment.
- Buron, J. M., Lopez, J. M., Aparicio, F., Miguel, A. M., & Garcia, A. (2004). Estimation of road transportation emissions in Spain from 1988 to 1999 using COPERT III program. Atmospheric Environment , 715–724.
- David , O., & Sunday , A. (2012). Assessment of vehicular pollution of road side soils in Ota metropolis, Ogun State, Nigeria. International Journal of Civil Environmental Engineering, 12(4):40–46.
- Degraeuwe, B., Pisoni, E., Christidis, P., Christidodoulou, A., & Thunis, P. (2020). SHERPA-city: A web application to assess the impact of traffic measures on NO2 pollution in cities. Environmental Modelling and Software, 1-8.
- Douglas, M. J., Watkins, S. J., Gorman, D. R., & Higgins, M. (2011). Are cars the new tobacco? Journal of Public Health Vol. 33, No. 2, , 160 –169.
- ExxonMobil. (2018). Outlook for Energy: A View to 2040. Texas : ExxonMobil.
- FHWA. (2019, April 19). us department of transport. Retrieved April 19, 2019 from federal highway and adminstration: https://ops.fhwa.dot.gov/tsmo/index.htm
- Focas, C. (2015). Travel behaviour and CO 2 emissions in urban and exurban London and New York. J. Transport Policy, 82-91.
- Ford, C., Forman, D., Moayayedi , P., & Morice, A. H. (2006). Cough in the Community: a cross sectional survey and the relationship to gastrointestinal. London: Thorax BMJ Journals Vol 61, Issue 11 Source: https://thorax.bmj.com/content.
- Garba, S. T., Akan, J. C., & Ahmed, I. (2014). Spatial Distribution of the Heavy Metals: Ni, Fe, Cr, and Mn in Roadside Soils of Maiduguri Metropolis, Borno State Nigeria. Global Journal of Science Frontier Research: H, 249-259.
- Getachew, D. (2015). Analyzing soil contamination status in garage and auto mechanical workshops of Shashemane City: implication for hazardous waste management. Environmental Systems Research Springer Open Journal, 1-9.
- Hata, H., Okada, M., Yanai, K., Kugata, M., & Hoshi, J. (2022). Exhaust emissions from gasoline vehicles after parking events evaluated by chassis dynamometer experiment and chemical kinetic model of three-way catalytic converter. Science of the Total Environment, 1-9.
- IEA. (2016). International Energy Agency (IEA). Key World Energy Statistics 2016. OECD/IEA, Paris. Retrieved June 22, 2018 from IEA: IEA. (2016). Key World Energy Stwww.iea.org/textbase/nppdf/free/2011/key_world_energy_stats.pdfS.: IEA.
- Jagodic, G. (2016). The Impact of Media On Consumers’ Environmental Behaviour. International Journal of Management and Learning 5(2), 263-281.
- Khan, J., Ketzel, M., Kakosimos, K., Sørensen, M., & Jensen , S. S. (2018). Road traffi c air and noise pollution exposure assessment – A review of tools and techniques. Science of the Total Environment, 661-678.
- Kotowskaa, I., & Kubowicza, D. (2019). The role of ports in reduction of road transport pollution in port cities. Transportation Research Procedia Green Cities 2018, 212-220.
- Livingston, K. (2007). Greener London, the Mayor’s State of Environment report for London, Greater London Authority, City Hall. London: Mayor of London.
- Ndukwe, N. A., & Jenmi, F. O. (2008). Effects of Vehicular Exhaust Fumes Urban Air. Poll Res. 27 (3) Enviromedia, 539-543.
- Nesaman, K. S., Chu, L., McNally, M. G., & Jayakrishnan, R. (2007). Estimation of vehicular emissions by capturing traffic variations. Atmospheric Environment. Atmospheric Environment, 2996–3008.
- NPC. (2006). National Population Commission, Census’ 2006 National Summary. Abuja: Federal Republic of Nigeria’s Government.
- Odesanya, I., & Odesanya, J. F. (2021). Perforamance analysis of traffic congestion using desgnated neural network training algorithms. International Jouranl of Engineering and Technologies, 23-33.
- Odesanya, J. F. (2022). AN ANALYSIS OF VARIOUS TRANSPORT MODE AND THEIR CONTRIBUTIONS TO NIGERIA ECONOMY. Humboldt Kolleg Akure Book of reading (pp. 35-45). Akure: Humboldt Kolleg.
- Odesanya, J. F., Okoko, E. E., & Stephens, M. S. (2019). The Effect of Road Transport Emission and its Related Human Health Damages along Traffic Corridor in Ikara, Akoko North East, Ondo State. Nigerian Journal of Logistics and Transport, 31-44.
- Oguntoke , O., & Yussuf, A. S. (2008). Air pollution arising from vehicular emissions and the associated human health problems in Abeokuta Metropolis. Nigeria. Asset, vol 8 (2), , 119-132.
- Ojo, O. O., & Awokola, O. S. (2012). Investigation of Air Pollution from Automobiles at Intersections on Some Selected Major Roads in Ogbomoso, South Western, Nigeria. Journal ofMechanical and Civil Engineering (IOSRJMCE), 31-35.
- Okoko, E. E. (2006). Urban Transportation Planning and Modelling. Akure: Millennium Publishers.
- Okoko, E. E. (2018). SPATIAL INTERACTION: THE QUINTESSENCE OF URBAN MOBILITY. Federal Univeristy of Technology, Akure. Inaugural Lecture Series 98, pp. 58-59.
- Okokon, E. O., Taimisto, P., Turunen, A. W., Amoda, O. A., Fasasi, A. E., Adeyemi, G. L., . . . Lanki, T. (2018). Particulate air pollution and noise: Assessing commuter exposurein africa’s most populous city. Journal of Transport & Health, 1-11.
- Okunola, O. J., Uzairu, A., Gimba, C. E., & Ndukwe, G. I. (2012). Assessment of Gaseous Pollutants along High Traffic Roads in Kano, Nigeria. International Journal of Environment and Sustainability, 1-15.
- Ola, C. S. (1977). Town annd Country Planning Law in Nigeria. Ibadan: Oxford University Press.
- Omenikolo , A. I., Uduma , C. I., Chinekeokwu , T., & Abara, J. C. (2017). Assessment of air pollution generated by transport in Owerri, South East, Nigeria. Merit Research Journal of Environmental Science and Toxicology (ISSN: 2350-2266) Vol. 5(1), 009-017.
- Ondo State Government. (2012). Ondo state statistical year book (2009-2011). Akure: NSDP/SRF.
- Oni, O. A. (2010). Sustainable transport planning in the UK—adaptation to Nigeria’s transport planning policies. Journal of Applied Sciences Research 6 (5),, 543–558.
- Oyeyemi, A. Y., Adegoke, A. O., Oyeyemi, Y. A., & Sallis, F. J. (2011). Perceived Environmental Correlates Of Physical Activity and Walking in African Young Adults. American Journal of Health Promotion, 10-19.
- Pasquier, A., & Andre, M. (2017). Considering criteria related to spatial variabilities for the assessment of air pollution from traffic. World conference on transport research society (pp. 3354-3369). Shanghai: Elsevier.
- Patiño-Aroca, M., Parra, A., & Borge, R. (2022). On-road vehicle emission inventory and its spatial and temporal distribution in the city of Guayaquil, Ecuador. Science of the Total Environment, 1-11.
- Pona, H. T., Xiaoli, D., Ayantobo, O. O., & Tetteh, N. D. (2022). Environmental health situation in Nigeria: current status and future needs. Science direct Heliyon 7, 1-12.
- Promise, U., Chukwu, A. H., Isa, J. O., Ojosu, & Olayande, J. S. (2015). Energy Consumption in Transport Sector in Nigeria: Current situation and ways forward. Journal of Energy Technologies and Policy, 75-83.
- Simona, J., Rossell, J. M., Sanchez-Roemmele, X., & Vallbe, M. (2021). Evolution in the law of transport noise in England. Transportation Research Part D, 1-10.
- Speth, J. G. (1988). Environmental Pollution. Earth “88, Changing Geographic Perspectives. Washington D.C.:: National Geographic Society.
- Stapp, W. B. (1969). The Concept of Environmental Education. The Journal of Environmental Education,, 30-31.
- Tonne, C., Halonen, J. I., Beevers, S. D., Dajnak, D., Gulliver, J., Kelly, J. F., . . . Anderson, H. R. (2015). Long-term traffic air and noise pollution in relation to mortality and hospital readmission among myocardial infarction survivors. International Journal of Hygiene and Environmental Health, 72-78.
- Ude, I. U., Anjorin, F. O., & Egila, J. N. (2016). Assessment of Carbon (II) Oxide and Sulphur (IV) Oxide Emissions at Some Selected Traffic Areas in Jos Metropolis, North Central Nigeria. International Journal of Advanced and Innovative Research, 6-14.
- US Environmental Protection Agency. (2002). Kenya Vehicle Activity Study: Nairobi.Global Sustainable Systems Research. Washington D.C: University of California at Riverside,.
- Westhuisena, V. D., Taylora , H. B., Bella, A. J., & Mbarawa, M. (2004). Evaluation of evaporative emissions from gasoline powered motor vehicles under South African condition. Atmospheric Environment, 2909–2916.