
Empowerment Status of Rural Women at Dumki Upazila of Patuakhali District in Bangladesh
- Munshi Mohammad Kutub Uddin
- Ayasha Rahman Sneha
- Md. Sofiqul Islam
- Mst. Samshun Nahar
- S.M. Ezajul Islam
- Md. Al Amin Hossain
- S.M. Enamul Islam
- Md. Zahidul Islam
- 710-729
- Mar 28, 2025
- Agriculture
Empowerment Status of Rural Women at Dumki Upazila of Patuakhali District in Bangladesh
Ayasha Rahman Sneha1, Md. Sofiqul Islam2, Munshi Mohammad Kutub Uddin1*, Mst. Samshun Nahar3, S.M. Ezajul Islam4, Md. Al Amin Hossain5, S.M. Enamul Islam6 And Md. Zahidul Islam7
1Ex-Lecturer, Rajuk Uttara Model College, Uttara, Dhaka, Bangladesh
2Lecturer, SPC Kafurpura School and College, Bagerhat, Sadar, Bangladesh
3MBS, Department of accounting Government, Huseyn Shaheed suhrawardy College, Magura, Bangladesh
1& 5Department of Entomology & department of Agricultural Chemistry, Patuakhali Science & Technology University, Dumki, Patuakhali 8602, Bangladesh
4Cotton Development Officer, Meherpur Ginning Center, Cotton Development Board, Bangladesh
6Upazila Agriculture Officer, Department of Agriculture Extension, Assasuni, Satkhira, Bangladesh
7Lecturer, Noapara Model College, Noapara, Jashore, Bangladesh
*Corresponding Author
DOI: https://dx.doi.org/10.47772/IJRISS.2025.90300056
Received: 14 February 2025; Accepted: 22 February 2025; Published: 28 March 2025
ABSTRACT
The study was conducted to determine the status of empowerment of rural women and also to explore relationships among their 13 selected characteristics. The study was conducted at Dumki Upazila of Patuakhali district selected purposively Multi-stage random sampling procedure was follow to conduct the research. Firstly among the 5 unions of Dumki upazila, one union was selected randomly. This union was Srirampur union. Srirampur union consists of 4 villages and women of all four villages constituted the sample population of the study. Thus the number stood at 8280 from the four selected villages as the sample population. Thus the sample size was 110 which was taken randomly. Data were collected by the researcher herself with the help of pretested interview schedule during 10th April to 12th May, 2017. The overall empowerment status scores of the rural women ranged from 39 to 121. It revealed that rural women had a medium level of empowerment as 48.18 percent of them belong to medium category of empowerment. This was followed by 27.27 percent appearing in high category of women empowerment. This was also noticed that 23.55 percent of the respondents fell in low category of empowerment. It was interesting to note that none of the respondents belonged to no empowerment category. Coefficient of correlation showed that out of 13 selected characteristics of the rural women, eight variables viz, education. husband’s education, family education, family farm size, annual income, occupation, personal income, personal savings, had positive significant relationships with empowerment. On the other hand, two variables viz. age and marital age had negative significant relationships with empowerment. Among the six dimensions of the empowerment rural women had highest empowerment in cultural dimension while they lag behind most in political empowerment.
Keywords: Women empowerment, rural women, Income, Education and Family.
INTRODUCTION
Women in Bangladesh have seen significant progress in empowerment in recent years, especially in education, health, and employment. However, there is still a need to address gender inequality in politics and economics. Today we recognize it as a necessary condition to the realization of sustainable development for all.
Women are responsible for half of the world’s food production and in most developing countries, produce from 60 to 80 percent of the food. Despite their essential role in achieving global food security, the contributions of women are often underestimated and overlooked in development strategies they remain the “invisible” partners in development (FAO, 1999). Women constitute half of the total population in Bangladesh (female 49.9%, male 50.1%) whose socio-economic condition is sub-standard (BBS, 2012). Struggle for civilized, custom, men-women equality, social regality, security and for many-sided stress the position of women in the family was very challenges. Notwithstanding the contributions and achievements, sacrifices and sufferings, women have been physically tortured, psychologically humiliated, politically marginalized, socially suppressed and economically discriminated. It is a well-established fact that in a patriarchal society like Bangladesh, women are set down a lower status as men who have the freedom or kingship to control households and society as a whole, while women are often secluded in their homes (Balk, 1997: 4). The World Bank experiment in Bangladesh focused that women have limited role in extended family decision-making, limited access and control over household resources (physical and financial assets), low level of individual assets, heavy domestic workloads, restricted mobility and inadequate knowledge and skills that leading to women’s vulnerability (Sebstad and Cohen 2002 44). However, the process of women’s emancipation is not yet complete because of the prevalence of patriarchal values in the systems which have restrained them from becoming more mobile, autonomous and independent economically, socially and politically (Mercy, 2012) Women play a crucial role in the economic welfare of the family. The position of women in any society is an index of its civilization. No country can achieve its likely without sufficiently investing in and developing the power of women.Women perform different tasks depending on their socio-economic structure, number of members in the family, the nature of professions they are involved in and many other factors (Reddy and Narayan, 1987). The actual target of economic development of a country is to Increase the income and quality of life of its population. Rural development, particularly agricultural development in Bangladesh is no exception to this and it is an important to women empowerment. You sent Kabeer (2001:19) defines empowerment as “the expansion in people’s ability to make strategic life choices in a context where this ability was previously denied to them.” Thus, empowerment is basically about the improvement of individuals’ skills to make a difference in their surroundings, which affects their life. Empowerment also relates to the influence of an individual on the social and cultural norms, informal institutions and formal institutions in society. Empowerment includes control over opportunity (physical, human, intellectual and financial) and over theory (beliefs, values and attitudes) (Baltiwala, 1994). Empowerment of women is essentially the process of betterment of economic, social and political status of women, the traditionally deprived ones, in the society. It is the process of controlling them against all forms of brutality.Women empowerment comprise the building up of a society, a political context, wherein women can breathe without the fear of depression, exhaustion, apprehension, discrimination and the general feeling of persecution which goes with being a woman in a generally male dominated structure. (Dr. Anu Dandona, 2015). Empowerment means individuals developing the power to think and work freely, enterprise choice and fulfill their possible as full and equal members of society. Empowering a sense of self-worth, a faith in one’s ability to secure desired changes and the right to power one’s life. winning is the ability to generate choices practice haggling power. Developing the ability to accumulate and influence the direction of social change, to make a more just social and economic order, nationally and internationally. Thus, empowerment means a emotional sense of personal control or authority and a concern with actual social prestige, political power and legal rights. It is a different construct referring to individuals, institute and community. It is an international, running process centered in the local community, involving cooperatively respect, critical reflection, caring and group participation, through which people lacking an equal share of valued wealth gain greater ways to the control over thesewealth. Women’s empowerment is very essential for the improvement of society.
METHODOLOGY
This Chapter deals with research methodology of this research. Research methodology is inevitable for conducting any research. It deals with the description, explanation, and justification of various methods of conducting research. So, the researcher was very much vigilant in selecting components of methodology. They are presented under the following sections sequentially.
Location, Population and Sampling:
Dumki upazila of Patuakhali district of the southern Bangladesh was the locale of the study.
Multi-stage random sampling procedure was followed to conduct the research. Out of 8 upazila Dumki upazila was selected randomly. Among 5 unions of Dumki upazila, one union namely Srirampur was selected randomly. Srirampur union consists of 4 villages viz. Srirampur, Dumki, Rajakhali and Chorboira and all the women of these four villages constitute the sample population. Thus, the number stood at 8280 from the four selected villages. At this stage, 1.33 percent of the sample population was selected separately as the sample of the study.
Table.1 Distribution of population and sampling of the rural women
| Name of the selected upazila | Name of the selected union | Name of the selected villages | Population | Sample size | Reserve List |
| Dumki | Srirampur | Srirampur | 3434 | 36 | 2 |
| Dumki | 2395 | 39 | 2 | ||
| Rajakhali | 1301 | 20 | 2 | ||
| Chorboira | 1150 | 15 | 2 | ||
| Total | 8280 | 110 | 8 |
Variables under Study
A variable is something which varies. More specifically variables are those attributes of objects, events things and beings which vary and can be measured. In other words, variables are the characteristics or conditions that can be observed, manipulated or controlled by the researcher. A well-organized piece of research usually contains at least two important elements, viz. a dependent variable and an independent variable. Dependent variable may be defined as the phenomenon or characteristics hypothesized to the outcome, effect, consequence or output of some inputs variables. Its occurrence depends on some other variable which had preceded it in time. On the other hand, the phenomenon or characteristics to be the input or antecedent variable is called independent variable. It is presumed to cause the dependent variable and is selected, manipulated or measured prior to measuring the outcome or independent variable
Measurement of independent variables
Thirteen characteristics of the rural women were considered as the independent variables in the study. The procedures followed for measuring the independent variables as the study are presented.
Age, Marital Status and Education:
The age of a respondent was measured by counting the period of time from her birth to the time of interview on the basis of response of the respondent and was expressed in terms of years.
The marital age of a respondent was measured by counting the period of time from her marriage on the basis of response of the respondent and was expressed in terms of years.
Education was measured in terms of one’s year of schooling. For example, if a respondent passed the final examination of class five, her level of educational score was taken as five. If a respondent did not know how to read and write, her educational score was given as zero. Husband’s Education was measured in terms of one’s year of schooling. One score was given for passing each level in an educational institution. For example, if a respondent passed the final examination of class five, her level of educational score was taken as five. If a respondent did not know how to read and write, her educational score was given as zero.
Family status
The family size of a respondent was determined in terms of the numbers of members of her family. The family members included the respondent herself, her husband, sons, daughters and other dependents. A unit score was assigned for each member of the family. If a respondent had four members in her family, her score was given as 4. Family Education was measured by taking sum of educational level of the respondent herself and other family members.Farm size of the respondents referred to the total land area occupied by them through owning, leasing and sharing and on which they operate their farming activities. It was converted to and calculated in standard measuring unit i.e. in acre.
Economical demography
Personal land ownership of the respondents referred to the total area of land possessing by the respondent. It was converted to and calculated in standard measuring unit i.e. in acre. Annual income of a respondent was measured by taking sum of income earned by the respondent herself and other family in a year from farming, service, business and others. Annual income was expressed in thousands taka being considered as the income of a respondent’s family. Occupation of the respondents referred to the involvement of the any income generating activity. Personal income of the respondents referred to any kind of income of the respondent. It was measured by taking sum of income earned by the respondent herself. Personal income was expressed in thousands taka being considered as the income of a respondent. Savings by a respondent was measured in terms of money deposited by her in any saving account from any source. For each thousand Taka, a score (1) was given.
Skilled
Training exposure of a respondent was determined by computing a ‘training exposure score’ on the basis of her total number of days for which he received training on various subject matters related to farming during her farming life.
Dependent variables
Empowerment of rural women was the dependent variable of the study. It was measured in six dimensions as follows: adapted from Malhotra et al. (2002)
- Psychological empowerment
- Cultural empowerment
- Social empowerment
- Economic empowerment
- Political empowerment
- Legal empowerment
Measurement of empowerment parameter
Psychological empowerment
Psychological empowerment of a respondent was measured by computing Psychological empowerment score using statements of seven different activities. The statements which could reflect Psychological empowerment had been selected based on literature review, consultation with the expert and supervisor. A respondent was asked to indicate her opinion on the extent of level of Psychological empowerment against each of the statement along with a 4-point continuum “high”, “medium”, “low”, and “not at all”, while weights assigned to those responses were 3, 2, 1, and 0 respectively. Thus, the Psychological empowerment score of a respondent was obtained by adding all the scores obtained for her opinion against all the statement. Thus, the psychological empowerment score of a respondent could range from 0 to 21, where 0 indicated no psychological empowerment and 21 indicated high psychological empowerment.
Again, Psychological empowerment Index (PEI) for each statement was calculated by using the obtained psychological empowerment score and it was computed by using the following formula:
PEI = (PEh × 3) + (PEm × 2) + (PE1 × 1) + (PEn × 0) Where,
PEI = Psychological Empowerment Index
PEh = Number of respondents expressed high psychological empowerment for a statement
PEm =Number of respondents expressed medium psychological empowerment for statement
PE1 = Number of respondents expressed low psychological empowerment for a statement
PEn = Number of respondents expressed not at all psychological empowerment for a Statement
Cultural empowerment
Cultural empowerment of a respondent was measured by computing Cultural empowerment score using seven different activities. The statements which could reflect Cultural empowerment had been selected based on literature review, consultation with the expert and supervisor. A respondent was asked to indicate her opinion on the extent of level of participation achieved against each of the cultural activities along with a 4-point continuum “high”, “medium”, “low”, and “not at all”, while weights assigned to those responses were 3, 2, 1, and 0 respectively. Thus, the cultural empowerment score of a respondent was obtained by adding all the scores obtained for her opinion against all the seven cultural activities. Thus, the cultural empowerment score of a respondent could range from 0 to 21, where 0 indicated no cultural empowerment and 21 indicated high Cultural empowerment.
Again, Cultural empowerment Index (CEI), for each cultural activity was calculated by using the obtained Cultural empowerment score and it was computed by using the following formula:
CEI = (CEh × 3) + (CEm × 2) + (CE1 × 1) + (CEn × 0) Where,
CEI = Cultural empowerment Index
CEh = Number of women indicating high cultural empowerment for a statement
CEm= Number of women indicating moderate cultural empowerment for a statement
CE1 = Number of women indicating low cultural empowerment for a statement
CEn = Number of women indicating not at all cultural empowerment for a statement
Social empowerment
Social empowerment of a respondent was measured by computing social empowerment score using seven different places. These seven different places in which Social empowerment of the women reflect empowerment had been selected based on literature review, consultation with the expert and supervisor. A respondent was asked to indicate her opinion on the extent of level of visit against each of the 7 places along with a 4-point continuum “high”, “medium”, “low”, and “not at all”, while weights assigned to those responses were 3, 2, 1, and 0 respectively. Thus, the social empowerment score of a respondent was obtained by adding all the scores obtained for her opinion against all the five places. Thus, the social empowerment score of a respondent could range from 0 to 21, where 0 indicated no social mobility and 21 indicated high social empowerment.
Again, Social empowerment Index (SEI) for each event was calculated by using the obtained mobility score and it was computed by using the following formula:
SEI = (SEh × 3) + (SEm × 2) + (SE1 × 1) + (SEn × 0)
Where,
SEI = Social Empowerment Index
SEh = Number of respondents expressed high social empowerment for a statement
SEm= Number of respondents expressed moderate social empowerment for a statement
SE1 = Number of respondents expressed low social empowerment for a statement
SEn = Number of respondents expressed not at all social empowerment for a statement
Economic empowerment
Economic empowerment of a respondent was measured by computing Economic empowerment score using seven different activities. These seven different activities in which Economic empowerment of the women reflect empowerment had been selected based on literature review, consultation with the expert and supervisor. A respondent was asked to indicate her opinion on the extent of level of economic empowerment along with a 4-point continuum “high”, “medium”, “low”, and “not at all”, while weights assigned to those responses were 3, 2, 1, and 0 respectively. Thus, the social empowerment score of a respondent was obtained by adding all the scores obtained for her opinion against all the five places. Thus, the social empowerment score of a respondent could range from 0 to 21, where 0 indicated no social mobility and 21 indicated high Economic empowerment
Again, Economic empowerment Index (EEI) for each event was calculated by using the obtained Economic empowerment score and it was computed by using the following formula:
EEI = (EEh × 3) + (EEm × 2) + (EE1 × 1) + (EEn × 0) Where,
EEI = Economic empowerment Index (EEI)
EEh = Number of respondents expressed high economic empowerment for a statement
EEm= Number of respondents expressed moderate economic empowerment for a statement
EE1 = Number of respondents expressed low economic empowerment for a statement
EEn = Number of respondents expressed not at all economic empowerment for a statement
Political empowerment
Political empowerment of a respondent was measured by computing Political empowerment score using seven different political activities. These seven different political activities in which participation of the women reflect political empowerment had been selected based on literature review, consultation with the expert and supervisor. A respondent was asked to indicate her opinion on the extent of level of political empowerment along with a 4-point continuum “high”, “medium”, “low”, and “not at all”, while weights assigned to those responses were 3, 2, 1, and 0 respectively. Thus, the political empowerment score of a respondent was obtained by adding all the scores obtained for her opinion against all the seven political empowerment activities. Thus, the political empowerment score of a respondent could range from 0 to 21, where 0 indicated no Political empowerment and 21 indicated high political empowerment.
Again, Political empowerment Index (PEI), for each political empowerment activities was calculated by using the obtained political empowerment score and it was computed by using the following formula:
PEI = (PEh × 3) + (PEm × 2) + (PE1 × 1) + (PEn × 0) Where,
PEI = Political empowerment Index (PEI)
PEh = Number of women indicating high Political empowerment for a statement
PEm= Number of women indicating moderate Political empowerment for a statement
PE1 = Number of women indicating low Political empowerment for a statement
PEn = Number of women indicating not at all Political empowerment for a statement
Legal empowerment
Legal empowerment of a respondent was measured by computing Legal empowerment score using seven different legal activities. These seven different legal activities in which participation of the women reflect legal empowerment had been selected based on literature review, consultation with the expert and supervisor. A respondent was asked to indicate her opinion on the extent of level of legal empowerment along with a 4-point continuum “high”, “medium”, “low”, and “not at all”, while weights assigned to those responses were 3, 2, 1, and 0 respectively. Thus, the legal empowerment score of a respondent was obtained by adding all the scores obtained for her opinion against all the seven legal empowerment activities. Thus, the legal empowerment score of a respondent could range from 0 to 21, where 0 indicated no legal empowerment and 21 indicated high legal empowerment.
Again, Legal empowerment Index (LEI), for each political empowerment activities was calculated by using the obtained political empowerment score and it was computed by using the following formula:
LEI = (LEh × 3) + (LEm × 2) + (LE1 × 1) + (LEn × 0) Where,
LEI = Legal empowerment Index (LEI)
LEh = Number of women indicating high Legal empowerment for a statement
LEm= Number of women indicating medium Legal empowerment for a statement
LE1 = Number of women indicating low Legal empowerment for a statement
LEn = Number of women indicating not at all Legal empowerment for a statement
Data Processing and Analyses
Data collected for the study were systematically recorded, edited, arranged, compiled, tabulated, computerized and analyzed in accordance with the objectives of the study. The computer software like Microsoft Excels and SPSS were used to analyze the data. The following statistical treatment were used to describe, represent and in explaining the relationships among variable included in the study. The interpret data analysis by different ways. For exploring relationships between any two variables Pearson’s Product Moment Correlation (r) was used. Linear regression analysis was also employed to determine the contribution of independent variables to the dependent variables.
Data Collection Instrument
The objectives of the study, an interview schedule was prepared. The schedule was pre-tested in non-sample area for its practicability and relevancy. Based on the experience gained, the interview schedule was modified, whenever necessary. The final schedule was used to collect the information from the respondents by personally interviewing the rural women.
Data Collection
The researcher herself collected necessary information from the selected sample through personal interview schedule with the individual respondent with the help of GO and NGO officer in the study area. The researcher made all possible efforts to establish desired rapport with the respondents, so that they feel free to respond to the questions contained in the schedule. The respondents were interviewed at their leisure time so that they could give accurate information in a cool mind. During the interview, the researcher paid utmost care in collecting data by avoiding external interference. Thus, the researcher did not face any difficulty to establish rapport during data collection. Appreciable cooperation was received from almost all the respondents during interview.
Women Empowerment Hypotheses
Hypotheses are always in declarative sentence form and they are related, either generally or specifically variables to variables. In broad sense hypotheses are divided into two categories: (a) Research hypothesis and (b) Null hypothesis
Research hypotheses
To find out relationship between variables, a researcher first formulate research hypothesis which narrates anticipated relationships between variables. Based on review of literature and development of conceptual framework, the following research hypotheses were formulated. Each of 13 selected c haracteristics (age, marital age, education, husband’s education family size, family education, family farm size, personal land ownership, annual family income, occupation, personal income, personal savings, training exposure of the rural women will have significant relationship to their selected empowerment dimensions i.e. psychological empowerment, cultural empowerment, social empowerment, economic empowerment, political empowerment & legal empowerment.
Null hypotheses
A null hypothesis states that there is no relationship between the concerned variables. The following null hypothesis has been formulated to explore the relationship. Hence, in order to conduct tests, these research hypotheses were converted into null form as:
Each of 13 selected characteristics (age, marital age, education, husband’s education family size, family education, family farm size, personal land ownership, annual family income, occupation, personal income, personal savings, training exposure of the rural women will have no significant relationship to their selected empowerment dimensions i.e. psychological empowerment, cultural empowerment, social empowerment, economic empowerment, political empowerment & legal empowerment.
RESULTS AND DISCUSSION
The chapter deals with the results of the study. The findings and discussions have been presented according to the objectives of the study. Necessary explanations, interpretations have also been made showing possible and logical whenever necessary. However, for convenience of the discussions the findings are systematically presented in the following sections.
Selected Characteristics of the rural women
The observed age scores of the rural women ranged from 18 to 62 having a mean 33.23 and a standard deviation of 9.80. On the basis of the age scores of the rural women, they were classified into three categories: “young aged” (18 to 35 years), “middle aged” (36-50 years) and “old aged” (above 50 years).
Table2. Distribution of the rural women according to their age
| Categories | Women | Mean | Standard Deviation | |
| Number | Percent | |||
| Young age (18-35 years) | 78 | 70.91 | 33.23 | 9.80 |
| Middle age(36-50 years) | 21 | 19.09 | ||
| Old age (above 50 years) | 11 | 10 | ||
| Total | 110 | 100 | ||
The finding indicated that a large proportion (70.91 percent) of the rural women were young aged compared to 19.09 and 10 percent being middle and old aged respectively.
Marital age
The observed marital age scores of the rural women ranged from 1.5 to 46 having a mean 13.65 and a standard deviation of 10.51. On the basis of the age scores of the rural women, they were classified into three categories: “Short marital aged” (1.5 to 14 years), “middle marital aged” (15-28 years) and “Long marital aged” (above 28 years). The distribution of the rural women according to their age.
Table 3.Distribution of the rural women according to their marital age
| Categories | Women | Mean | Standard Deviation | |
| Number | Percent | |||
| Short marital age(1.5 to14 years) | 74 | 67.27 |
13.65 |
10.51 |
| Medium marital age (15-28 years) | 24 | 21.82 | ||
| Long marital age(above 28 years) | 12 | 10.91 | ||
| Total | 110 | 100 | ||
The finding indicated that a large proportion (67.27 percent) of the rural women had short marital age compared to 21.82 and 10.91 percent being medium marital age and long marital aged respectively.
Education
The observed education scores of the rural women ranged from 0 to 16 having a mean of 9. 63 and the standard deviation were 3.92. On the basis of their education scores, the rural women were classified into four categories, namely “illiterate” (0), “primary level” (1-5), “secondary level” (6-10) and “above secondary level” (above 10).
Table 4. Distribution of the rural women according to their education
| Categories | Women | Mean | Standard Deviation | |
| Number | Percent | |||
| Illiterate (0) | 4 | 3.64 |
9.63
|
3.92 |
| Primary level(1 to 5) | 15 | 13.64 | ||
| Secondary level (6 to 10) | 46 | 41.82 | ||
| Above secondary level (above 10) | 45 | 40.90 | ||
| Total | 110 | 100 | ||
The finding showed that the majority (82.72 percent) of the rural women had Secondary level to above secondary level of education compared to 13.64 percent having education Primary level.
Family size
The observed family size scores of the rural women ranged from 4 to14 having a mean of 6.81 and the standard deviation were 1.91.The rural women were classified three categories based on their family size scores: “small family size” (less or equal to 4), “medium family size” (5 to 6), “large family size” (more than 7).
Table.5 Distribution of the rural women according to their family size
| Categories | Women | Mean | Standard Deviation | |
| Number | Percent | |||
| Small family (less or equal to 4) | 10 | 9.09 |
6.81 |
1.91 |
| Medium family (5 to 6) | 46 | 41.82 | ||
| large family (more than 7) | 54 | 49.09 | ||
| Total | 110 | 100 | ||
This finding indicates that majority (96.36 percent) of the respondents had either medium to large family size. This may be due to the consciousness of proper adoption of family planning measures.
Family education
The family education scores of the rural women ranged from 4.5 to 15.25 with the mean and standard deviation of 8.96 and 2.37, respectively. Based on the family education scores of the rural women, they were classified into three categories as: “low family education” (4.5–6.88), “medium family education” (7–10.83), and “high family education” (above 11.16).
Table .6 Distribution of the rural women according to their family education
| Categories | Women | Mean | Standard deviation | |
| Number | Percent | |||
| Low family education (4.5 to 6.88) | 20 | 18.18 |
8.96 |
2.37
|
| Medium family education (7 to 10.83) | 67 | 60.91 | ||
| High family education(above11.16) | 23 | 20.91 | ||
| Total | 110 | 100 | ||
This finding indicates that the majority (60.91 percent) of the rural women had medium level of family education in comparison to 18.18 percent had low family education and 20.91 percent high family education. This might be due to the introduction of compulsory free primary education in Bangladesh and also the establishment of different schools by the NGOs like BRAC, Proshika, etc
Family Farm Size
The observed farm size scores of the rural women varied from 1.63 acre to 16.48 acre. The mean of the farm size was 4.84 acre and the standard deviation was 3.66. The rural women were classified into the following five categories based on their farm size scores: “landless” (0.0 to 0.49 acre), “marginal farm size” (0.50 to 1.49 acre), “small farm size” (1.50 to 2.49 acre), and “medium farm size” (2.50 to 7.49 acre) and “large farm size” (above 7.50 acres).The finding showed that 70 percent of the rural women had medium to large farm size compared to 30 percent of them landless, marginal and small farmer. The average farm size of the rural women was 4.84 acre which is a much higher than the national average farm size which is equivalent to 1.976 acre (BBS, 2006). This indicates that the farm size levels of the rural women in the study area were like a higher than a typical agricultural farming community of Bangladesh.
Annual Family Income
The observed annual family income of the rural women ranged from 68-4350 thousand having a mean of 4.92 with a standard deviation of 4.76. Based on their annual family income scores, the rural women were classified into three categories: “low income” (up to 360 thousand Taka), “medium income”, (360-720 thousand Taka) and “high income” (above 720 thousand Taka).
Table7. Distribution of rural women according to annual family income
| Categories | women | Mean | Standard Deviation |
|
| Number | Percent | |||
| Low income (up to 360 thousand Taka). | 51 | 46.4 |
492
|
476 |
| Medium income (360-720 thousand Taka) | 42 | 38.1 | ||
| High income (above 720 thousand Taka) | 17 | 15.5 | ||
| Total | 110 | 100 | ||
The finding revealed that the highest portion (84.5 percent) of the rural women had low to medium annual family income while 15.5 percent of them had high annual family income. That means majority of the rural women of the study area had low annual fami1y income.
Occupation
The observed occupation of the rural women ranged from 0-5 having a mean of 1.36 with a standard deviation of 1.23. Based on their occupation scores, the rural women were classified into six categories: “no occupation”, “very low level occupation”, “low level occupation”, “medium level occupation” “high level occupation” and “very high level occupation”.
Table8.Distribution of rural women according to occupation
| Categories | women | Mean | Standard Deviation |
|
| Number | Percent | |||
| No occupation (0) | 34 | 30.1 | 1.36 | 1.23 |
| Very low level occupation | 31 | 28.2 | ||
| low level occupation | 21 | 19.1 | ||
| Medium level occupation | 21 | 19.1 | ||
| High level occupation | 1 | 0.9 | ||
| Very high level occupation | 2 | 1.8 | ||
| Total | 110 | 100 | ||
The finding revealed that the highest portion (97.3percent) of the rural women had no occupation to medium occupation while 2.7 percent of them had high to very high level occupation. That means majority of the rural women of the study area had no occupation to medium level occupation.
Personal Income
The observed personal income of the rural women ranged from 0 to 22 thousand having a mean of 4.06 with a standard deviation of 5.00. Based on their personal income scores, the rural women were classified into four categories: “no income” (0), “low income” (0.1to 6 thousand Taka), “medium income” (6.1-9.0 thousand Taka) and “high income” (above 9.1 thousand Taka). The mean and standard deviation were 13.75 and 1.29 respectively. Considering this savings scores of the respondents, they were classified into four categories viz. “No savings (Tk. 0)”, “low savings” (3 to13 thousand taka), “medium savings” (15 to 18 thousand taka), and “high savings” (above 28000).
Table 09. Distribution of the rural women according to their savings
| Categories | Women | Mean | Standard deviation | |
| Number | Percent | |||
| No savings ( 0) | 36 | 32.73 | 13.75 | 1.29 |
| Low savings (3 to13 thousand taka) | 23 | 20.91 | ||
| Medium savings (15 to 28 thousand taka ) | 34 | 30.91 | ||
| High savings (above 28 thousand taka) | 17 | 15.45 | ||
| Total | 110 | 100 | ||
The majority (32.73 percent) of the rural women had no savings as compared to 20.91 percent had low savings, and only 30.91 percent had medium savings and (15.45 percent) had high savings. This saving is helpful to increase income. It also builds confidence of the women for making appropriate decisions at the time of need. Therefore, it is expected that more the savings of the women the more is likely to have their empowerment.
Training exposure
The training exposure scores of the rural women ranged from 0 to 120 with the mean and standard deviation being 3.7 and 13.86 respectively. Based on their training exposure scores, the rural women were grouped into three categories as, “no training exposure” (0), “short training exposure” (3– 6), and “long training exposure” (above 6).
Table10. Distribution of the rural women according to their training exposure
| Categories | Women | Mean | Standard deviation | |
| Number | Percent | |||
| No training (0) | 90 | 81.82 | 3.72 | 13.86 |
| Short training exposure (3-6) | 8 | 7.27 | ||
| Long training exposure (above 6) | 12 | 10.91 | ||
| Total | 110 | 100 | ||
The majority (81.82 percent) of the rural women had no training exposure compared to 7.27percent having short and 10.91 percent having long training experience .The subject matters on which the rural women received training were compost preparation, livestock production and poultry production, nursery and vegetable cultivation, sewing, computer operating, teaching, fish culture, handicrafts. Training generally increases knowledge, skills of individuals, which they can apply for different kind of activity which helps to increase the income sources. Training exposure is an important factor, which enhance awareness of the rural women about various empowerment issues.
Table 11. Distribution of the rural women according to their empowerment
| Categories
|
Women | Mean | Standard deviation | |
| Number | Percent | |||
| Low empowerment (39-65) | 27 | 24.55 | 80.50 | 19.44 |
| Medium empowerment (67-93) | 53 | 48.18 | ||
| High empowerment (above 93) | 30 | 27.27 | ||
| Total | 110 | 100 | ||
A critical look at the data in Table 4.11.1 revealed that a medium level of empowerment of rural women was noticed among more than forty percent of its rural women members as 48.18 percent of them belong to medium category of empowerment. This was followed by 24.55 per cent of them appearing in low category of empowerment.
Psychological empowerment
The psychological empowerment scores of rural women ranged from 6 to 20 with a mean 14.61 and standard deviation 3.72. Based on the decision-making scores, the rural women were classified into three categories, “low psychological empowerment”(6 to 11), “medium psychological empowerment”, (12 to 16), “high psychological empowerment” (17 to 21).
Table 12. Distribution of the rural women according to their psychological empowerment
| Categories | Women | Mean | Standard
Deviation |
|
| Number | Percent | |||
| Low psychological empowerment (6to 11) | 24 | 21.82 |
14.61 |
3.72 |
| Medium psychological empowerment (12-16) | 44 | 40 | ||
| High psychological empowerment (17 to 21) | 42 | 38.18 | ||
| Total | 110 | 100 | ||
Computed data indicate that (40 percent) of the rural women had medium psychological empowerment, 38.18 percent of them had high and only 21.82 percent of the rural women had low psychological empowerment.
Social empowerment
The social empowerment scores of rural women ranged from 6 to 21 with a mean 13.47 and standard deviation 13.85. Based on the social empowerment scores, the rural women were classified into three categories, “low social empowerment” (6-11), “medium social empowerment”, (12-16), “high social empowerment” (17-21).
Economic empowerment
The economic empowerment scores of rural women ranged from 5 to 21 with a mean 13.34 and standard deviation 3.71. Based on the economic empowerment scores, the rural women were classified into three categories, “low economic empowerment” (5-10), “medium economic empowerment”, (11-16), “high economic empowerment” (above 17).
Table 13. Distribution of rural women according to their economic empowerment
| Categories | Women | Mean | Standard Deviation | |
| Number | Percent | |||
| Low economic empowerment (5-10) | 27 | 24.55 |
13.34 |
3.71 |
| Medium economic empowerment (11-16) | 66 | 60 | ||
| High economic empowerment (above 17) | 17 | 15.45 | ||
| Total | 110 | 100 | ||
Computed data indicate that (66 percent) of the rural women had medium economic empowerment, 24.55 percent of them had low and only 15.45 percent of the rural women had higher economic empowerment.
Political empowerment
The political empowerment scores of rural women ranged from 4 to 19 with a mean 10.14 and standard deviation 3.52. Based on the political empowerment scores, the rural women were classified into three categories, “low political empowerment”(4-8), “medium political empowerment”, (9-13), “ high political empowerment” (14-19).
Table 14. Distribution of rural women according to their political empowerment
| Categories | women | Mean | Standard Deviation | |
| Number | Percent | |||
| Low political empowerment (4 to 8) | 37 | 33.64 |
10.14 |
3.52 |
| Medium political empowerment (9-13) | 52 | 47.27 | ||
| High political empowerment (14-19) | 21 | 19.09 | ||
| Total | 110 | 100 | ||
Computed data indicate that near about half (47.27 percent) of the rural women had medium political empowerment, 33.64 percent of them had low and only 19.09 percent of the rural women had higher political empowerment.
Legal empowerment
The legal empowerment scores of rural women ranged from 6 to 21 with a mean 13.26 and standard deviation 3.88. Based on the legal empowerment scores, the rural women were classified into three categories, “low legal empowerment”(6-11), “medium legal empowerment”, (12-16), “ high legal empowerment” (above 16).
Table 15. Distribution of rural women according to their legal empowerment
| Categories | women | Mean | Standard
Deviation |
|
| Number | Percent | |||
| Low legal empowerment (6-11) | 42 | 38.18 |
13.26 |
3.88 |
| Medium legal empowerment (12-16) | 46 | 41.82 | ||
| High legal empowerment (above16) | 22 | 20 | ||
| Total | 110 | 100 | ||
Computed data indicate that (41.82 percent) of the rural women had medium legal empowerment, 38.18 percent of them had low and only 20 percent of the rural women had higher political empowerment.
Ranking of empowerment dimensions
The six dimension of empowerment were ranked on the basis of mean value which is in the figure.1
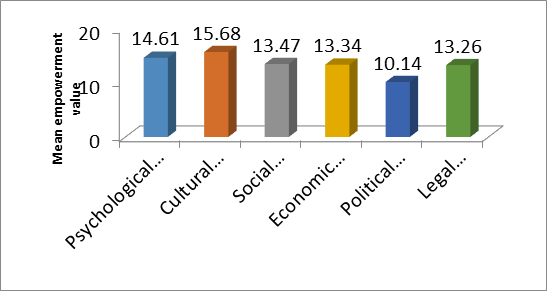
Fig no 1: Empowerments were ranked on the basis of mean value
Relationship between the rural women and their extent of empowerment
The selected characteristics of the rural women constituted independent variables and empowerment constituted the dependent variable of the study. In this section relationship between thirteen selected characteristics (independent variables) of the rural women viz. age, marital age, education, husband’s education, family size, family education, family farm size, personal farm size, annual income, occupation, personal income, personal savings, training exposure, and dependent variable i.e. empowerment of rural women have been described. Person’s Product Moment Co-efficient of Correlation (r) has been used to test the hypothesis concerning the relationship between two variables. Five percent and one percent level of probability were used as the basis for rejection of a hypothesis. The table value of ‘r’ was calculated at (110-2) 108 degrees of freedom. The summary of the results of the co-efficient of correlation indicating the relationships between the selected characteristics of the respondents in Table 16.
Table 16. Relationship between the selected characteristics of the rural women and their empowerment
| Dependent Variable | Independent Variables | r Values | p values |
|
Empowerment of rural women |
Age | -0.416** | 0.000 |
| Marital age | -0.518** | 0.000 | |
| Educational status | 0.619** | 0.000 | |
| Husband’s educational status | 0.633** | 0.000 | |
| Family size | 0.079 | 0.412 | |
| Family education | 0.427** | 0.000 | |
| Family farm size | 0.337** | 0.000 | |
| Personal land ownership | 0.152 | 0.112 | |
| Annual family income | 0.441** | 0.000 | |
| Occupation | 0.672** | 0.000 | |
| Personal income | 0.663** | 0.000 | |
| Personal savings | 0.604** | 0.000 | |
| Training exposure | 0.143 | 0.136 |
Critical r value at 1% level of significance is 0.2446 and at 5% level of significance is 0.1873
**Correlation is significant at the 1% level of significance
* Correlation is significant at the 5% level of significance
Relationship between marital age of the rural women and empowerment
The correlation coefficient between marital age of the rural women and their empowerment status was -0.518 as shown in Table 6.1 Based on the computed ‘r’ value the relationship between marital age and empowerment was significant and negative.Thus, it could be said that marital age of the respondents was an important indicator for the empowerment of rural women. The findings show that with the increase of marital age the empowerment of the respondents tended to decrease. The main reason of this result might be that incase of newly married women get freedom from their husbands and other family members and they get many opportunity from their family members. The correlation coefficient between education of the rural women and their empowerment was 0.619 as shown in Table 6.1. Based on the computed ‘r’ value the relationship between education and empowerment was positively significant. Hence, the concerned null hypothesis could be rejected. Thus, it could be concluded that education of rural women had significant effect on their Empowerment status.
The finding shows that with the increase of education the empowerment of the respondents tended to increase. The main reason of this result might be that education is very important aspect. Educated women also socialize their children properly because education does not mean just get the ability of reading and writing but prepare individuals to adjust in environment properly.The more the educational level, the more they were empowered Therefore, the education influenced significantly the extent of empowerment of rural women.
Relationship between husband’s education of the rural women and empowerment
The correlation coefficient between husband’s education of the rural women and their empowerment was 0.633 as shown in Table 16. Based on the computed ‘r’ value the relationship between husband’s education and empowerment was positively significant. Hence, the concerned null hypothesis could be rejected. Thus, it could be concluded that husband’s education of rural women had significant effect on their Empowerment status. The finding shows that with the increase of husband’s education the empowerment of the respondents tended to increase. The main reason of this result might be that an increase in the educational level of the husband promotes negotiating powers of women both at home and at the work place. Educated husband also wants to educate his wife and other family members. Therefore, the husband’s education influenced significantly the extent of empowerment of rural women. The correlation coefficient between family size of the rural women and their Empowerment status was 0.079 as shown in Table 16. Based on the computed ‘r’ value the relationship between family size and empowerment was non-significant but followed a positive trend. Thus, it was concluded that family size of the rural women did not play significant role on their empowerment status.
Relationship between family education of the rural women and empowerment
The correlation coefficient between family education of the rural women and their empowerment was 0.427 as shown in Table 16. Based on the computed ‘r’ value the relationship between family education and empowerment was positively significant.Thus, it could be concluded that family education of rural women had significant effect on their Empowerment status. Based on the computed ‘r’ value the relationship between farm size and their empowerment was significant and followed a positive trend. Thus, it could be told that farm size of rural women had significant influence on their empowerment status. It means that larger the farm size of the respondents, greater was their empowerment status. The correlation coefficient between annual family income of the rural women and their extent of empowerment was 0.441 as shown in Table 16. Based on the computed ‘r’ value the relationship between annual income and extent of empowerment was significant and positive trend. It could be said that at least for the present study, annual income of the rural women play a significant role on their empowerment status.
CONCLUSIONS
On the basis of the research findings and logical interpretation in the light of relevant facts, the following conclusions were drawn. About a half of the rural women in the study enjoy medium empowerment while one fourth of them still having low empowerment. If gender equality is the ultimate destination of women empowerment then we need a long mile to go. There is ample scope to improve status of rural women. In other words, a three fourth of rural women are waiting to enjoy high empowerment status. Most of the women are young, having short marital age and interestingly having more education of both rural women and their husband (secondary to higher secondary). This is a positive notion of change. Age, education , farm size, family income, personal income, savings and occupation influences in making women empowered.
A good number of rural women had no personal income, savings and at the same time surprising number of women had no training at all. This situation is detrimental to achieve empowerment as the lack two major capital namely financial capital and human resource capital. Though women have a satisfactory status in agency (psychological empowerment) and cultural empowerment rural women still lagging behind in economic, social, political and legal empowerment. On the basis of findings of the study some recommendations were formulated. Recommendations have been divided into two groups as: recommendations for policy implication and recommendation for further studies.
ACKNOWLEDGEMENTS
All praises are due to Almighty Allah who enabled the author to complete this research work peacefully. The author received valuable guidance, constructive suggestions and encouragement from many persons during the progress of research work. The author is grateful and indebted to all of them and mention some of the names for their active help and guidance. The author is grateful to her thesis Supervisor Professor Dr. Md. Golam Rabbani Akanda, Chairman, Department of Agricultural Extension and Rural Development, Patuakhali Science and Technology University, Dumki, Patuakhali for his constructive suggestions and encouragement throughout the whole period of this piece of research. The author also expresses her gratitude to Dr. Md. Mamunur-ur-Rashid, Dr. Md. Ektear Uddin, & Md. Kamrul Hasan, Associate Professors of Department of Agricultural Extension and Rural Development, Patuakhali Science and Technology University, Dumki, Patuakhali for their kind co-operation and appreciation. The author is grateful to all of the rural women who spontaneously participated in the process of data and grateful to members of different GO and NGOs for their cooperation during data collection.
The author expresses her sincere gratitude to all staff and employees of the Department of Agricultural Extension and Rural Development, Patuakhali Science and Technology University, Dumki, Patuakhali.
REFERENCE
- Agarwal, D., (2000), Capacity building for rural women. Social Welfare, 47(4): 7-9.
- Ahmed, N., M.Z. Rahman, M.A. Kashem. 2009. Need Assessment for capacity Building of Women in Practicing Post harvest Activities of vegetables. Bangladesh Journal of Extension Education. Vol.21, No. 1&2, 2009:97-104.
- Anjuma, N., M.A.M. Miah, R. Ali, M.N. Uddin. 2009. Involvement of Women in farming System Activities in Sadar upazila of Mymensingh District. Bangladesh Journal of Extension Education. 21(1&2), 2009:83-87.
- Anuradha (1998), Encyclopedia of Indian Women, Vol. 2, New Delhi: Common wealth Publications.
- Anonymous,(2013).Growth and Economic Opportunities for Women Literature Review to Inform the DFID-IDRC: Hewlett Foundation Research Program on Women’s Economic Empowerment Gender Equality and Growth in Low Income Countries.
- Akter, M.S. (2000). Participation of Women Clientele in Development Activities of RDRS Project. M.S. Thesis, Department of Agricultural Extension Education, Bangladesh Agricultural University, Mymensingh, Bangladesh
- Asaduzzaman, M. (2003). Impact of Microfinance towards Empowerment through Decision Making Ability of Women Beneficiaries under Proshika. M.S. Thesis, Department of Agricultural Extension Education, Bangladesh Agricultural University, Mymensingh, Bangladesh.
- Banu,D.,F. Farashuddin, A. Hossain and Akter (2001). Empowering Women in Rural Bangladesh: Impact of Bangladesh Rural Advancment Committee’s (BRAC’s) Programme. Journal of International Women’s Studies, 2(3): 24
- Baruah P.K,(2002). “Women: Vital Resource”, Social Welfare, 49, (7), pp. 33-36.
- Batliwala, S.(1994). The Meaning of Women’s Empowerment: New Concept from Action. In G. Sen, A. Germain, & L. Chen (Eds.), Population Policies Reconsidered: Health Empowerment and Rights, pp. 127–138. Cambridge: Harvard University Press
- BBS,(2012). Gender statistics of Bangladesh. Bangladesh Bureau of statistics, Republic of Bangladesh, Dhaka,
- Begum, I.A., M.H. Rahman (2000). Decision-Making and Poverty Alleviation Potential of Women Practicing Homestead Agro-forestry Enterprises. Bangladesh Journal of Extension Education, 11 and 12 (1 and 2): 115-122.
- Biswas, S.C. (2003). Accessibility of Rural Women to Family Decision Making Process M.S. Thesis, Department of Agricultural University, Mymensingh, Bangladesh.
- Biseswar (2008). Problems of feminist leadership among educated women in Ethiopia: taking stockin the third millennium. Journal of Developing Societies, 24 (2): pp.125–158.
- Bradshaw S. (2013). Women’s decision-making in rural and urban households in Nicaragua: the Influence of income and ideology. Environment & Urbanization InternationalInstitute forEnvironment and Development IIED 25(1): 81–94.
- Caldwell, J., P. Reddy, and P. Caldwell. (1983). The Causes of Marriage Change in South India.‖ Population Studies, 37(3), 343–361
- Cheryl E Czuba Nanette (1999). Empowerment: Journal of Extension, 37, 5-14
- Choudhary, M. A., (1996), Empowering strategies for rural women in India. Kurukshetra, 44(3) : 18-22.
- Carr, M. (2000), “Women’s economic empowerment: Key to development”, Women’s Empowerment and Economic Justice: Reflecting on Experience in Latin America and the Caribbean, De Pauli L (ed.).UNIFEM: New York .
- Everett, J. and Savara, M., (1994), Empowerment: Organization in the Informal Sector, Himalaya Publishing House, Bombay.
- European Union (2015). Empowering women and girls through education. Retrieved from http://www.europarl.europa.eu/studies
- Ganle JK, Afriyie K, Segbefia AY. 2015. Microcredit: empowerment and disempowerment of ruralWomen in Ghana.World Development66: 335–345.
- Garikipati S. 2008. The impact of lending to women on household vulnerability and women’s Empowerment: evidence from India. World Development: 36(12)
- Giriyappa, S. (1997). Women Empowerment and Decision Making Analysis in Rural
- Paper Presented at International Conference on Gender Equity through Women’s Empowerment, 23-29 December, Lucknow, India.
- Hausmann, Ricardo, Larda Tyson and Saadia Zahidi. (2012) Global Gender Gap Report, World Economic Forum. Geneva, Switzerland: World Economic Forum, 59.
- Hays, P.A. & Zouari, J. (1995). Stress, Coping and Mental Health among Rural Village and Urban Women in Tunisia. International Journal of Psychology, 30(1), 69-90.
- ILO (2008). “Global Employment Trends for Women,” Geneva: ILO.
- ILO (2012), Global Employment Trends, Geneva: ILO.
- Jahan et.al. (2016) Assessing Empowerment of Farm Women: The Case of Barisal Sadar Upazila
- Johnson, H. (1992), “Women’s empowerment and public action: Experiences from Latin America”, Development policy and public action, , pp. 147-174.
- Jyothi, K. S., (1998), Employment pattern and empowerment of rural women – A study in Kolar district. Sc. (Agri.) Thesis, University of Agricultural Sciences, Bangalore.
- Kabeer, N.(2005), “Gender equality and women’s empowerment: a critical analysis of the Third Millennium Development Goal”, Gender and Development, 13(1), pp.
- Kabeer N.(2001) Conflicts over credit: Re-evaluating the empowerment potential of loans to women in rural Bangladesh. World Development. ;29(1):63–84
- Kantor, P. (2003). ―Women‘s Empowerment Through Home-based Work: Evidence from India.‖ Development and Change, 34(3), 425–445.
- Khatun, F., M. H. Rahman, M. G. Faroque. 2009. Flood Coping Ability of Ultra Poor Household Women In a Flood Prone Area of Jamalpur Disrtrict. Bangladesh Journal of Extension education. 21, No. 1&2, 2009:63-71
- Kishor S, Gupta K. (2004) Women’s empowerment in India and its States: Evidence from the NFHS. Economic and Political Weekly.; 39(7):694–712
- Kochurani Joseph, (2005) Women Empowerment A Conceptual Analysis”, Kanjirappally:Vimala Books and Publications, p.90
- Krook, M. & True, J. (2010). Rethinking the life cycles of international norms: The United Nations and the global promotion of gender equality.” European Journal of International Relations. Published online.
- S. Jyothi, , (1998). Employment pattern and empowermentof rural women – A study in Kolar district, M. Sc. (Agri.) Thesis, University of Agricultural Sciences, Bangalore.
- Lundberg, S., & Pollak, R. A. (1993). Separate spheres bargaining and the marriage market. Journal of Political Economy, 101(6), 988–1010.
- Linking Women’s Empowerment and their ResilienceWomen’s Empowerment in Bangladesh: A Case Study of Two NGOs
- Mainuddin, A., Ara Begum, H., Rawal, L. B., Islam, A., & Shariful Islam, S. (2015). Women Empowerment and Its Relation with Health Seeking Behavior in Bangladesh. Journal of Family & Reproductive Health, 9(2), 65–73.
- Malhotra,A. and S. Schuler (2002). Measuring Women‟s Empowerment as a variable in International Development. JSI Research and Training Institute..
- Malhotra A, Schuler S. (2005) Women’s empowerment as a variable in international development. In: Narayan-Parker D, editor. Measuring empowerment : Cross-disciplinary perspectives. Chapter 3. Washington, DC: World Bank;. pp. 71–88.
- Mayoux, L. (2002), Women’s Empowerment Or Feminisation of Debt?: Towards a New Agenda in African Microfinance; Report Based on a One World Action Conference, London, March 2002, One World Action
- Mehra, R. (1997), “Women, empowerment, and economic development”, The Annals of the American Academy of Political and Social Science, , pp. 136-149.
- Mulder, P.L., Kendel, M.B., & Shellenberger. S., (1999) The behavioral health care needs of rural women. American Psychological Association. [Online] http://www.apa.org/rural/ruralwomen.pdf. Accessed Nov. 1, 2011.
- Moser, C.O.N. (1993), Gender planning and development: Theory, practice, and training, Psychology Press.
- Mosedale, S. (2005), “Assessing women’s empowerment: towards a conceptual framework”, Journal of International Development, vol. 17, no. 2, pp. 243-257.
- Mayoux, L. (2000b), Micro-finance and the empowerment of women, Int. Labour Office.
- Malhotra, A., R. Pande, and C. Grown. (2003). “Impacts of Investments in Female Education on Gender Equality.‖ International Center for Research on Women.
- Mulder, P.L., Kendel, M.B., & Shellenberger. S., (1999) The behavioral health care needs of rural women. American Psychological Association. [Online] http://www.apa.org/rural/ruralwomen.pdf. Accessed Nov. 1, 2011.
- Mason, K.O and Smith.H. (2003) women’s Empowerment and Social Context: Results from Five Asian Countries( Washington. DC, Gender and development Group, World Bank)
- Mridula, B., (1998), Targeting women for development, University News, 36(47) : 1-6.
- Nazrul Islam,Ezaz Ahmed,Janet Chew,Brian Netto. (2012) Empowerment factors of rural women through homestead poultry rearing in Bangladesh, World Journal of Management Vol. 4. No. 2.Pp. 36 – 56
- Neelakantan, U., and M. Tertilt. (2008). ―A note on marriage market clearing.‖ Economics Letters, 101(2), 103 – 105.
- Samarakoon S, Parinduri RA. (2015). Does education empower women? Evidence from Indonesia.World Development66: 428–442.
- Simmons, L.A. et al. (2008). Repression and Poverty among Rural Women: A relationship of social causation or social selection? Journal of Rural Health, (24(3), 292-298.
- Sen Gupta N,( 1998) “Empowerment: A socio-psychological approach to selfhelp group formation”, Prajnan, 24(4), , pp.533-535.
- Sraboni, E., Malapit, H. J., Quisumbing, A. R. and Ahmed, A. U. (2014). Women’s Empowerment in Agriculture: What Role for Food Security in Bangladesh?, World Development, Volume 61, 2014, Pages 11-52, ISSN 0305-750X, http://dx.doi.org/10.1016/j.worlddev.2014.03.025
- Srinath, K. and Thangamani, K., (1993), Empowering through extension. Indian Journal of Extension Education, 24(3&4): 33-39.