
Environmental Changes and Food Security in Ado-Ekiti, Nigeria
- Adegboyega, Emmanuel Rotimi
- Owolabi, Jimoh. Temitayo
- 1884-1892
- Apr 16, 2024
- Environment
Environmental Changes and Food Security in Ado-Ekiti, Nigeria
Adegboyega, Emmanuel Rotimi*, and Owolabi, Jimoh. Temitayo
Department of Geography and Planning Science, Ekiti State University, Ado-Ekiti
*Corresponding Author
DOI: https://dx.doi.org/10.47772/IJRISS.2024.803134
Received: 28 February 2024; Revised: 05 March 2024; Accepted: 09 March 2024; Published: 15 April 2024
ABSTRACT
This study aims at evaluating the role of Geo-spatial techniques in vegetation cover analysis and mapping, environmental changes and food security in Nigeria. The challenges of food security in Nigeria especially in urban centres are enormous. The unmitigated rural-urban drift as a result of socio-economic development has made it imperative to address the problem of food security in the study area. Also, the issue of rapid urban development without appropriate attention given to the important issue of food security with persistent deteriorating infrastructure for urban food processing has led to rapid price changes, in food and other agricultural products. This study, therefore, attempts to demonstrate that the recent advancements in remote sensing integration with Geographic Information System technologies provide powerful tools for mapping and detecting changes in land use and land cover using Ado-Ekiti as a case study. The digital image processing techniques of remote sensing (RS) was employed to enable speedy, accurate and objective interpretation of the multispectral data used for the study, in order to understand the extent, rate and the magnitude of land use and land cover dynamics in the study area. The study reveals that the agricultural land and natural vegetation have the highest change. Much of their land areas were converted to built-up areas for the three study epochs (1992,2007,2022). The study concludes that there is a progressive encroachment of built-up areas to other land use in the study area, thereby resulting in significant environmental changes and affecting food security.
Keywords: Food-Accessibility, Food-Security, GIS and Remote Sensing, Urban Development and Urbanisation
INTRODUCTION
The idea that a nation’s growth in population poses a significant effect on citizens’ access to food and other resources is not a new trend for it was postulated by Malthus three century’s ago (Owoo,2020). Ayedogbon etal.,(2012) corroborated this postulation by their remarks to ensure there is food security for Nigerian citizens. According to statistic from United Nation Population Division (2010) which states that by 2050 the population growth will double the amount of the global demand for food in sub-saharan Africa even if fertility rates were to decline from their current levels, populations projection is to double, with attendant implications for food security.
The importance of access to food and food security has been emphasized by the second Sustainability Development Goal (SDGs) which aims at ending hunger and achieve food security by 2030. And in ensuring food security in the country, one of the agency of Nigeria Governments, the National Space Research and Development Agency (NASRDA) carried out a project to develop a fadama (wetland) in collaboration with the satellite application centre of South Africa using remote sensing imagery (Nigerian sat- 1 images) to get 3millions hectares of fadama land available for rice production in Nigeria (Akinyede, 2008) cited in Kufoniyi (2022). The 2020 Budget allocation revealed that $59.26 US Dollar was earmarked to the same agency to care of the space. The food and agriculture organization of the United Nations (1996) describes food security to exist when all people at all times have access to sufficient food to meet their dietary needs for a productive and healthy life.
The organization also identifies population growth as a critical determinant of food security (FAO 2009, 2013). It is therefore not surprising that with the observed large increases in the country’s population Nigeria faces a crisis in terms of access to food for its populace. Nigeria’s population is estimated to be approximately 198 million, making it the most populous country in Africa and the seventh most populous country in the world (Owoo, 2020).
The growth and development of human settlements, especially urban areas of the developing countries have been on the increase as a result of high birth rate and rural-urban migration; thus making the urbanization process of settlements an unprecedented and inevitable phenomenon (Dalil et al., 2013). It was in view of this that McKeegan (2007) cited a United Nations report as stating “that for the first time in history, more people now live in cities than rural areas”. The report further revealed that urban population is expected to surge from the 3 billion people in 2007 to over 9 billion by the year 2050, with Asia and Africa Continents leading the growth.
In the same vein, a study by the Population Reference Bureau (2012) revealed that only 3 percent of the world’s population lived in urban areas as at 1800, but the figure further rose to 14 percent in 1900 and 30 percent in 1950 respectively, and it is expected to grow to 70percent by year 2050. This therefore poses a serious challenge to man and his environment due to the associated problems of population explosion like high youth unemployment and restiveness poverty environmental degradation and increased concern for food security (Dalil et al. 2013; Ekine and Onu, 2018).
The Food and Agriculture organization of the United Nations (FAO) defines food security as a situation that exist when all people, at all times, have physical and economic access to sufficient, safe and nutritious food to meet their dietary needs and food preferences for an active and healthy life (FAO,2008). This definition comprises four key dimensions to household food security: accessibility, availability, safety and stability. Each of the four key aspects of food security can be analyzed in the context of the urban environment (Ekpeyong, 2015).
Urbanization is increasing in both the developed and developing countries. In 1950, for instance, 30 percent of the global population lived in an urban areas, by 2002, the figure had risen to 47 percent of the global population (UN population Division, 2002). Over three quarter of the population of industrialized countries presently live in urban areas while rural to urban migration in developing countries is increasing at a rapid pace. This rapid and often uncontrolled urbanization is unprecedented by historical standards (van Ginkel, 2008).
Yet, urbanization rates in developing regions differ widely; while in Latin America and the Caribbean, urbanization rates stand at 78 percent only 34 percent of the African population lives in urban areas. UN- habitat (2021), predicted that nearly half (46.2 percent) of the population would be urbanized by 2020. And this urbanization process has come to stay and led to the outward expansion of cities and resulted in changes in land use, whereby urban residents buy up prime agricultural land at the periphery for residential or commercial purposes (Dalil et al., 2013).
There are many challenges facing agricultural output that can ensure food security, these are demographic challenges, economic challenges and environmental challenges, note fully that no country can truly be a sovereign nation if it is not capable of ensuring food security for its citizens. Histories have shown that no nation has actually become great without developing its agriculture and its concomitant institutions which has contributed immensely to the Gross Domestic Product (GDP) of Nigeria (Olutoye and Olutoye,2014; Yusuf,2014). As regards food or agricultural production much remains to be done to fulfill the vision of FAO: to create a world free of hunger and malnutrition, which food and agriculture contribute to impact the standard of living of people especially the poor in economical, socially and environmental sustainable manner ( FAO, 2017). This study evaluates the role of geospatial techniques and its effect on environmental changes on arable land which consequently influences food security in Ado-Ekiti, Nigeria.
DATA AND METHODS
The study area:
The study area is Ado-Ekiti, Nigeria. A famous and capital city that serves a dual purpose of being the state capital and the headquarters of Ado Local Government Area of Ekiti State. It is located between latitudes 70 33’ and 70 43’North of the equator and between longitude 50 06’ and 50 22’ East of the Greenwich meridian respectively. It is bounded in the north by Irepodun /Ifelodun Local Government Area, in the East by Gbonyin Local Government Area, in the south by Ise- Orun Local Government Area and in the south by Ekiti-South West Local Government Area respectively (figs. 1 and 2). The area lies within the tropical climate with two distinct seasons of wet and dry. The wet season comes with the tropical maritime (m.T) air-mass originating from the Atlantic ocean between the month of April and October which brings moisture-laden winds from the coast. During the wet season the relative humidity reaches values close to 80% with the total rainfall amounting to 1400 mm with the peak in September and October. The dry season is brought about by Tropical continental (c.T) air-mass blows in from Sahara desert between November and March with a cool-dry effect on the weather conditions. Temperature in the region is however more uniform throughout the year with very little deviation from an annual mean of about 270c and 370c between the month of highest temperature (February) and the month of lowest temperature (June). The vegetation of the study area was initially of rain forest zone but years of human interference as a result of urban development and environmental changes has given it a new form, classified as “secondary forest”. The population of Ado-Ekiti is 308,621(NPC, 2006) and base on 3.2% growth rate projection, the population estimate of the growing city will by now be four hundred and fifty six thousand seven hundred and fifty nine.
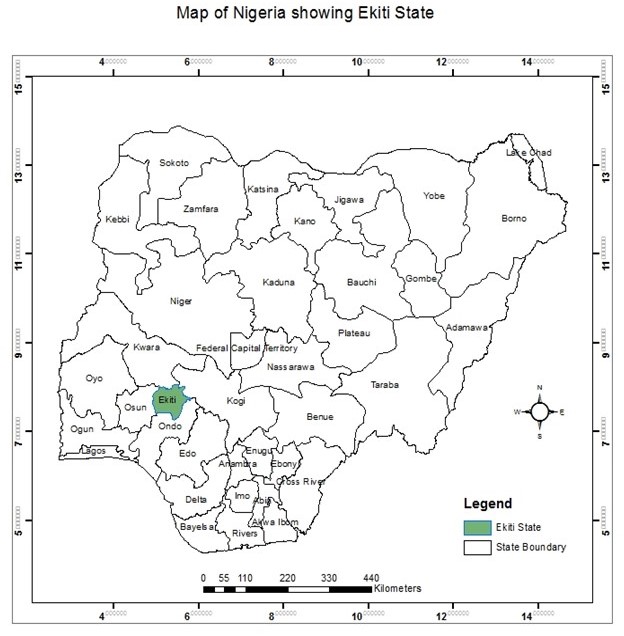
Figure 1: Map of Nigeria showing Ekiti State
Source: Office of the Surveyor-General, Ekiti State, 2019.
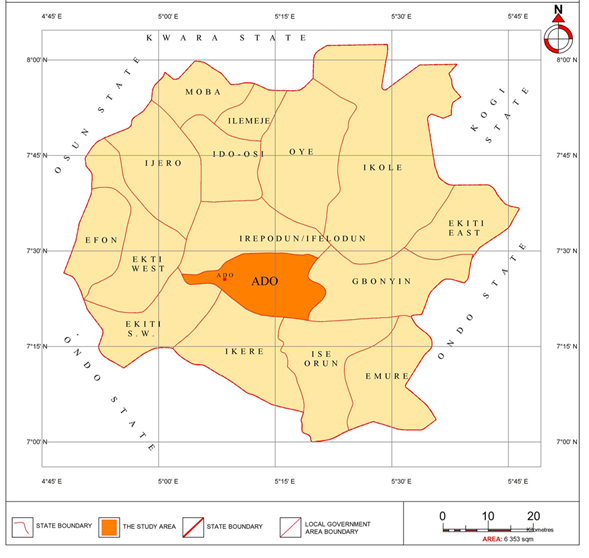
Fig. 2: Map of Ekiti State Showing Ado Ekiti, the study area
Source: Office of Surveyor-General, Ekiti State, 2019
DATA COLLECTION.
Undseth et al, (2020) discovered so many things evolved in the contexts of our conventional space-ecological characteristics and the depths of explorable facilities through mankind use of space born satellite to gather useful data. Data collected and generated by the researchers were sourced through secondary source only, that is, from e-journal, administrative map of Ado Local Government, Landsat imageries and Google earth.
Creation of Geo database (Data acquisition)
Remote sensing and Geographical Information System (GIS) techniques were employed to prepare the base map for Ado-Ekiti, and to obtain reasonable precision in the mapping process, a 10mm resolution imagery of Ado-Ekiti was obtained from global land cover website, USGS website for different years (1992, 2007 and 2022) for the exact Ado-Ekiti using path and roll of p191 and r55. Different band 1, 2, 3 which are of different years, that is, an interval of 15 years and 3 various epochs were picked respectively.
GIS Data Input and Preparation on ArcGIS
Here data captured from the Global Land Cover and USGS were imported to the ArcGIS 10.4 environment. This process involved importing Raster images from the file to the ArcGIS environment through add data tools, after it was imported, data was projected to Universal Traverse Mercator Minna datum zone 31 in Nigeria. The images were viewed and different information about the area was revealed. However, different raster imagery of different bands 1, 2, 3 were imported for raster compositing.
Generation of Geo Database
After the importation of the images from the global land cover through add data tool or through the catalog window. Different shapefile was created to add different information as database point shapefile for structures line shapefile for roads and polygon shapefile for boundaries. Vectorization or digitization; which is moving around the feature for vector generation. However the sub stage two; we combined the different Landsats downloaded which involve Landsat 1,2,3 for built-up area or Landsat 1,4,5 respectively. We used composite band tools in the Arctools box of Arcmap 10.4. Data management tools ….Rasta….Rasta processing….composite bands and on the window we added the rasta imageries and clicked on the processing tools for action. And the end result was a single combined image. At this point we analyzed the rasta image classification and the rasta calculator and symbolized the different features for geographical classification.
DATA PRESENTATION AND ANALYSIS
The methodology adopted has three major stages of map preparation: attribute data generation, GIS data input and analysis. Image classification, Raster calculator and symbology tools were equipped in the analysis and maps of different years were achieved. The results and the discussion are presented under the following sub-theme: the extent of built-up areas in the study area, the trend of built-up and the magnitudes within the period of study. Geographic information system was excellently used alongside with remotely sensed imagery in analyzing the various Landsat imageries downloaded from USGS. These tools have been employed to classify the various land uses and symbology use in the software to graphically make the difference. Hence, the powerful software have the ability to show the various changes in the land use of the study area and be disseminated efficiently and in flexible manner.
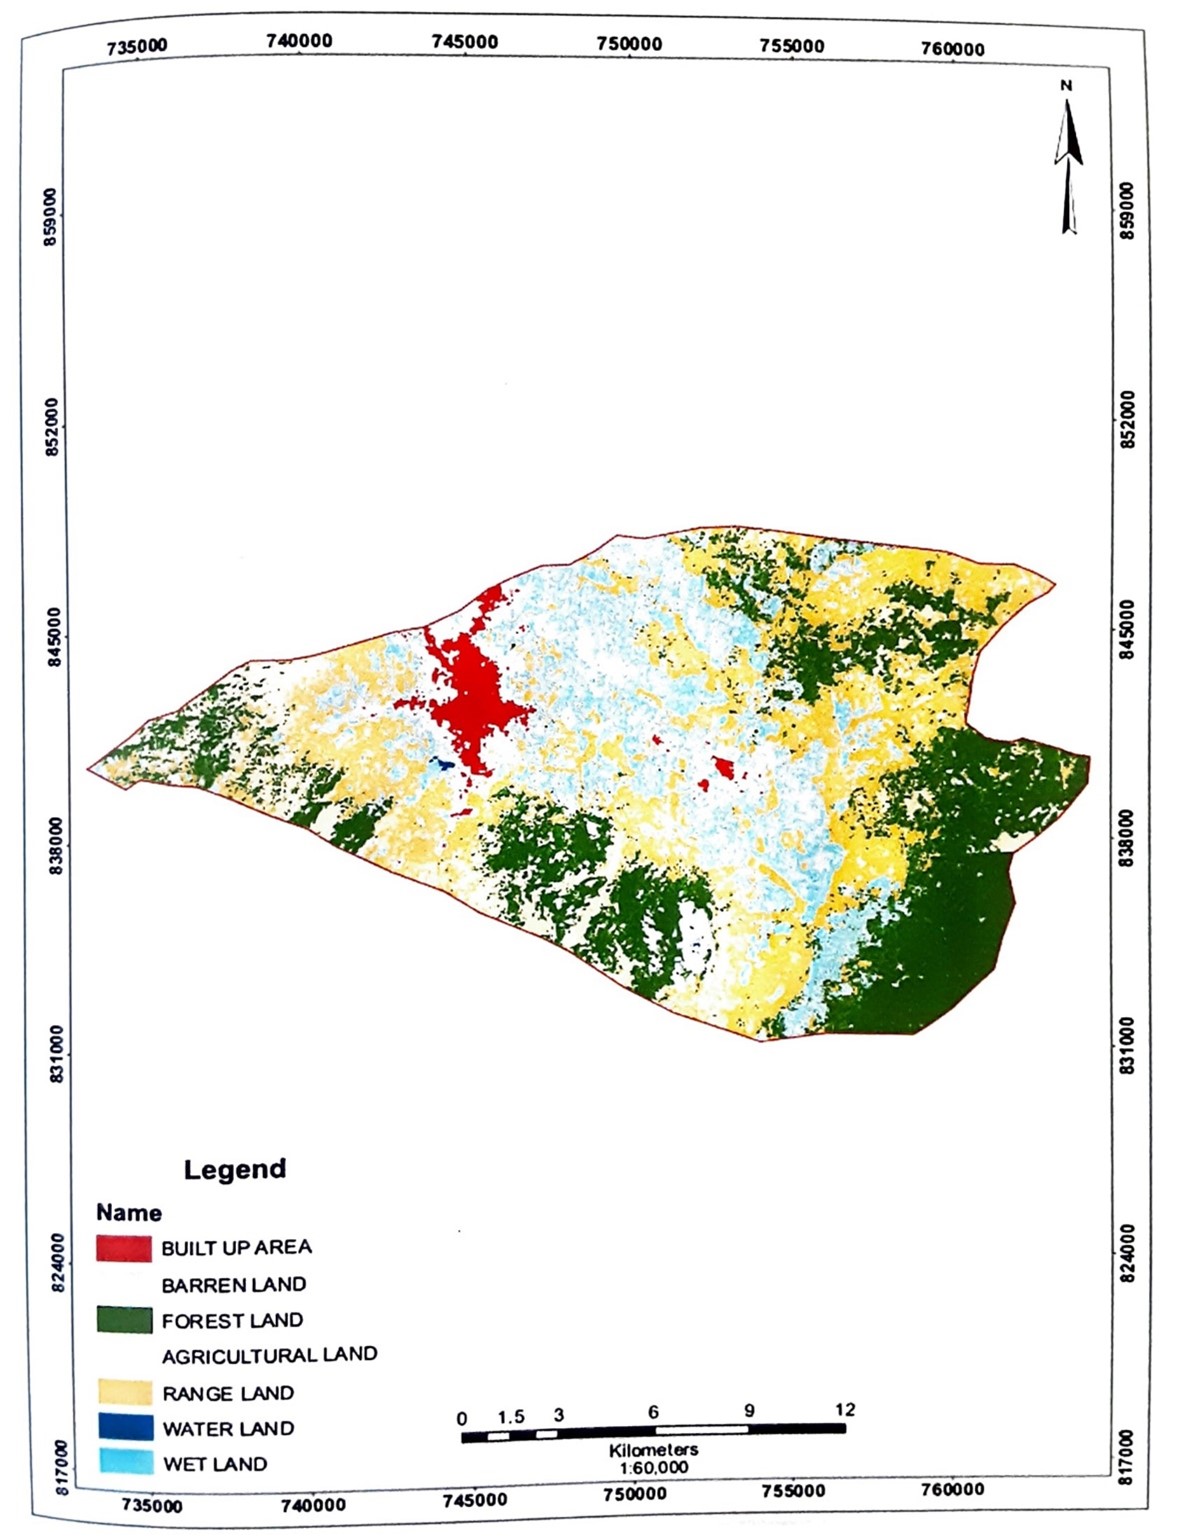
Fig 3. Land Use Land Cover Map of Ado-Ekiti for Year 1992
Source:
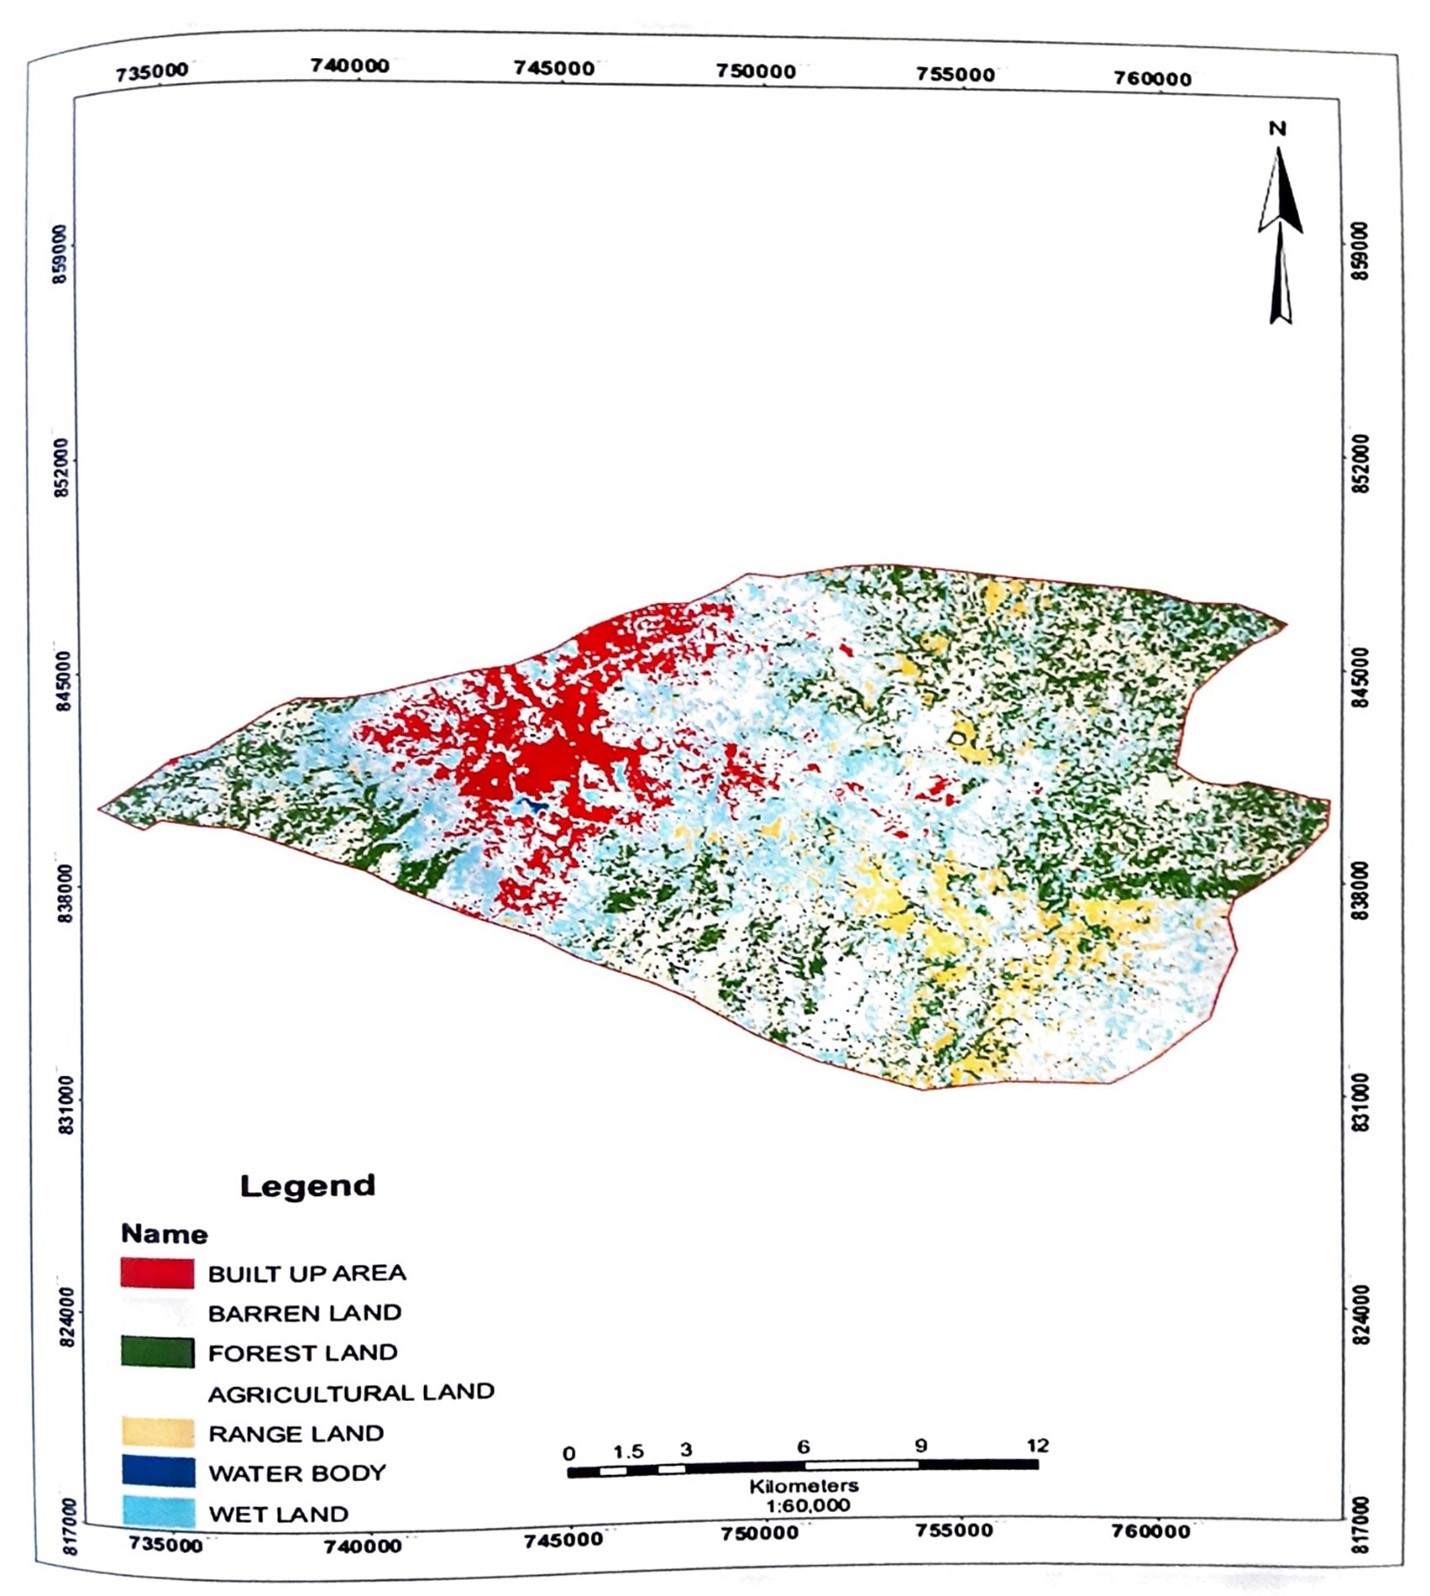
Fig. 4 Land Use Land Cover Map of Ado-Ekiti for Year 2007
Source: Adapted after Ogunlade,2022
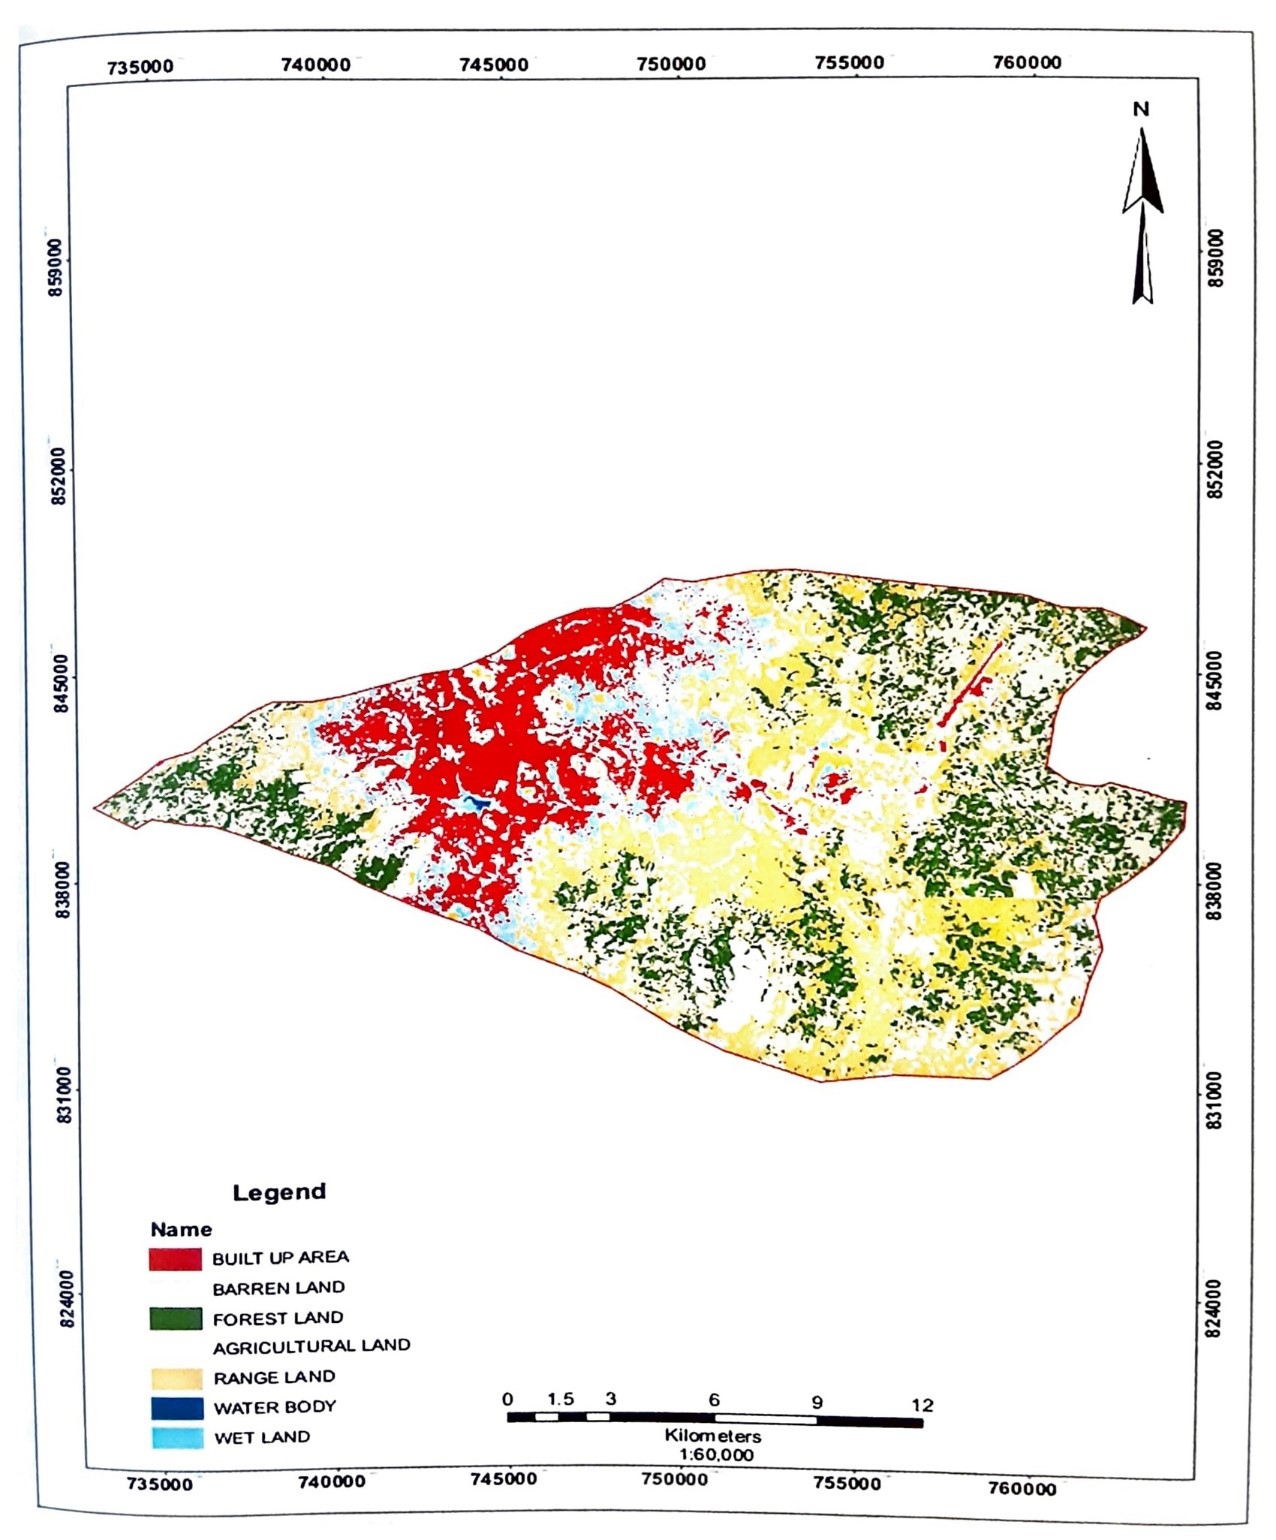
Fig. 5 Land Use Land Cover Map of Ado-Ekiti for Year 2022
Source: Adapted after Ogunlade (2022).
Table 1: Urban Extent in 1992
| Year of Study-1992 | Land area in km 2 | Percentage% |
| Built-up Area | 62.40 | 21.95 |
| Vegetation | 230.30 | 78.00 |
| Waterbodies | 0.08 | 0.05 |
| Total land area | 293.00 |
Source: Field survey,2022
Table 2: Urban Extent in 2007
| Year of Study-2007 | Land area in km 2 | Percentage% |
| Built-up Area | 95.41 | 32.95 |
| Vegetation | 197.48 | 67.00 |
| Waterbodies | 0.11 | 0.05 |
| Total land area | 293.00 |
Source: Field survey,2022
Table 3: Urban Extent in 2022
| Year of Study-2022 | Land area in km 2 | Percentage% |
| Built-up Area | 160.5 | 54.95 |
| Vegetation | 132.20 | 45.00 |
| Waterbodies | 0.15 | 0.05 |
| Total land area | 293.00 |
Source: Field survey,2022
Table 4 Urban Extent change Trend
| Year of Study | Land Area in km 2 1992 | % | Land Area in km 2 2007 | % | Land Area in km 2 2022 | % |
| Built-up | 62.40 | 21.50 | 95.22 | 32.95 | 160.50 | 54.95 |
| Vegetation | 230.40 | 78.00 | 197.48 | 67.00 | 132.2 | 45.00 |
| Water bodies | 0.08 | 0.05 | 0.11 | 0.05 | 0.15 | 0.05 |
| Total Land | 293 | 293,00 | 293.00 |
Source: Field survey,2022.
DISCUSSION
In this research work, three classification were considered which include built-up areas, vegetation, and water bodies. The built-up area in this regard include the rock outcrops as well as anthropogenic built-up. The process involved in analyzing this data include the calculation of the area in km of the resulting land use, land cover type for each year to see the rate of changes and subsequently comparing the result to level changes over time.
The growth dynamics of change in Ado-Ekiti from 1992 to 2022 was digitized from classification of image within the study area. A GIS overlay which shows growth extent of Ado-Ekiti between 1992 and 2007 and 2022 as well as changing in pattern of land use in the above years intervals mentioned were shown in fig. 3,4,5 and summarized in tables 1,2,3 and 4. From table 4 it is clearly indicated that built-up area increased from 64.4 km 2 in 1992 to 95.23 km 2 in 2007 and expand to 160.5 km 2 in 2022 which amount to increase from 21.5%, 33.5%, 55% respectively. This is due to urbanization in the city of Ado-Ekiti. From fig 3 to fig 4, it could be seen. The changes in all the different classes between the different years as presented in table 4, while table 3shows the built-up trend which was 16.7% from 1992 to 2007 and 33.2% from 2007 to 2022 and reason for a large change from 1992 to 2015 (30 years).
It is now understandable from the above that the urban sector of any state or country is never static, but changes with time and space. However, as the year goes by it changes the structural topography of the urban area as well as the developmental growth. From the analysis above there is a significant trend of urban growth in many ways in the city and environs such as clearing such as clearing of natural vegetation and its replacement with other activities. There has been a remarkable decrease in vegetation which was observed due to urban growth. Vegetation clearing is a major threat to biodiversity and may cause species extinction by reducing and losing their habitats.
Population growth is a factor to urbanization which leads to an increase in the demand for goods and services and in turn put more pressure on environmental resources. Ado-Ekiti like other cities in Nigeria witnesses such an increase in population, this has been due to high uncontrolled birth rate and internal and external migration in the country. Lateral changes occur when the city expands in geographic boundaries leading to sprawl and peripheral development while structural growth relate to increase in land use density within the urban centre (Oluseye, 2006). The low density area gradually become subjected to intensive use and thus, become high density or medium density.
The city population is projected to 1.11 million in year 2030given the growth rate of 4% per annum out of which 82 percent are expected to live in urban center. this development will have some consequences on the land use of the city. From the calculation on the table 1 to table 3, it could be seen that there are reductions in the vegetation cover from 78% in 1992 to 45% in 2022. This is due to the increase in the built-up areas from 11.95% in 1992 to 54.95% in 2022. This has also resulted to a decrease in the available land for farming activities. Most of the farmstead surrounding the city of Ado-Ekiti which are popularly and locally called “Aba Ebira” has been overtaken by development such as Ekiti State Housing Corporations, Federal Secretariats and Ekiti State Cargo Airport. The food being consumed in the city are produced from these agricultural lands and farmsteads and now that they have been overtaken by built-up areas, this has led to the transportation of foodstuff from far and near thereby leading to increment in the price of food stuffs in Ado-Ekiti. Ado-Ekiti has changed from agrarian community that was known for to become majorly a Civil- Servant City and the most expensive community in the southwestern part of Nigeria.
This study has attempted to demonstrate that the recent advancements in Remote Sensing and GIS technologies provide powerful tools for mapping and detecting changes in land use and land cover dynamics, digital image processing techniques (RS) to enable speedy, accurate and objective interpretation of the multispectral data received from the satellites. This has helped in a major way to observe the change in land cover as well as sprawl that takes place in urban area at local, regional and global levels. The study shows an increase in built-up area through the study year to about 50% of the total land area of the study area and significant decrease in natural vegetation and agricultural land. The much of the change in the study area reveals that agricultural land and natural vegetation have the highest change for built-up area. The study concludes that there is a progressive encroachment of built-up areas to other land use in the study area, thereby resulting in significant environmental changes and affecting food security.
It is thus recommended that working on land use and mapping will guide the developers, municipals, engineers, planners and other land users. Also, counter urbanization or sub-urbanization should be encouraged by government which will reduce the rural-urban migration. However, this will mitigate the high influx of people to Ado-Ekiti and population will be controlled.
REFERENCES
- Ayedogbon, J Anyanwu S., Isa, G., Petrushenko, Y., Zhuravka, O., (2012) Population growth and food security: Evidence for Nigeria. Problem and perspectives in Management. 20: 402 – 410.
- Dalil, M. Usman, M.Y., Omeiza,I. (2013): The impact of urban development on food security in Peri-Urban area of Minna Niger State Nigeria. International Journal of Humanities and Social Science Invention.
- Ekine, D.I., and Onu,C,(2018).The Impact of Agricultural Output on Economic Growth in Nigeria (1985-2015).IOSR Journal of Economics and Finance 9(4):10-14.
- A.S. (2015). Urbanization: Its Implication for Sustainable Food Security, Health and Nutritional Nexus in Developing Economies-A Case Study of Nigeria Journal of Studies in Social Sciences, 11 (1).
- Food and Agriculture Organization of the United Nations (1996) Rome declaration on world food security and world food summit plan of action. World Food Summit.
- AO (2008): Urbanization and foo security in sub-saharan Africa. Paper prepared for the Regional Conference for Africa, Nairobi Kenya, June 16-29, 2008.
- FAO (2009): The State of Food Insecurity on the World-Economic Crises, Impacts and Lessons Learnt.
- FAO (2013) The State of food insecurity in the world: the multiple dimensions of food security.
- FAO (2017).Nigeria at a glance. http://www.fao.org/nigeria/fao-in-nigeria/nigeria/nigeria/at glance/en/. Accessed 4th August, 2021.
- Kufoniyi, O, (2022) Application of Geographic Information System (GIS) in agriculture. Paper Presented at the 2022 Symposium and Award for Past Officers of the SURCON Ethics Committee Oyo State on 14th December, 2022.
- Mckeegan N. (2007). Over half of the world now live in cities. Retrieved from: gismag.com/go/7613.
- Ogunlade, I.A(,2022). Spatio-Temporal Analysis of Land use Change Ekiti State, South Western Nigeria, A Ph.D Thesis presented to Geography and Planning Science, Department, Ekiti State University, Ado-Ekiti
- Olutoye, E.A and Olutoye A.T (2014). Assessing Agricultural Resources and Nigeria Economy Growth. Journal for finance for micro, small and medium scale enterprise in Nigeria. (22) 8; 371-381.
- Owoo, .N (2020). Demographic Considerations and food security in Nigeria. Journal of Social and Economic Development.
- Undseth, M.C. Jolly and M. Olivani (2020). Space sustainability; the economics of space debris in perspective” OECD science, Tech and Industry policy papers No 87, Organization for Economic Cooperation and Development (OECD) https://doi.org/10:1787/9339de43-en
- UN Population Division (2010). World Population Prospects. UN Department of Economic and Social Affairs.
- Un- Habitat (2001): The state of the world’s cities. United Nations Centre or Human Settlements, Nairobi, P.1 25.
- Van Ginkel, H (2003): Urban future. Nature, 456 (October). 32-33.
- Yusuf, S.A., (2014). Role of Agriculture in Economic Growth and Development Nigeria Perspective.Available:http://mpra.u.b.un1-muenchende/55536.