
Exploratory Factor Analysis of the Items for Measuring Statistical Perceived Ability Instruments
- Nurhasniza Idham Abu Hasan
- Nurul Husna Jamian
- Nur Faezah Jamal
- 1913-1918
- Jul 19, 2024
- Education
Exploratory Factor Analysis of the Items for Measuring Statistical Perceived Ability Instruments
Nurhasniza Idham Abu Hasan, Nurul Husna Jamian, Nur Faezah Jamal
School of Mathematical Sciences Studies, College of Computing, Informatics and Mathematics, Universiti Teknologi MARA, Perak Branch, Tapah Campus, Malaysia.
DOI: https://dx.doi.org/10.47772/IJRISS.2024.803138S
Received: 21 May 2024; Accepted: 15 June 2024; Published: 19 July 2024
ABSTRACT
An important aspect of the education system is measuring student achievement and ability, which provides educators with critical insights into the extent to which students have mastered and comprehension of course learning objectives. Despite the various statistical assessments that have been introduced aimed at measuring the learning objectives of statistics, significant challenges and obstacles persist. This study aims to determine the factors that constitute the statistical perceived ability of the self-developed questionnaire using exploratory factor analysis (EFA). The respondents of this study were 280 undergraduate students via convenience sampling and snowball sampling methods. The results of the EFA showed there are three underlying factor components of statistical perceived ability namely Statistical Literacy, Statistical Reasoning, and Statistical Thinking. These three components explained 73.3% of the total variance with the overall reliability of the instrument is 0.921. Apart from contributing further insight to the current literature on student assessment regarding statistical ability, the results also provide a reliable source of information to researchers for future research on statistical assessment practice skills in Higher Education Institutions (HEIs) that will make a meaningful contribution to statistics education.
Keywords: Assessment, Statistics Learning Goals, Scoring, Statistical Literacy, Statistical Reasoning
INTRODUCTION
The measurement of statistical perceived ability plays an important role in the context of education and professional environments in today’s data-driven world. This statistical ability includes a variety of skills, including interpreting data, understanding descriptive and inferential statistics, and the application of statistical reasoning to real-world problems [1]. The evaluation of this statistical ability is particularly important because it could motivate them to acknowledge statistics in their daily lives, enhance their statistical knowledge, and comprehend statistical ideas. Furthermore, learning statistics will help students develop their critical thinking skills and indirectly help the students in their decision-making through their daily lives.
Many students encounter challenges in mastering this statistical ability. Research from a previous study stated that students concentrated too much on learning the computational part and memorizing the formula [2]. In addition, a study by [3] found that nearly 80% of students often experience anxiety related to statistics, which can cause delays in registering for statistics courses. Based on the aforementioned issues, it is clear that the statistical perceived difficulties not only led to a fear of learning statistical subjects but also resulted from their incapacity to comprehend statistical language, which led to feelings of inadequacy and showed up as physiological symptoms. Researchers and educators have been working nonstop to figure out the best way to implement innovative pedagogies and digital technologies in the classroom to remove the difficulty and fear surrounding statistics [4]. Therefore, a key issue here is how to effectively evaluate this statistical perceived ability so that the students understand and perform well in statistics courses.
One of the ways to accurately measure this ability and assessment is to use statistical techniques such as exploratory factor analysis (EFA). EFA helps in revealing the underlying structure of items designed to measure statistical ability, helping in identifying student strengths and weaknesses and tailoring educational interventions accordingly [5]. This method allows for a deeper understanding of the relationship between measures of ability, impact, and performance in statistics. A study conducted by [6] has shown that statistical thinking skills are influenced by factors such as content, pedagogy, technology, and assessment. Furthermore, the development of reliable assessment tools is essential to assessing students’ statistical abilities. The main goal of this study is to identify and verify the factors that constitute the statistical ability of the self-developed questionnaire by using EFA.
METHODOLOGY
Participants
In this study, a cross-sectional survey design was implemented, starting from March 1st to April 30th, 2024. This study involved 280 undergraduate students who had completed the Elementary Statistics course. The study’s sample size was determined according to the guidelines set forth by [7], who advocate a preferred observation-to-variable ratio of 5:1 for exploratory factor analysis. In this study, 14 items (questions) necessitate a minimum of 70 respondents. Thus, the participation of 280 students in this study exceeded the required sample size. Questionnaires were distributed to all students through WhatsApp, utilizing convenience and snowball sampling techniques.
Measures
A self-administered structured questionnaire, consisting of 14 items, was constructed to evaluate undergraduate students’ perceived ability in statistics. The instruments were assessed using a 5-point scale ranging from “1 – strongly disagree” to “5 – strongly agree”. The description of the item in the survey is displayed in Table 1.
Table 1. The description of items
| Code | Description of item |
| S1 | I tend to make small errors in statistics calculations. |
| S2 | I can understand equations or formulas related to statistics. |
| S3 | I can handle statistical software to carry out statistical analysis. |
| S4 | I can explain results from statistical software output without any problem. |
| S5 | I can understand many statistical concepts very well. |
| S6 | I can generate statistical output from statistical software. |
| S7 | I don’t have any problem understanding the language or terminology used in statistics. |
| S8 | I can select the correct formula (e.g., mean grouped and ungrouped data formula) to solve any statistical problem. |
| S9 | I can explain the symbol used in statistics (note: symbol like N, n). |
| S10 | I can evaluate the result of a solved problem statistically. |
| S11 | I can interpret the value of statistical findings (like mean, mode, and median) obtained from the calculation without any problem. |
| S12 | I can read the results output (such as skewness etc.) from the statistical software such as Excel, SPSS, etc. |
| S13 | I can choose the correct statistical methods/procedures. |
| S14 | I can understand any statistical information published online. |
Analysis
The SPSS version 24 was used to analyse the data using exploratory factor analysis (EFA) as convergent validity and Cronbach alpha as internal consistency reliability. The EFA procedure used the Principal Component Analysis (PCA) extraction method with Varimax rotation to determine the construct validity of the instrument. The preliminary step in data analysis is to determine whether the data were suitable for factor analysis, thus the need to measure sampling adequacy with satisfy the following conditions: i) Kaiser-Meyer Olkin (KMO) test’s score > 0.6, ii) Bartlett’s test of sphericity, significant value: P < 0.05, and Cronbach alpha of 14 items ≥ 0.6.
In the next step, PCA was used to decide on the number of factors by satisfying the following conditions: i) the total variance plot with criteria of eigenvalues greater than 1.0, ii) a scree plot and a cumulative percentage of variance above 60% was used [8]. In this step, factor loadings of each item were examined. According to [6], the retention criteria were indicated by an item of factor loading ≥ 0.5. In other words, an item was loaded into the same factor if the factor loading ≥ 0.5. Otherwise, drop the item for further analysis. This procedure was important in determining which items belong to which factor and was used as a tool for item reduction to a smaller set of underlying factors or components. Finally, Cronbach’s alpha coefficient was used to calculate the internal consistency or reliability of a set of items in each factor obtained. The acceptable cut-off value for the internal consistency reliability based on Cronbach’s alpha coefficient was ≥ 0.60. The criteria for the interpretation of Cronbach’s alpha coefficient for reliability are that any value above 0.8 is a good reliability, between 0.6 and 0.8 is an acceptable reliability, and a Cronbach’s alpha coefficient value below 0.6 is an unacceptable reliability [6].
RESULT
Sample Adequacy and Data Suitability for Factor Analysis
The initial analysis focuses on the suitability of data for factor analysis. The results in Table 2 indicate that Bartlett’s test of sphericity is significant, with a p-value of <0.05. The KMO sampling adequacy measure was 0.848, which exceeded the recommended threshold value of above 0.6 indicating adequate correlations among the items.
Table 2. KMO, Barlett’s test, and Cronbach’s alpha
| No of item | KMO | Bartlett’s Test of Sphericity | Cronbach’s alpha |
| 14 | 0.848 | 0.001 | 0.921 |
Besides that, the result of Cronbach’s alpha for the 14 items used in this study is 0.921, which is closer to 1 and exceeds the minimum recommended threshold value. Therefore, the data is suitable for this analysis.
Number of Factors Affecting Statistical Perceived Ability
The PCA for the statistical perceived ability extracted three components with eigenvalues greater than 1.0. The total variance explained by these generated factors is shown in Table 3.
Table 3. The cumulative percentage of variance
| Initial Eigenvalues | Rotation Sums of Squared Loadings | |||||
| Total | % of Var | Cum % | Total | % of Var | Cum % | |
| 1 | 7.565 | 54.034 | 54.034 | 7.318 | 52.269 | 52.269 |
| 2 | 1.600 | 11.430 | 65.464 | 1.640 | 11.714 | 63.983 |
| 3 | 1.115 | 7.967 | 73.431 | 1.323 | 9.447 | 73.431 |
| 4 | 0.712 | 5.086 | 78.517 | |||
| 5 | 0.586 | 4.182 | 82.699 | |||
| 6 | 0.505 | 3.604 | 86.303 | |||
| 7 | 0.450 | 3.213 | 89.516 | |||
| 8 | 0.389 | 2.779 | 92.295 | |||
| 9 | 0.312 | 2.228 | 94.523 | |||
| 10 | 0.236 | 1.684 | 96.207 | |||
| 11 | 0.203 | 1.447 | 97.654 | |||
| 12 | 0.121 | 0.864 | 98.518 | |||
| 13 | 0.118 | 0.845 | 99.363 | |||
| 14 | 0.089 | 0.637 | 100.000 | |||
The results show that the three factors extracted from the loading value can explain 73.431% of the construct. The scree plot shows three possible factors that can explain 73.431% of the variance, which is above the acceptable threshold of 60% (see Fig. 1).
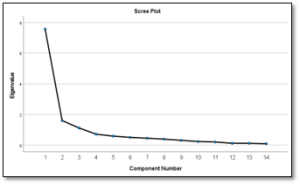
Fig. 1: Scree plot of Component Extraction
The scree plot confirms that the first three factors for the construct account for most of the data’s total variability, with the remaining factors accounting for the remaining small proportion of the variability, and is therefore, less important. For this construct, the solution is the choice of three factors.
Rotated Factor Loading for Statistical Perceived Ability
Table 4 presents the factor loadings for 14 items distributed across three constructs: statistical literacy, reasoning, and thinking. The first factor, identified as statistical literacy, exhibited strong loadings on seven items (S1, S2, S3, S5, S7, S9, and S12). The indicators for statistical literacy include statistical terms/terminology, symbols, formulas/equations, error-free calculations, proficiency with statistical software, statistical concepts, and the ability to read statistical outputs. This finding aligns with [9], who defined statistical literacy as the ‘ability to understand and use the basic language and tools of statistics’.
Six items (S4, S6, S8, S11, S13, and S14) loaded highly on Factor 2, designated as statistical reasoning. The indicators for statistical reasoning encompass the interpretation of values from statistical findings, explanation of results from statistical software output, selection of appropriate formulas and statistical methods/procedures, generation of statistical output from software, and interpretation of statistical information published online. This finding is consistent with [9], who defined statistical reasoning as ‘the ability to choose, generate, and properly interpret appropriate descriptive and inferential methods, make inferences, and justify conclusions’.
Table 4. Matrix of rotated factor loadings
| Item | Factor 1 | Factor 2 | Factor 3 |
| S1 | 0.796 | ||
| S2 | 0.887 | ||
| S3 | 0.819 | ||
| S4 | 0.837 | ||
| S5 | 0.625 | ||
| S6 | 0.852 | ||
| S7 | 0.897 | ||
| S8 | 0.724 | ||
| S9 | 0.858 | ||
| S10 | 0.868 | ||
| S11 | 0.781 | ||
| S12 | 0.873 | ||
| S13 | 0.857 | ||
| S14 | 0.829 |
The third factor, termed statistical thinking, showed high loadings on only one item (S10). The indicators for statistical thinking include the ability to critically evaluate the results of solved problems. This aligns with [9], who defined statistical thinking as ‘understanding why and how statistical investigations are conducted and knowing when and how to apply statistical knowledge and procedures’.
Reliability Analysis for the Scale of Statistical Perceived Ability
Cronbach’s Alpha was used to evaluate the reliability of a set of items in each factor obtained and the result is shown in Table 5.
Table 5. Cronbach’s Alpha
| Component | Cronbach’s Alpha |
| Statistical Literacy | 0.949 |
| Statistical Reasoning | 0.868 |
| Statistical Thinking | 0.829 |
The Cronbach’s alpha values are 0.949, 0.868, and 0.829 for Statistical Literacy, Statistical Reasoning, and Statistical Thinking constructs respectively. This implies that the items in each factor obtained measured the same construct consistently with high reliability.
CONCLUSION
This paper aimed to empirically validate the reliability of an instrument designed to assess factors influencing statistical perceived ability among undergraduate students. Factor analysis revealed three significant constructs underlying statistical perceived ability, namely Statistical Literacy, Statistical Reasoning, and Statistical Thinking. The reliability analysis indicated that each of the items in each construct significantly contributed to the overall reliability of the instrument. Consequently, the findings explicitly demonstrate that the items proposed in this instrument are relevant in this research setting.
ACKNOWLEDGEMENT
The authors express their gratitude to the Universiti Teknologi MARA (UiTM), Perak Branch for their support and recognition of this research.
REFERENCES
- Abd Rashid, N. K., Sulaiman, N. F. C., Anang, Z., Possumah, B. T., Muhamad, S., Sa’at, N. H., Hasan, F.A. & Wahid, H. (2021). Survey dataset on the level of sustainable consumption of Malaysian households from the perspective of income and consumption expenditure. Data in brief, 35, 106743.
- Salim, N. R., & Ayub, A. F. M. (2017, January). Relationship between mathematics statistics engagement and attitudes towards statistics among undergraduate students in Malaysia. In AIP Conference Proceedings(Vol. 1795, No. 1). AIP Publishing.
- Lenzen, M., Li, M., Malik, A., Pomponi, F., Sun, Y. Y., Wiedmann, T., … & Yousefzadeh, M. (2020). Global socio-economic losses and environmental gains from the Coronavirus pandemic. PloS one, 15(7), e0235654.
- Schmid, K. K. (2013). Virtual discussion for real understanding: The use of an online discussion board in an introductory biostatistics course. Technology Innovations in Statistics Education, 7(1).
- Singh, R., & Kishore, V. V. N. (2018). Introduction to energy-efficient building development and sustainability. In Sustainability through Energy-Efficient Buildings(pp. 1-31). CRC Press.
- Hair Jr JF, Black WC, Babin B J, Anderson RE. Exploratory factor analysis: multivariate data analysis. 7th Pearson New International edition. Harlow: Pearson; 2014.
- Joseph, F., Hair, J., Black, W. C., Babin, B. J., & Anderson, R. E. (2018). Multivariate Data Analysis. United Kingdom: Cengage Learning, EMEA Cheriton House, North Way Andover, Hampshire, SP10 5BE United Kingdom Cengage.
- Alavi, M., Visentin, D. C., Thapa, D. K., Hunt, G. E., Watson, R., & Cleary, M. (2020). Exploratory factor analysis and principal component analysis in clinical studies: Which one should you use? Journal of Advanced Nursing, 76(8), 1886-1889.
- Mahmud, Z., Ismail, N. Z. I., Abu Kassim, N. L., & Zainol, M. S. (2018). The effects of attitudes towards statistics, perceived ability, learning practices and teaching practices on students’ performance in statistics: a review. Al-Shajarah, Special issue: Education, 71-97. ISSN 1394-6870.