
Food Production and Life Expectancy: Evidence from the Economic Community of West African States (ECOWAS)
- Chika Priscilla Imoagwu
- Uche Collins Nwogwugwu
- Uju Regina Ezenekwe
- Chris Ulua Kalu
- 2099-2112
- Oct 23, 2023
- Social Science
Food Production and Life Expectancy: Evidence from the Economic Community of West African States (ECOWAS)
*Chika Priscilla Imoagwu, Uche Collins Nwogwugwu, Uju Regina Ezenekwe & Chris Ulua Kalu
Department of Economics, Faculty of Social Sciences, Nnamdi Azikiwe University, Awka, Anambra State, Nigeria
*Corresponding Author
DOI: https://dx.doi.org/10.47772/IJRISS.2023.71071
Received: 08 September 2023; Accepted: 19 September 2023; Published: 23 October 2023
ABSTRACT
The impact of nutritional food and other relevant factors on life expectancy is a motivating factor for this study. In this study, we examined the role of food production in enhancing life expectancy in some selected countries in ECOWAS. The paper used annual series from 1996 to 2021 under the frameworks of panel FMOLS and DOLS. The findings of the study indicated that in the two models used, food production had a significant and positive impact on life expectancy in the selected countries. Government expenditure on health was also found to influence life expectancy positively, while expenditure on education did not have any significant impact. The study also found GDP per capita and population growth rate to adversely impact on life expectancy. In conclusion, the study contends that apart from food production, government expenditure on health, GDP per capita, and population growth are other major determinants of life expectancy in the selected countries. The study is, therefore, of the view that while it is paramount for the government in these countries to encourage the production of nutritional foods by incentivizing the farmers, there is a need for an equitable distribution of income.
Keywords: Food production, Life expectancy, Public Health Expenditure, Panel Data Analysis, ECOWAS.
JEL Codes: C33, H51, I18, O31.
INTRODUCTION
Less developed countries are faced with lower life expectancy as a result of so many factors such as low income, income inequality, and a host of other factors. As observed by Jetter et al. (2019), generally, wealthier countries have a higher average life expectancy than poorer countries due to higher standards of living, more effective health systems, and more resources invested in the determinants of health, such as sanitation, housing and education. In another vein, Preston (1975) revealed that there was a cross-sectional logarithmic curve relationship between national income per capita and life expectancy, such that life expectancy rapidly increases with national income. Improvement in the life expectancy of the people is one of the major preoccupations of governments, especially in less developed countries (LDCs) where the poverty level is high. The importance of improved life expectancy that has made it the focus of policymakers arises from the fact that life expectancy is a measure of the health status of the population.
Life expectancy refers to an individual’s lifespan or the average number of years from birth an individual is expected to live or exist (Aigheyisi, 2020). Over the years, the determinants of life expectancy at birth for different countries have generated much curiosity from diverse angles, such as health, economic, social, and environmental conditions. The literature has also been replete with studies that investigated the factors that influence life expectancy with diverse results. Of all these factors, food intake is an essential factor which affects life expectancy directly because through dietary consumption, the human body is supplied with nutrients that enhance its life span. As noted by Dethier 2011; Nzeh, Uzoechina, Imoagwu & Ogwuru,2023, improvement in agricultural productivity would lead to expansion in food and other agricultural output. Increased food output could enhance life expectancy as a result of an increase in food consumption, which results in a healthier life.
The focus of this study is to examine the contribution of food production to life expectancy in some selected countries in the Economic Community of West African States (ECOWAS). Formed in 1975, the ECOWAS comprised 15 member countries, and it was established as a regional and economic bloc with the key objective of promoting economic integration and the creation of a single large trading bloc. As member countries are mainly exporters of primary commodities, their income level is usually low, with its attendant effect on other socioeconomic outcomes. In this study, we selected 8 ECOWAS countries, namely Nigeria, Mali, Guinea, Ghana, Cape Verde, Côte d’Ivoire, Burkina Faso, and Benin.
The choice of ECOWAS is because, as the countries comprising it are less developed, their life expectancy is assumed to be low. This is because less developed countries have been known to experience low life expectancy, as observed in a 2008 report by the United Nations (UN), which noted that the gap in life expectancy between the more developed and less developed countries was as high as 11 years. As noted earlier, several factors have been noted to adversely affect life expectancy in the LDCs, among which are low levels of per capita income, high income inequality, poor access to healthcare facilities, inadequate food supplies, low-quality education, and low access to modern energy(Aigheyisi, 2020). Inadequate food supply is one major factor affecting life expectancy in the LDCs as Uko-Aviomoh (2005) noted that the problem of food insecurity has serious adverse effects on a nation. This study, therefore is an attempt to join the ongoing debate on the factors that influence life expectancy.
Nevertheless, ECOWAS countries, by virtue of being among the LDCs, are among the countries with the least life expectancy. As observed in Fig. 1, with the exception of Cape Verde, with a life expectancy of 70 years plus, other ECOWAS member countries sampled in the study had low life expectancy. For instance, the average life expectancy for Nigeria within the study period is 52 years, just as other countries had an average life expectancy within that range. Compared to more prosperous countries, such as Singapore, Australia, New Zealand, Hong Kong, Macao, and Japan, Hassan et al.(2017) observed that in 2008, the life expectancy in these countries exceeded 80 years. These statistics call for a conscious effort to examine the relevant factors that determine life expectancy in ECOWAS with a view to providing policy direction. Even though there is a popular view that a high income level is strongly associated with improved life expectancy, some empirical evidence suggests otherwise. For instance, as observed by Hassan et al. (2017), Great Britain and Sweden have lower life expectancies despite the fact that they have higher GDP per capita. Equally, as observed by Asafu-Adjaye (2007), the USA, which is an industrialized country with a very high per capita income, is, however ranked among the countries with lower health outcomes. Even among the ECOWAS, as shown in Figures 1 and 2, Nigeria, which has a relatively high per capita income, is among the countries with low life expectancy.
With these variations in life expectancy for a given level of income, it is obvious that life expectancy may be influenced by factors other than high-income level. This study is therefore motivated to examine the contribution of food production and other relevant factors to life expectancy in the selected countries in ECOWAS. The interest in emphasizing food production is because, apart from food, other indicators of life expectancy do not have a direct bearing on life expectancy since they cannot be ingested directly. For example, some cohort studies have pointed out that the consumption of certain foods or certain compounds in foods has the tendency to prevent diseases and, therefore improve longevity. In a study that concentrated on Swedish women, Roswall et al. (2015) revealed that life expectancy improved significantly with the consumption of the Nordic diet. Equally, Abe et al. (2020) found that Japanese diet raised life expectancy.
It is against this backdrop that the study thought it expedient to capture the contribution of nutritional foods to life expectancy in these countries. Thus, the food production index was used to proxy food production in the study. The World Bank Development Indicators define the food production index to comprise all food crops that are regarded as edible and which contain nutrients. This present study seeks to improve on previous studies in countries within the ECOWAS that overlooked the importance of nutritional foods as a major determinant of life expectancy. Such studies include Arikpo, Eke, and Obafemi (2019), Agu, Agu, and Onwuteaka (2020), and Aigheyisi (2020). Two questions are therefore raised which the study sought to investigate. First, does food production positively influence life expectancy in the selected ECOWAS countries? Second, other than food production, what are the other major determinants of life expectancy in the selected countries?
Some Stylized Facts
In this sub-section, we provide the trends in some of the variables used in the study. Beginning from the trend of life expectancy in Fig. 1, it is shown that the country with the highest life expectancy within the study period is Cape Verde. Life expectancy in Cape Verde was 70 years and above, but it never approached 80 years. Following Cape Verde is Ghana, with an average life expectancy that hovers around the early sixties. Nigeria has the lowest life expectancy among the countries sampled within the study period. The average life expectancy for Nigeria within the study period was 52 years. In all the countries with the exception of Cape Verde, life expectancy on average was 62 years.
Fig.1 Trend of Life Expectancy in the Selected Countries
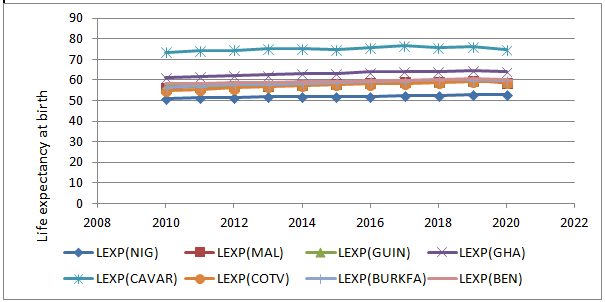
Source: World Development Indicator (2022).
Note: LEX – life expectancy, NIG – Nigeria, MAL – Mali, GUIN – Guinea, GHA – Ghana, CAVAR – Cape Verde, COTV – Côte d’Ivoire, BURKFA – Burkina Faso, BEN – Benin
In Fig. 2, Cape Verde had the highest GDP per capita within the study period. Being the country with the highest life expectancy, it indicates that wealth is equitably distributed in the country. This contrasts with the trend of GDP per capita for Nigeria, which is the second highest among the countries. Life expectancy in Nigeria is the lowest despite having a relatively high GDP per capita and this goes to prove that income distribution in the country is not equitable. Ghana’s life expectancy is high even though its GDP per capita is relatively low. The countries with the least GDP per capita within the study period are Burkina Faso and Mali.
Fig.2 Trend of GDP per capita in the Selected Countries
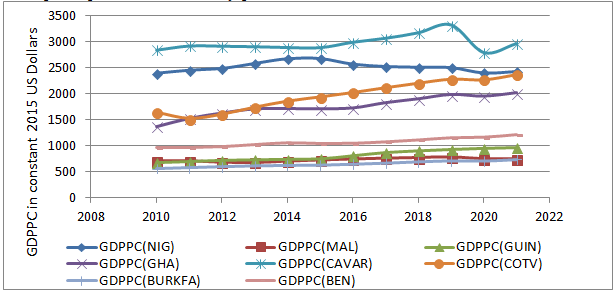
Source: World Development Indicator (2022).
Note: GDPPC – gross domestic product per capita
In terms of food production index, evidence in Fig. 3 indicates that Cape Verde had the highest food production index compared to other countries up to 2012. This equally supports the high level of life expectancy within the period. Around 2015, there seemed to be a convergence in the food production index among the countries. However, after this period, Mali led other countries in the food production index, followed by Côte d’Ivoire. Surprisingly, the country with the lowest food production index after 2015 is Cape Verde.
Fig.3 Trend of Food Production Index in the Selected Countries
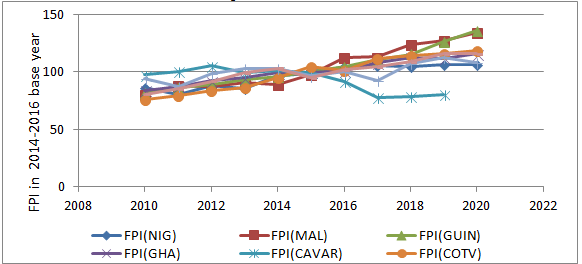
Source: World Development Indicator (2022).
Note: FPI – food production index
EMPIRICAL LITERATURE
The relevance of life expectancy to a country has made studies dedicated to its determinants a worthy course. Across different countries, several empirical works have been carried out on the factors that affect life expectancy with diverse outcomes. In a study for Nigeria, Uyoyou (2010) investigated the constraints to food security and the effects on Nigerians. The study used a questionnaire to obtain a random sample of professionals, such as agricultural science teachers, nutritionists, home economists, and farm managers in four states. The variables considered in the questionnaire are poor crop yield, poor storage facilities, low income, and poverty, which were the causes of food insecurity and malnutrition, poor health status, high death rate, and low life span, which were the effects of food insecurity. Data for the study was analyzed by computing the percentages, mean, standard deviation and variance of the responses. Findings indicated that malnutrition, poor health status, high mortality rate, and low life span were the effects of food insecurity.
Lin et al. (2012) used linear mixed models to examine the longitudinal contributions of four political and socioeconomic factors to life expectancy in less developed countries (LDCs). The variables used in the study are life expectancy at birth, economy, literacy, undernourishment, and political regime. The study found that gross domestic product per capita, literacy rate, and nutritional status were very strong in impacting on life expectancy but continually decreased over time. However, political regimes had the least influence on increased life expectancy at the beginning but later became significant. In another cross-country study involving 136 countries, Monsef and Mehrjardi (2015) used the panel data method to show that unemployment and inflation affected life expectancy negatively, but gross capital formation and gross national income affected it positively. The variables used in the study are life expectancy, inflation, unemployment, capital information rate, and economic development degree.
In a study for Pakistan, Shahbaz et al.(2015) used the auto-regressive distributed lag (ARDL) bounds test to investigate determinants of life expectancy in Pakistan. The variables used in the study are life expectancy per capita, public health spending per capita, agricultural food supply index, economic misery, unemployment, illiteracy rate, and urbanization per capita. The findings of the study showed that while health spending, food supply, and urbanization enhanced life expectancy, the illiteracy rate reduced it. Delavari et al. (2016) used the ordinary least-square (OLS) model to investigate the socioeconomic factors affecting life expectancy in Iran. The variables used in the study are the number of doctors per 10,000 population, inflation rate, literacy rate, life expectancy at birth, food production index, urbanization degree, GDP, total fertility rate, and Co2 emission. Results of the study indicated that GDP per capita, number of doctors per 10,000, population, literacy rate, and food availability had a positive and significant impact on life expectancy. However, the total fertility rate was found to have a negative and significant impact on life expectancy.
In a study involving 36 Asian countries, Abdullah, Siddiquaand Huque ((2017) used the panel fully modified OLS (FMOLS) and dynamic OLS (DOLS)to show that healthcare expenditure and gross domestic product (GDP) are necessities for these countries. The variables used in the study are health care, expenditure, gross domestic product, infant mortality, and life expectancy. In another cross-country study that involved 108 selected developing countries, Hassan et al. (2017)examined the relationship between life expectancy and its determinants. The data considered in the study are life expectancy rate at birth, health expenditure, education index, gross domestic product, improved water coverage, and sanitation. Using the panel data approach, findings showed a positive relationship between life expectancy and the variables used, such as education index, gross domestic product, health expenditure, improved water, and improved sanitation. In the United States of America, Ketenci and Murthy (2018) used the DOLS method to reveal that both educational attainment and real per capita income impacted positively on life expectancy.
For twelve Southeastern European countries, Trpkova- Nestorovska and Levkov (2019) used the co-integration panel regression to examine the key determinants of life expectancy. The variables used in the study are life expectancy at birth, consumer price index, employment to population ratio, food production index, gross national income per capita, current health expenditure per capita, and immunization. The findings of the study indicated that while the consumer price index and gross national income per capita impacted life expectancy positively, a decline in employment impacted it negatively. In a study for Nigeria, Arikpo et al. (2019) used the OLS to investigate the macroeconomic determinants of life expectancy. The variables used in the study are life expectancy, GDP per capita, unemployment rate, consumer price index, Gini coefficient, government capital health expenditure, physician per 1,000 population, carbon dioxide emission index and adult literacy rate. The study found that income inequality, income per capita, and government capital expenditure on health were major determinants of life expectancy in Nigeria.
In another study for Nigeria, Agbatogun et al. (2019) used the OLS to examine the socioeconomic determinants of life expectancy in Nigeria. The variables used in the study are literacy rate, government health expenditure, total number of health workers, per capita income, and life expectancy. Findings indicated that government health expenditure, per capita income, and literacy rate had positive significant effects on life expectancy. However, the total number of health workers had a positive but insignificant relationship with life expectancy. In Iran, Golkhandan(2019)used the Johansen co-integration test to examine the long-term relationship among life expectancy, misery index, per capita public health expenditure, food production index, illiteracy rate, and urbanization. The findings of the study reveal that the food production index, per capita public health expenditure, and urbanization raised life expectancy, while the misery index and illiteracy rate decreased in the long term.
In a study for Turkey, Gulcan (2020)employed the Granger causality test based on the vector error correction model (VECM) to examine the causal relationship between life expectancy and its determinants. The variables used in the study are life expectancy, GDP per capita, food production index, carbon dioxide emission (CO2), and urbanization. Findings indicated that although the variables used in the model, such as GDP per capita, food production index, CO2, and urbanization, had a long-run relationship, only urbanization Granger caused life expectancy. Aigheyisi (2020) examined the effects of agricultural productivity and other economic factors on life expectancy in Nigeria. The variables used in the study are life expectancy at birth, energy poverty, agricultural productivity, unemployment, per capita income, inflation, and nominal exchange rate. The study used the ARDL to show that improvement in agricultural productivity enhanced life expectancy in the short in, but adversely affected it in the long run. Also, inflation and unemployment adversely affected life expectancy both in the short-run and in the long-run. The effect of real per capita income was also found to be negative both in short-run and in the long run effect. While government expenditure on education was significant in both the short-run and the long-run, health expenditure positively affected life expectancy in the short run and in the long run. In another study for Nigeria, Agu et al.(2020) employed the multivariate ordinary least squares to investigate food poverty and its implications for life expectancy in Nigeria. The variables used in the study are life expectancy, total Labour force, capital formation, agricultural output, and food items importation. The findings of the study showed that while capital formation, total labour force, and food importation impacted positively on life expectancy in Nigeria, food poverty had a negative impact. In a cross-country study involving 196 countries and four territories,
Onwube et al. (2021) investigated the determinants of life expectancy in Nigeria using the ARDL estimation technique. The variables used in the study are life expectancy at birth, GDP per capita, inflation rate, imports of goods and services, household final consumption expenditure, general government final consumption expenditure, and official exchange rate. The findings of the study revealed that GDP per capita, inflation rate, imports, and government consumption expenditure had a positive impact on life expectancy in the short run, whereas the current inflation rate, imports, household consumption expenditure, and exchange rate had a negative impact on life expectancy. In the long run, GDP per capita, household final consumption, and exchange impacted positively on life expectancy, while inflation rate, imports, and general government final consumption expenditure impacted negatively on life expectancy. Galvani-Townsend, Martinez, and Pandey (2022) used descriptive statistical analysis to examine if life expectancy is higher in countries and territories with publicly funded health care. The variables used in the study are life expectancy, health care access, literacy rate, secondary education, per capita GDP, unemployment, pollution, road fatalities, male suicide rate, substance use disorders, undernourishment and infants lacking immunizations. The findings of the study revealed that publicly funded health care and social determinants of health affected life expectancy positively.
METHODOLOGY
Theoretical Framework and empirical model
The theoretical model reviewed in this study is the demand for the health model propounded by Grossman (1972). This model is anchored on the production theory that describes the relationship between factors of production and the output of goods and services for the derivation of utility. As noted by Koutsoyiannis (1979), the production function is purely a technical relationship that links factor inputs and outputs. Colaborating this, Wagstaff (1986) contended that in Economics, the correlation linking a firm’s inputs and the final output is known as the production function. Grossman (1972) built a model of the demand for health with respect to better health in order to provide a solution to the complex problems associated with the optimization of the health lifecycle. The model centered on health and investment in health, which facilitated a thorough knowledge of the role of several indicators such as education, age, and income in health production through the demand for health capital. Under this model, health is regarded as an endogenous variable that people could improve through consumption and production. Also, health is seen as capital stock because it depends on time or the age of an individual, and it is assumed to depreciate as individuals get older. The production function is health inputs such as diet, health care, income, environment, time, and other indicators in addition to health capital stock over time in order to produce good health. Conceptually, as these explanatory variables improve, such will lead to increase in life expectancy rate as health stock. By implication, the level of health is greater when income, education level, health expenditure, and so on are higher, and the resultant effect is an improvement in the efficiency of health production.
The study commenced the analysis by first carrying out unit root tests to identify the order of integration of the series. Panel unit root tests, namely Levin, Lin, and Chu (LLC) and Im, Pesaran, and Shin (IPS) tests, were used to test whether there is a presence of stationarity in the data series. These tests were conducted at level and at first difference. Having ascertained the order of integration of the series, the study conducted the co-integration tests using the Johansen Fisher panel co-integration and the Pedroni residual panel co-integration tests. Lastly, the cointegrating equation estimations include the application of the FMOLS and DOLS techniques proposed by Philips and Hansen (1990) and Stock and Watson (1993), respectively. These techniques seek to estimate or quantify the long-run relationship among the variables. Both FMOLS and DOLS can be applied under the condition that a long-run relationship exists among the series.
However, with a modification from the Grossman (1972) health model, the present study attempted to include the effect of food production among the other variables observed to improve life expectancy. The functional form of the model is as follows:
![]()
LEX = life expectancy, EPI= food production index, GDPPC = gross domestic product per capita, GEE= government expenditure on education, GHE= government health expenditure,
PGR = population growth rate. Guided by equation 1 and following Adom, Amakye, Barnor, and Quartey (2015), the panel FMOLS estimator can be specified as follows.

Where:
FME= Fully Modified Estimator, Yit and λ12 = terms used to correct the endogeneity and serial correlation in the model. The FMOLS estimator is asymptotically unbiased and has a fully efficient mixture-normal asymptotic distribution, which allows for standard Wald tests using the asymptotic chi-square statistical inference (Adom et al., 2015).
The panel DOLS model is specified as follows:

Where: β = long-run elasticity, ∅ = coefficients of leads and lags differences of the regressors. As observed by Herzer and Nowak-Lehmann (2006), these coefficients serve to adjust for possible endogeneity, autocorrelation, and non-normal residuals.
The choice of the FMOLS and the DOLS for the study is based on their ability to solve the endogeneity problem and eliminate serial correlation present in standard OLS. They equally eliminate small sample bias. As observed by Amarawickrama and Hunt (2007), the FMOLS method performs better than the Engel Granger (EG) techniques by introducing appropriate correction to overcome the inference problem inherent in the EG method, thus providing valid long-run estimates. As further noted by Agbola(2013) and Bashier and Siam(2014), the FMOLS technique provides consistent parameters even in the small sample size; therefore it handles the problems of endogeneity, omitted variable bias, serial correlation, measurement errors and allows for the heterogeneity in the long-run parameters. Similarly, the DOLS model deals with simultaneity and small sample bias by including leads and lags (Kurozumi & Hayakawa, 2009). The estimators of DOLS can be obtained from least-squares estimates, and these estimators are unbiased and asymptotically efficient even in the presence of the endogenous problem. As contended by Stock & Watson (1993), the parameters of DOLS adjust to possible autocorrelation and residual non-normality. Additionally, the panel DOLS and FMOLS techniques facilitate the estimation of a regression model that does not require the need to take differences of the cointegrated variables, thus eliminating the possibility of loss of any information about the dependent and explanatory variables.
Variables and Data
The study used annual series that cover the period from 1996 to 2021, and the choice of the sample size is based on data availability for most of the variables used in the model. The data source for all the variables is the World Bank Development Indicators. Life expectancy is measured as total years from birth, while the production index is measured using the 2014-2016 base year. GDP per capita is measured in constant 2015 US Dollars, domestic general government education expenditure is measured as a percentage of GDP, population growth is measured on annual parentage, while domestic general government health expenditure is measured on a per capita basis in current US Dollars.
RESULTS AND DISCUSSION
Table 4.1: Results of Panel Unit Roots
| LLC | PP-FISHER | |||
| Level | First Difference | Level | First Difference | |
| LEX | 3.396(0.99) | -1.609(0.05) | 7.683( 0.95) | 90.488(0.00) |
| FPI | 1.284(0.90) | -5.278(0.00) | 12.800( 0.68) | 61.080(0.00) |
| GDPPC | 1.2049( 0.88) | -1.925( 0.02) | 7.579( 0.96) | 82.779( 0.00) |
| GEE | -1.355( 0.08) | -3.218( 0.00) | 36.431(0.00) | 114.57(0.00) |
| GHE | -0.041( 0.48) | -7.160(0.00) | 19.813(0.22) | 122.426(0.00) |
| PGR | 2.927( 0.99) | -2.667( 0.00) | 28.409(0.02) | 74.949( 0.00) |
Source: Researcher’s computation using E-View 10
The results of stationarity in Table 4.1 were evaluated at the 5% level of significance. Findings reveal that under LLC, all the series were non-stationary at a level. However, as they were first differenced, they became stationary. Under the PP-Fisher, the study found that both government expenditure on education and population growth rate were stationary at level, while other series achieved stationarity at first difference.
Table 4.2: Results of Pedroni Panel Residual Co-integration Test
| t-statistics | Prob. | |
| within group | ||
| Panel v-Statistic | -1.846 | 0.96 |
| Panel rho-Statisti- | 1.385 | 0.91 |
| Panel PP-Statistic | -0.485 | 0.31 |
| Panel ADF-Statistic | -0.272 | 0.39 |
| between group | ||
| Group rho-Statistic | 1.880 | 0.97 |
| Group PP-Statistic | -1.609 | 0.05 |
| Group ADF-Statistic | -1.356 | 0.08 |
Source: Researcher’s computation using E-View 10
The results of the Pedroni panel co-integration test presented in Table 4.2 indicate that for both within group and between the group, the panel PP statistics and panel ADF statistics are statistically significant at the 10% level of significance. By implication, the series are cointegrated. The result of the Pedroni panel co-integration test is confirmed by the result of the Johansen-Fisher panel co-integration test.
Table 4. 3: Results of Johansen Fisher Panel Co-integration Test
| Hypothesized | Fisher Stat.* | Prob. | Fisher Stat.* | Prob. |
| No. of CE(s) | (from trace test) | (from max-eigen test) | ||
| None | 284.2 | 0.00 | 161.3 | 0.00 |
| At most 1 | 149.0 | 0.00 | 75.31 | 0.00 |
| At most 2 | 86.35 | 0.00 | 49.22 | 0.00 |
| At most 3 | 50.01 | 0.00 | 27.17 | 0.03 |
| At most 4 | 37.81 | 0.00 | 25.29 | 0.06 |
| At most 5 | 44.53 | 0.00 | 44.53 | 0.00 |
Source: Researcher’s computation using E-View 10
Evidence shows that under the Johansen-Fisher panel co-integration test in Table 4.3, both the Trace and the Maximum Eigenvalue tests showed probability values that are less than the 10% level of significance.
Table 4.4: Results of Panel FMOLS and DOLS
| FMOLS | DOLS | |||||
| Variable | Coefficient | t-Stat | Prob. | Coefficient | t-Stat | Prob. |
| FPI | 0.455 | 29.628 | 0.00 | 0.116 | 7.504 | 0.00 |
| GDPPC | -0.006 | -2.696 | 0.00 | 0.001 | 1.283 | 0.20 |
| GHE | 0.219 | 3.756 | 0.00 | 0.071 | 1.261 | 0.21 |
| GEE | 0.06 | 0.990 | 0.32 | -0.078 | -1.159 | 0.25 |
| PGR | -6.290 | -2.594 | 0.01 | -1.335 | -2.121 | 0.03 |
| R2 | 0.925 | 0.996 | ||||
| AdjR2 | 0.917 | 0.988 | ||||
| Long-run variance | 12.661 | 0.222 | ||||
Source: Researcher’s computation using E-View 10
Having ascertained that the series are cointegrated, the study went ahead to discuss the results of the panel FMOLS and DOLS. The results in Table 4.4 reveal that under the FMOLS, the food production index had a positive and significant impact on life expectancy. One unit rise in the food production index led to an increase in life expectancy by 0.46 percent. In a similar vein, the result of the DOLS indicates a significant and positive impact of the food production index on life expectancy. The positive impact of the food production index on life expectancy found support in Lin et al. (2012) for less developed countries, Shahbaz et al.(2015) for Pakistan and Golkhandan (2019) for Iran. Equally, the study found support in Aigheyisi (2020) for Nigeria. The implication of the study is that nutritional food production prolongs the life of the citizens of the countries sampled in the study. GDP per capita was found to exert a negative and significant influence on life expectancy under the FMOLS. However, under the DOLS, the impact was not significant even though it was positive. The negative impact of GDP per capita on life expectancy found support in a study for Nigeria by Aigheyisi (2020). This study is of the opinion that the reason for this outcome could be because wealth is not equitably distributed among the citizens of the countries that were sampled in the study. This result is in contrast to the finding by Ketenci and Murthy (2018) for the USA.
The study found that in the two models, health expenditure and expenditure on education impacted positively on life expectancy within the study period. While government expenditure on health was significant under FMOLS, it was not significant under DOLS, just as the impact of expenditure on education was not significant in either of the two models. The positive impact of health expenditure on life expectancy found support in Shahbaz et al.(2015) for Pakistan, Hassan et al. (2017) for developing countries, and Arikpo et al. (2019) for Nigeria. The study contends that the several health intervention measures carried out in these countries are effective in improving life expectancy. However, the impact of spending on education is not significantly felt within the study period. With respect to the population growth rate, the study found that the rising population reduced life expectancy in the countries sampled. This result indicates that with limited resources, population increase puts pressure on the available resources, thus impacting negatively on the welfare of the people.
CONCLUSION AND POLICY RECOMMENDATIONS
This study used an annual series to examine the impact of food production on life expectancy in ECOWAS countries over the period from 1996 to 2021. The findings of the study revealed that food production impacted positively on life expectancy in the two models used in the study. However, while GDP per capita had a negative and significant impact on life expectancy under the FMOLS, under the DOLS, the impact is positive even though it is not significant. The study also found that government expenditure on health had a positive and significant impact on life expectancy, but the impact of government expenditure on education was not significant. Population growth rate was also found to have a significant and negative impact on life expectancy in the two models. The study, therefore, concludes that apart from food production, government health expenditure on education, GDP per capita, and population growth rate are other major determinants of life expectancy in the selected ECOWAS countries.
Therefore, with the foregoing results of the study, the study recommends that the governments of these countries should encourage the production of local nutritional foods by providing incentives to the farmers. Such could be in the form of providing improved seedlings and soft loans to farmers. Again, the fact that GDP per capita impacted negatively on life expectancy implies that there is unequal distribution of wealth in these countries. Consequently, the study contends that there is a need for institutional reforms that will check corruption and encourage equitable distribution of income. While health intervention programmes should be stepped up through proper funding, the educational sector has to be upgraded through the development of a functional curriculum. Also, the implementation of the programmes under education has to be monitored so that appropriated funds are not diverted to other use. Finally, the study recommends that population growth has to be checked using appropriate family planning programmes.
Literature Gap
Studies have been carried out to determine the factors that affect life expectancy at both country-specific and at cross-country levels with varying outcomes. However, from the existing literature and to the best of our knowledge, there is no such study dedicated to the investigation of the impact of nutritional food production on life expectancy in ECOWAS. The choice of this proxy is based on the fact that it directly impacts on peoples’ life expectancy since food is directly consumed, unlike other determinants of life expectancy. As shown in Figure 1, life expectancy in the selected ECOWAS countries, on average, hovered around 50 years with the exception of Cape Verde, whose life expectancy attained 70 years within the sampled period. It is, therefore, pertinent to examine the contribution of nutritional food to life expectancy in these countries. Some studies that were carried out within some countries in ECOWAS did not consider the relevance of the contribution of nutritional foods to life expectancy. In this study, we depart from such studies by factoring in the impact of nutritional foods on life expectancy in the selected countries, bearing in mind that the ingestion of nutritional foods has a direct impact on life expectancy.
COMPETING INTEREST
The authors declared that they have no competing interests.
ACKNOWLEDGEMENT
I sincerely appreciate all who contributed towards the success of this research work. Your critical comments, inputs, and proofreading of the manuscript are in no small measure appreciated.
REFERENCES
- Abajobir, A. A., Abate, K. H., Abbafati, C., Abbas, K. M., & Abera, S. F. (2017). Global, regional and national under-5 mortality, adult mortality, age-specific mortality and life expectancy,1970-2016: A systematic analysis for the Global Burden of Disease Study Lnacet 390 (17),1084-1150.
- Abdullah, S. M., Siddiqui, S. & Huque, R. (2017): Is health care a necessary or a luxury product for Asian countries? An answer using the panel approach. Health Economics Review, Springer, Heidelberg, 7(4), 1-12. https://doi.org/10.1186/s13561-017-0144-8.
- Adom, P. K., Amakye, K., Barnor, C., & Quartey, G. (2015).The long-run impact of idiosyncratic and common shocks on industry output in Ghana.OPEC Energy Review, 39(1), 17-52.
- Agbatogun, K. K., Osinusi, B. K. & Opeloyeru, O. S. (2019).Socioeconomic determinants of life expectancy in Nigeria. The International Journal of Business and Management, 7 (11), 263-269.
- Agbola, F. W. (2013). Does human capital constrain the impact of foreign direct investment and remittances on economic growth in Ghana? Journal of Applied Economics, 45(19), 2853-2862.
- Agu, Agu and Onwuteaka (2020).Food poverty in Nigeria: Implications for life expectancy. Journal of Economics and Sustainable Development, 11(2), 107-114.DOI: 10.7176/JESD/11-2-11.
- Aigheyisi, O.S. (2020). Determinants of life expectancy in Nigeria: Does agricultural productivity matter? KIU Interdisciplinary Journal of Humanities and Social Sciences, 1(2), 194-210.
- Amarawickrama, H. A., & Hunt, L. C. (2007). Electricity demand for Sri Lanka: A time series
- Surrey Energy Economics Discussion Paper Series, No.118.
- Arikpo, D. I., Eke, F. A. & Obafemi, F. N. (2019). Determinants of life expectancy in Nigeria: A macroeconomic analysis. International Journal of Social Science and Economic Research, 04(04), 2722-
- Asafu-adjaye, J. (2007). Income inequality and health_: a multi-country analysis. International Journal of Social Economics, 31(1), 195-207. http://dx.doi.org/10.1108/03068290410515501.
- Bashier, A. A., & Siam, A. J. (2014). Immigration and economic growth in Jordan: FMOLS approach .International Journal of Humanities Social Sciences and Education, 1(9), 85-92.
- Delavari, S., Zandian, H., Rezaei, S., Moradinazar, N., Delavari, S., Saber, A. & Fallah, R. (2016). Life expectancy and its socioeconomic determinants in Iran. Electronic Physician. 8(10), 3062-3068..DOI: http://dx.doi.org/10.19082/3062.
- Dethier, J., (2011). Food Crisis:The Role of Agricultural Productivity. World Bank https:// blogs. world bank. org/development talk/food-crisis-the-role-of-agricultural-productivity.
- Ehiedu, V.C., & Imoagwu, C.P. (2022). Effect of corporate diversification strategies on the financial performance of Industrial goods in Nigeria. International journal Of applied research in social sciences ,4(8),293-305.
- Ehiedu, V.C., & Imoagwu, C.P. (2022). Firm Specific determinants and its implication on listed Oil and Gas firm profitability in Nigeria. International journal Of advanced Economics, 4(7), 142-158.
- Ezeanyeji, C.I., Imoagwu, C. P. & Ejefobihi, U.F. (2019). Public debt and inflation in Nigeria: An econometric analysis. International Journal of Applied Research, 5(3), 219-224.
- Galvani-Townsend S, Martinez I. & Pandey A. (2022). Is life expectancy higher in countries and territories with publicly funded healthcare? Global analysis of health care access and the social determinants of health. Journal of Global Health, 12(04091).doi: 10.7189/jogh.12.04091.
- Golkhandan, A. (2019).Long-term impact of economic misery on the life expectancy in Iran.Health Research Journal, 4(2), 104-111.
- Grossman, M. (1972).On the concept of health capital and the demand for health. Journal of Political Economy,80(2), 223-255.
- Gulcan, C. (2020). A study on life expectancy in Turkey. Eastern Mediterranean University Journal of Pharmaceutical Sciences, 3(2), 86-96.
- Hassan, F. A., Minato, N., Ishida, S. & Nor, N. M. (2017). Social environment determinants of life expectancy in developing countries: A panel data analysis. Global Journal of Health Science, 9(5), 105-117.
- Herzer, D., & Nowak-Lehmann, F. (2006). Is there a long-run relationship between exports and imports in Chile? Applied Economics Letters, 13(15), 981-986.
- Imoagwu, C.P., & Ezeanyieji, C.I. (2018). Financial Development and Economic Growth Nexus in Nigeria. International Journal of Business and Management Invention (IJBMI), 8( 03), 50-63.
- Imoagwu, C.P., Ozoh, J.N., Madueke, C.M., & Mbah, C.C. (2021). Impact of African free trade policy agreement on the socio-economic development: Scenario analysis. European Journal of Economics and Financial Research 4(4), 108-127.
- Imoagwu, C.P.,Ezenekwe, U.R., & Nwogwugwu, U. C. (2023). Rising External debt and Exchange Rate: Empirical Evidence from Nigeria. International Journal of Advanced Economics 5(4), 90-106.
- Imoagwu, C.P.,Nwagu, U.G., Kalu, C.U.,& Okaforocha, C. M. (2022). Efficacy of Monetary Policy Measures on Price and Exchange Rate Stability in Nigeria. Asian Journal of Economics, Business and accounting, 22(23), 162-174.
- Jetter, M,,Laudage, S, & Stadelmann, D. (2019). The intimate link between income levels and life expectancy: global evidence from 213 years. Social Science Quarterly,.100:1387–403.
- Kalu, C. U., & Imoagwu, C.P. (2020). Household Income as an indicator for addressing Poverty, Springer International Journal, 9(5),1-12.
- Kalu, C. U., Onuigbo, C., Imoagwu, C. P. & Njemanze, C. (2021). Infrastructure in the context of Economic Growth and Development in Nigeria: Implications for the Sustainbale Development Goals (SDGs), Journal of International Economic Relations and Development Economics 1(1), 58-73.
- Ketenci, N. & Murthy, V. N. R. (2018). Some determinants of life expectancy in the United States: Results from co-integration tests under structural breaks. Journal of Economics and Finance, 42, 508-525.
- Koutsoyiannis, A. (1979). Modern Micro-Economics. Macmillan Press: London.
- Kurozumi, E., & Hayakawa, K. (2009).Asymptotic properties of the efficient estimators for cointegrating regression models with serially dependent errors. Journal of Econometrics,149(2), 118-135.
- Lin, R., Chen, Y., Chien. L. &and Chan, C. (2012). Political and social determinants of life expectancy in less developed countries: A longitudinal study. BMC Public Health, 12(85), 2- 8 .http:// www .biomedcentral .com/ 1471-2458/12/85.
- Monsef, A. & Mehrjardi, A. S. (2015). Determinants of life expectancy: A panel data approach. Asian Economic and Financial Review, 5(11), 1251-1257.
- Mwabu, G. (2007). Health economics for low-income countries. Center discussion paper No. 955. Economic Growth Center Yale University.
- Nzeh, I.C., Uzoechina, B.I., Imoagwu, C.P. & Ogwuru, H.O.R. (2023). Investigating the Determinants of Cereal Production in Nigeria. Interantional Journal of advanced Studies in Economics and Public Sector Management 11(2), 33-48. DOI. 10:48028/iiprds/ijasepsm.VII.12.04.
- Onwube, O., Chukwu, A. B., Ahamba, K. O., Emenekwe, C. & Enyoghasim, M. O. (2021).Determinants of life expectancy in Nigeria: An autoregressive distributed lag approach. Journal of Sustainability Science and Management, 16(8), 177-192.
- Phillips, P. C. B. & Hansen, B. (1990). Statistical inference in instrumental variables regression with I(1) Processes. The Review of Economic Studies, 57, 99-125.
- Shahbaz, M., Nanthakumar, L., Nooreen, M., Amjad, A. & Ahmed, N.(2015).Determinants of life expectancy and its prospects under the role of economic misery: A case of Pakistan. MPRA Paper No. 67167.https:// mpra.ub.uni-muenchen.de/67167/ posted 11 Oct 2015 09:34 UTC.
- Stock, J. H., & Watson, M. W. (1993). A simple estimator of cointegrating vectors in higher order integrated systems. Econometrica, 61(4), 783-820.
- Trpkova-Nestorovska, M. & Levkov (2019). Determinants of life expectancy: analysis of Southeastern European countries. knowledge-International Journal, 31(1), 193-198.
- Uko-Aviomoh, E.C. (2005). Family education, vocationalism and food security of the Nigerian child. Journal of Home Economics Research.6(2).
- United Nations (UN): World Population Prospects: The 2006 Revision. http:// www.un.org/ esa/ population/ publications/wpp2006/wpp2006.htm.
- Uyoyou, I. B. (2010).Constraints to food security in Nigeria and implications. African Research Reviews, 4 (4), 136-143.
- Wagstaff, A. (1986). The demand for health: theory and applications. Journal of Epidemiology and Community Health, 40, 1-11.
- World Health Organisation (WHO), (2017) World Health Statistics.
- World Bank (2019).West Africa Agricultural Productivity Program (WAAPP).
- World Food Programme (WFP) (2020). Food Security Highlights. Available on: https:// analytics .wfp.org/ t/ public/views/West Africa Food Security Trends_ Adm O/RDB Food Security Trends [[Accessed June 20, 2023].
- World Development Indicators (2022).http://wdi.Worldbank .org.