Gender Gap in the Paid Economic Activity and Economic Growth in the CEMAC Zone
- Henri Bello Fika
- 2329-2349
- Aug 15, 2024
- Economics
Gender Gap in the Paid Economic Activity and Economic Growth in the CEMAC Zone
Henri Bello Fika
African Center for International, Diplomatic, Economic and Strategic Studies (CEIDES)
DOI: https://dx.doi.org/10.47772/IJRISS.2024.807182
Received: 29 June 2024; Revised: 10 July 2024; Accepted: 17 July 2024; Published: 15 August 2024
ABSTRACT
The aim of this paper is to determine the impact on the economic growth rates in the CEMAC zone of the gender gap in terms of participation in paid economic activity. For that, we carry out a panel data analysis after having elaborated a balanced growth model integrating the gender aspect. The results obtained show that the improvement of the woman/man parity index in the paid economic activity has a significant at 5% level and positive impact in the long run on the economic growth in the CEMAC zone. The step-by-step model enables us to notice that this impact is significant only if the improvement of the gender index is accompanied by a rise of the fixed capital gross formation. The parameters obtained from the regression enable us to estimate for each country of CEMAC zone the sexo-specific growth rates of the GDP per capita (i.e. the growth rates that one would have observed in the event of perfect equality of chances between men and women as regards participation in a paid economic activity) and thus the profits in terms of economic performance and to plot for each country the sexo-specific growth paths. According to these estimates, implementing policies aiming at reducing the existing gap between men and women in the apid activity would be beneficial for all the economies of the CEMAC zone in terms of economic performance.
Keywords: Gender, Paid Activity, Economic Growth, Panel Data, CEMAC
JEL Classification Code : C23, C51, J16, O11, O4, R11
INTRODUCTION
The economic, social, and political development of a country cannot be made without the effective participation of all the strata of society in particular women, whose demographic weight is not the least (Lopez-Claros and Zahidi 2005). Indeed, the rise of the female economic activity does not improve only the situation of the women, but also that of the society as a whole by stimulating the economic growth, by balancing the retirement system and by reducing the families’ risk of poverty (Letablier et al. 2009). The participation of the women in the economic activity thus constitutes a powerful factor of improvement of the economic performances of a country (Pissarides 2006). These facts thus call into question the traditional model of the man provider and the woman devoted to the domestic businesses, i.e., a system characterized by the association of the active and productive pole to the men and of the passive and reproductive axis to the women. Besides, this justifies the fifth Sustainable Development Goal (SDG). Thus, the question of the importance of the female human capital for the economic development challenges the industrialized economies as well as developing ones and thus, a fortiori the countries of Sub-Saharan Africa among which Cameroon, space chosen for our study.
According to datas provided by the World Bank (World Development Indicators, 2012), the period 1990-2011 was marked in CEMAC zone by relatively weak and even sometimes negative growth rates of the GDP per capita, although one observes per moment peaks, in particular in Equatorial Guinea and in Chad. This can be explained by a certain number of factors among which the age structure of the population (very young population characterized by a high demographic dependence ratio), the devaluation of CFA franc, fluctuations of the course of the raw materials, the quality of the institutions, an insufficient economic integration. But there is also an aspect which deserves a particular attention which is the gender.
Indeed, according to data of World Development Indicators (2018), one observes in the six (06) countries of the CEMAC over the period 1990-2016, a relatively weak rise of the women/men parity index in terms of participation in the economic activity. This index indeed grew from 69.4% to 82.7% for Cameroun (a rise of 13.3 percentage points), from 79.5% to 85.1% for the Central African Republic (a rise of 5.6 percentage points), from 81.5% to 93.8% in Congo, 78.8% to 86.3% in Gabon, 87.7% to 87.3% in Equatorial Guinea and from 79.1% to 80.4% in Chad. These variations in terms of participation in the economic activity, constitute by this fact a proof of an underutilization of the economic potential in terms of human resources or human capital whose the countries of CEMAC zone fully emphasize for the acceleration of their accession process to the status of emergent country. Consequently, the principal question that these empirical observations bring about is: what is the impact of the gender gap between sexes in the paid activity economic on the economic growth in CEMAC zone? It is precisely this question and the above considerations that constitute the cogency of our analysis.
LITERATURE REVIEW
This literature review is based on the need for having an idea of the various mechanisms or channels by which the gender issues, regarding participation in the paid economic activity, impact the economic performance of a country apprehended here by the growth of the GDP per capita. But as a preliminary we propose to present a certain number of empirical observations with regard to the relationship between these two indicators.
Observations
Pervaiz et al. (2011) analyze the impact of the gender inequalities on the economic growth in Pakistan. They use time series over the period 1972-2009, extracted from the data of the WDI (World Bank Indicators). These authors show, following their analyses, that the growth rate of the real GDP per capita is an increasing function of labor, investment, economic opening and a decreasing function of the of the gender gap composite index. However, this study carried out by Pervaiz et al. (2011) is more relevant if one would like to estimate the impact of the gender gap, taking in consideration the global aspect of the expression, compared to the case where one would rather like to estimate the impact of the components of these inequalities taken individually. This idea of “bursting” is taken into account by Gümbel (2004). Indeed, Gümbel (2004), after linking three gender inequality indicators (particularly in terms of health, education and employment) and the economic growth, concluded that among of the three indicators, the gender gap as regards employment are those which explain more the differences in growth of income per capita between country.
In the same way, Daly (2007), an economist of Goldman Sachs, has shown, thanks to quantitative analyses, that the reduction of the barriers to the participation of the women in the economic activity would make grow the American GDP of 9%. Klasen and Lamanna (2009) carried out in this same wake a cross country data analysis over the period 1960-2000, with for spaces of study the countries of the Middle-East, of and Asia North Africa of the East. At first sight, they notice that the countries of East Asia, which is characterized by a relatively small gender gap in terms of employment, have the strongest economic growth rates. This can of course let believe in a possible opposite relation between gender inequalities in terms of economic activity and economic growth. To check this assumption, these authors carry out the cross section panel data regressions. They conclude their study in the favour a negative relationship between gender inequalities in terms of education and employment on the one hand and economic growth on the other hand.
Cavalcanti and Tavares (2008) who makes his analyses in the case of India. He runs a regression on panel and controls the problem of endogeneity by using instrumental variables. It thus shows after the estimation of the parameters that the gap between men and women in terms of employment has a negative and statistically significant effect on the economic growth of India.
It is also appropriate to note that as many countries of East Asia could be competitive on the world market thanks to the exploitation of the export manufacturing industries with strong intensity of female labor (relatively cheap), but the proportion of the women in labor depends positively on their educational level (Drank and Spielman, 2006).
This relation is also observed in the agricultural sector. Indeed, Quisumbing (2003) considers that the reduction of the inequalities in terms of human and physical capital between male and female farmers in Subsaharan Africa would make grow the productivity from 10 to 20%. Consequently, it becomes obvious to understand why the weak or non-existent rights of ownership land of the women, especially in Africa, are identified as being one of the causes of the production inefficiences.
Using the panel data analysiss of, Bandiera and Natraj (2013) find an opposite relationship between gender inequality and economic growth, but the results are nonconclusive because of the causality problem and the lack of information on the mechanisms which lead or which affect the relation between gender inequality and development. A good analysis would require that one gives a progress report on the various possible channels which could make it possible to explain this observed relationship.
Mechanisms
The scientific environment of the paradigms in which the present study fits requires that one dwells too long on the mechanisms or channels by which the gender parity index in terms of participation in paid activity influence the economic performance.
The Fertility Channel
According to Aaronson et al. (2018), Del Rey et al. (2021) and Cavalcanti and Tavares (2008), the gender inequalities in terms of participation in paid economic activity are associated to high levels of fertility, which in turn reduce the economic growth. A reduction of the gender gap brings about a fall of the GFI (Gross Fertility Index ) which in turn causes a fall of the growth rate of the population and consequently a rise in the capital per unit of labor.
For Milovanović, M. (2023) the gender inequalities undermine the objectives of development. This has economic implications of course. Indeed, one could a little further go up the chain while checking than the gender inequalities in terms of education in Volve a strong infant mortality rate resulting in hight GFI. These situations can consequently have negative consequences on the education and the health of the children. If moreover girls have more capacities and are more gifted than the boys, then the discriminatory investment in favour of the education of the boys is regarded as a bad allowance of the resources.
A fall of the GFI in Volves a fall (deceleration or slow down) of the growth of the population, thus causing a fall of the demographic dependency ratio, with positive consequences such as the rise of the national saving and the productive investments and thus of the economic growth. As Bloom et al. (2009) show, the fertility transition played a significant role in the explanation of the success of the economic growth of a panel of countries considered around the world. Nevertheless, it is important to note that the demographic dividend, like that obtained in this part of the Earth, is not automatic. Indeed, so that there is demographic dividend, it is necessary that the demographic no-claims bonus is accompanied by an improvement of the economic dependency ratio. But this can have perverse effects because in the long run, we could attend an ageing of the population. Bloom et al. (2009) thus come to consolidate the idea of the Asian Bank of Development which shows that the high growth of the population reduced by 0.7 percentage points the annual growth of the GDP per capita between 1965 and 1990. The advanced arguments do not apply only to the employment case, but also to that of self-employment as well in the agricultural sector as in the non agricultural sector (accessibility to the inputs, technologies and the resources) (Blackden et al., 2007). It is important however to note that the direct effect on the GFI is debatable and must consequently be relativized insofar as the GFI is almost rigid (it varies very slowly with the wire of time) and this degree of rigidity varies from one country to another according to the sociocultural characteristics.
The Talents Reduction Channel
Esteve-Volart (2009) develops a theoretical model making it possible to explore the economic implications of the gender inequalities in the labor market in a context where the economic agents are born with a random allowance of the entrepreneurial talent and decide the level of human capital to acquire and if it is necessary to become manager or worker/employee. According to his analysis, if the women are excluded from managerial positions (or spheres), then the equilibrium wages and the investment in the human capital at the same time for the employed men and the women will be reduced and the average talent of the managers will be consequently relatively low, which leads to less innovation. In addition, if the women are completely excluded from the labor force, then they can only engage in the domestic tasks, leading to a low productivity and a relatively low GDP per capita. But let us note all the same that this argumentation is somewhat simplistic in the sense that it does not take into account a certain number of significant size among which the optimal arbitration between the working time (out of home) and times allocated to the education of the children. Indeed, the formal school education of the young child should be supplemented by that which his/her parents inculcate to him/her.
The Femal human capital channel
As Klasen and Lamanna (2009) show it so well, the gap between men and women in employment, wages or in terms of poverty are due firstly to the differences in terms of human capital. they further show that there are interactions (relations in spiral) between the gender gaps in terms of educational level and the the gender gaps as regards employment. King et al. (2008) support the idea according to which the girls have a more higher marginal output in education than the boys. This result is opposite to that found by Barro and Sala-I-Martin (2003) who show that the education of the girls has a negative effect. That result, as showed thereafter considerable authors, remains debatable insofar as the models having made it possible to obtain this result, present problems of multicollinearity and endogeneity. These results divergences can also be due inter alia to the differences in periods, the way of apprehending the human capital (Number of schooling years of the adult population and educational level)
According to the World Bank report (2011), the costs of the gender gap are high insofar as they reduce not only the wellbeing of the women, but also that of the men and slow down the economic growth. Indeed, the rise of the gap in education has as a consequence a relative fall of the female human capital, negatively impacting the quality of children care thus their physical health which could be reflected in the long run on their productivity. For Cuberes and Teignier (2014) discrimination on the labor market causes inefficient allowance of inputs and losses of productions), this point of view is shared by Blackden et al. (2006) who shows that the gender gaps affect the economic growth in the sense that they present a negative impact on the assets accumulation and the productivity of the factors. For him, the Inequalities in terms of education in Volve a weak exploitation of the talents, outcome to a situation where the marginal output of the education of the girls is higher than that of the boys. That reduces the potentialities of the following generation in terms of capacities to produce. They hence join Silva and Klasen (2021) who, in a much more explicit way, show that the gender gap in employment and wage is associated to a weak bargaining power of the woman in the household and thus a weak investment in education and health of the children.This has as a consequence a weak investment in new technologies.
The Women Empowerment
The gender differences in terms of behavior can influence consumption, and saving, and thus the economic performance. King et al. (2008) agree on the fact that the rise of both employment rate and wages of the women not only makes it possible to reduce the gender gap, but also contributes to increase the woman’s bargaining power within the household. This “social rise” has positive effects on the economic growth. Indeed, by giving more decision-making power to the women, one affects the total productivity insofar as the women seem to have a stronger preference for the goods and services which contribute to the improvement of the human capital of the children (education, nutrition, health), as well as for the saving, a small degree of aversion for the risk and a strong propensity to invest in the productive projects (Doepke, 2009).
Gender Issues and Quality of the Institutions
Authors such as Braunstein (2011) share the point of view of the World Bank arguing that the women are less incline with corruption. Thus, a reduction of the gender gap in the participation in a remunerated activity, and also in the spheres of decision, makes it possible to improve the gouvernance and thus, ceteris paribus, contributes to booster the economic growth. In the same way, Lopez-Claros (2020), show that the Gender Equality and Governance Index (GEGI) rankings for 2020 indicates a clear correlation between gender equality, economic prosperity, and inclusive leadership. Iceland ranks first in the world among the 158 countries included in the index, followed by Spain and Belgium. Canada (9) and New Zealand (16) are the only non-European countries to rank in the top 20. The high est-ranking country in East Asia is Taiwan (21), and Canada scores highest in the Americas.
It is also important to specify that our two indicators can be interdependent, supporting of this fact the developpement of a virtuous or vicious circle according to the initial impulse. An analysis of the opposite relation is thus prove also interesting.
Growth and gender gap
The effect of the GDP per capita on the observed gap could be better clarified by considering two elements, i.e. the income elasticity and the opportunity cost.
Explanation by the income elasticity
Doepke (2014) argues that the income elasticity of the number of children is lower than the income elasticity of the educational level received by the children. Consequently, there is an income threshold above which, in a given country, the fertility rate decreases whereas the investment on each child grows, thus leading to the demographic transition. The fall of fertility facilitates the insertion of the women on the labor market, thus contributing to reduce the difference between sexes in terms of participation in the remunerated economic activity.
Explanation by the Opportunity cost
The growth of the income causes a fall of fertility – because the positive effect of income is dominated by the negative effect of substitution by the growth of the opportunity cost due to the fact of having additional children -, which in Volves a fall of the gender gap in the participation in a paid activity. In the same way, Cavalcanti and Tavares (2008) argue that the economic growth increases the opportunity cost of the women to remain at the house. But it is important to note that this last advanced argument remains debatable insofar as it would be necessary that this growth be reflected on the purchasing power of each economic agent or household or by a generalized raise of the labor cost, or by the creation of new remunerated employment opportunities. Another argument focused on the opportunity cost is that of Greenwood, Seshadri and Yorukoglu (2005). According to them, technological progress that the economic growth generates causes the increasing use of the goods with low intensity of labor (mechanization of the domestic tasks), in Volving the reduction of the gender gap observed in the participation in the paid activity out of the household.
Lagerlöf (2003) as for him, bases its analysis on the following assumptions: the two sexes have the same preferences and the same capacities, but can be given differently from education or human capital by their parents. He supposes moreover the same wages and level of capital for the two sexes. On the basis of the Overlapping Generation Model, it shows that the reduction of the gap in terms of human capital in Volves a rise in the cost of time among women, causing a substitution of the quality of the children to their quantity. He joined in that Greenwood, Seshadri and Yorukoglu (2005) which are further also showing the negative impact of this initial fall of the gap within the couple in terms of human capital on the gender gap between children as regards education.
It is also important to note that the “gender and development” approach dissociates those mentioned above insofar as for the latter, the inequalities between men and women could not be explained by aggregates such as the GDP, but are rather worked by provisions governing the institutions such as the family and patriarchal structures or the discriminatory practices (stereotype), point of view shared by Duflo (2010).
METHODOLOGY
The Model
Let’s consider the following Douglas Cobb model with constant return to scale (degree equal to 1):
$$Y_t = K_t^\alpha E_{mt}^{\beta_m} E_{ft}^{\beta_f} X_{mt}^{\gamma_m} X_{ft}^{\gamma_f} (A_t L_t)^{1-\alpha-\beta_m-\beta_f-\gamma_m-\gamma_f}$$
where \( K_t \) is the physical stock of capital, \( E_{mt} \) and \( E_{ft} \) respectively represent the levels of education of the men and the women, \( X_{mt} \) and \( X_{ft} \) respectively represent the indicators relating to the level of health of the men and the women, \( A_t L_t \) effective labor.
\( \alpha, \beta_m, \beta_f, \gamma_m \) and \( \gamma_f \) are respective elasticities of the output to the variations of the physical stock of capital, of the levels of education for men and women, and the indicators relating to the mean level of health of the men and the women.
From the first expression, one can derive the following expression of product per unit of \( A_t L_t \):
$$\frac{Y_t}{A_t L_t} = y_t = k_t^\alpha e_{mt}^{\beta_m} e_{ft}^{\beta_f} x_{mt}^{\gamma_m} x_{ft}^{\gamma_f}$$
where:
- $$k_t = \frac{K_t}{A_t L_t}$$
- $$e_{mt} = \frac{E_{mt}}{A_t L_t}$$
- $$e_{ft} = \frac{E_{ft}}{A_t L_t}$$
- $$x_{mt} = \frac{X_{mt}}{A_t L_t}$$
- $$x_{ft} = \frac{X_{ft}}{A_t L_t}$$
Considering the balanced growth path conditions and linearizing enables us to obtain the following expression:
$$\log y_t^* = \frac{-\alpha}{1-\alpha}\log(\delta + g + n) + \frac{\alpha}{1-\alpha}\log s_k + \frac{\beta_m}{1-\alpha}\log e_{mt}^* + \frac{\beta_f}{1-\alpha}\log e_{ft}^* + \frac{\gamma_m}{1-\alpha}\log x_{mt}^* + \frac{\gamma_f}{1-\alpha}\log x_{ft}^*$$
\(\delta\), \(g\), and \(n\) are respectively the physical and human capital depreciation rates, the technical progress rate, and the output growth rate (it is supposed that the labor grows at the same rate as the population).
\(s_k\) indicates the rate of investment in physical capital.
The third equation can again be written in the following form:
$$\log y_t^* = \frac{-\alpha}{1-\alpha}\log(\delta + g + n) – \log s_k + \frac{\beta_m}{1-\alpha}\log e_{mt}^* + \frac{\beta_f}{1-\alpha}\log e_{ft}^* + \frac{\gamma_m}{1-\alpha}\log x_{mt}^* + \frac{\gamma_f}{1-\alpha}\log x_{ft}^*$$
From where the expression of the product per capita in the following logarithmic form:
$$\log \frac{Y_t}{L_t^*} = \log A_0 + g t – \frac{\alpha}{1-\alpha}\log(\delta + g + n) – \log s_k + \frac{\beta_m}{1-\alpha}\log e_{mt}^* + \frac{\beta_f}{1-\alpha}\log e_{ft}^* + \frac{\gamma_m}{1-\alpha}\log x_{mt}^* + \frac{\gamma_f}{1-\alpha}\log x_{ft}^*$$
This expression can still be rewritten in the following form:
$$\log \frac{Y_t}{L_t^*} = \log A_0 + g t – \frac{\alpha}{1-\alpha}\log(\delta + g + n) – \log s_k + \frac{\beta_m + \beta_f}{1-\alpha}\log e_{mt}^* + \frac{\gamma_m + \gamma_f}{1-\alpha}\log x_{mt}^* + \log \frac{e_{ft}^*}{e_{mt}^*}^{\frac{\beta_f}{1-\alpha}} \cdot \frac{x_{ft}^*}{x_{mt}^*}^{\frac{\gamma_f}{1-\alpha}}$$
\(\frac{e_{ft}^*}{e_{mt}^*}\) and \(\frac{x_{ft}^*}{x_{mt}^*}\) can be considered as being respectively women/men parity indices in terms of level of education and health insofar as the proportions of the male and female populations are almost identical. Also taking into account the fact that gender parity as regards participation in a remunerated economic activity is a function of these two indices one can write:
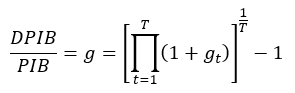
$$\log \frac{e_{ft}^*}{e_{mt}^*}^{\frac{\beta_f}{1-\alpha}} \cdot \frac{x_{ft}^*}{x_{mt}^*}^{\frac{\gamma_f}{1-\alpha}} = B \log p_t^* + \epsilon_t$$
where \(p\) represents the women/men parity index in terms of participation in a paid activity, and \(B > 0\).
To simplify we suppose that the term:
$$\log A_0 + g t – \frac{\alpha}{1-\alpha}\log(\delta + g + n) – \log s_k$$
is a constant represented by \(A\). We obtain as follows:
$$\log \frac{Y_t}{L_t^*} = A + B \log p_t^* + C \log e_{mt}^* + D \log x_{mt}^* + \epsilon_t$$
with \(C = \frac{\beta_m + \beta_f}{1-\alpha}\) and \(D = \frac{\gamma_m + \gamma_f}{1-\alpha}\). \(\epsilon\) represents the error term which is a white noise. We add to it a set of other variables known as control variables.
The Data
The data we use are provided by the World Bank over the period 1990-2016 for the six (06) CEMAC countries. As the dependent variable, we have the growth rate of the GDP expressed per head in constant FCFA noted \(DYY\).
The explanatory variables are:
– The Napierian logarithm female/male parity index expressed as a percentage noted LOGIP;
– The mean level of health within the male population: as a proxy of this indicator, we have the life expectancy at birth for the men that we express in Napierian logarithm, noted LOGESP;
– The Napierian logarithm of the money supply (Aggregate M2) noted LOGM2 to apprehend the nature of the link between real sphere and monetary sphere;
– The Napierian logarithm of the gross formation of fixed physical capital noted LOGFBCF;
– The Napierian logarithm of the exchange rate FCFA/USD noted LOGCHGE to take into account the impact of the shocks concerned with the external environment;
Let us note, however, the lack of data relating to the educational level.
Given that we propose to carry out a panel data analysis (balanced panel), our model takes the following form:
$$\log \frac{Y_{it}}{L_{it}} = \Lambda_{it}’ \Gamma + \epsilon_{it}$$
with \(\Lambda\) the vector of the explanatory variables and \(\Gamma\) the vector of parameters to be estimated; \(i\) indicates the country.
RESULTS AND DISCUSSION
Results of the unit root and cointegration tests
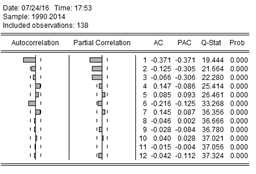
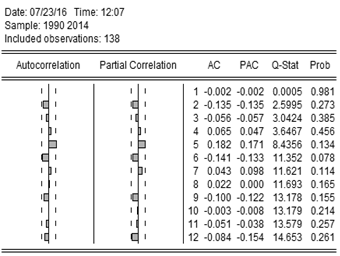
Table 1 shows the results of the various unit root tests on panel data. We can notice that all these data are I(1). It is important to note that in spite of the results of the test statistics which show that the growth rate of the GDP per capita is stationary in level, the correlogram indicates that it is not the case (see figures 8 and 9). To eliminate these divergences, we had to differentiate it once.
The Pedroni cointegration test enables us to conclude in favour of the presence of cointegration between all the variables (see Table 7).
Results of the regression
The model, after estimating the parameters, is as follows:
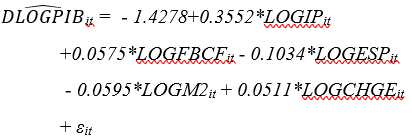
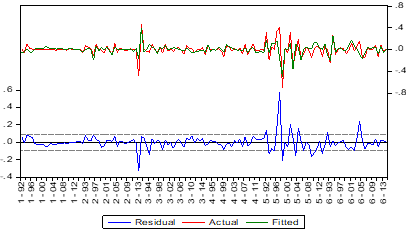
This random effects model (see Table 8) is stable in the long run (see correlogram, Figure 1) and globally significant at the level of 1% it to explains 37% of the variations of the growth rate of the real GDP per capita (see Table 2). ¶In addition, the value of Durbin-Watson shows that the regression is not fallacious.
The values of VIF (Variance inflating factor) (see Table 3) reveal that the collinearity between the explanatory variables is negligible, which leads us to conclude in favour of the absence of multi collinearity.
Discussion of the estimation results
According to the test of Student, the gender parity index is significant at the level of 5% while gross fixed capital formation (GFCF) and the money supply are significant the the level of 1%. The exchange rate FCFA/USD and the life expectancy at birth, as for them, are non significant.
The model estimation results also show that the gender parity index in terms of participation in remunerated economic activity and the GFCF have a positive effect on the growth rate. These results are conform with the theoretical predictions and empirically were also shown by authors such as Cuberes and Teignier (2014).
On the theoretical level, it is important to note that the authors such as Braunstein (2011), Agénor (2012) and Kim, Lee and Shin (2016) agree on the fact that the gender gap in participation in the remunerated activity reduces the capacities of the whole of the effective workers in terms of potentialities and innovating force necessary to the production of the wealth. Discrimination against women and gender inequality also tend to increase the gross fertility index, cause a drop in the investments in human capital of the following generation, and thus limiting the growth of household’s productivity and causing by this fact a fall of the growth rate of the income per capita.
As regards the gross fixed capital formation which measuring the private investment, it is allowed that it has the greatest part in terms of contribution to the increase in the stock of the physical capital which is a significant factor of production. Let us note moreover that the GFCF can also act indirectly on the economic growth by the intermediary of the human capital, as shown as well theoretically as empirically by authors like, Agénor, Canuto and Da Silva (2010) and Kim, Lee and Shin (2016).
The results of the estimation show in addition that the money supply has rather a negative impact on the growth of the GDP per capita. One could think that it is about a contra-intuitive result, but this can find an explanation in the economic theory in the sense that it is about a long run impact. An exogenous rise of the liquidity causes a short run rise of the consumers’ purchasing power, in Volving by this fact a rise of the aggregate demand on the market of goods and services. This can generate an inflationary pressure if the aggregate supply moves more slowly than the demand. To cover himself against this rise of the inflation rate, the capital holders, as an homo eoconomicus agent, will make increase the nominal interest rate with an aim of maintaining at least constant the real interest rate. This rise of the nominal interest rate will cause a fall of the future investments, significant motor of economic growth.
Gender parity Index and economic growth: Mechanisms of action
The mechanisms of action of the explanatory variables on the economic growth rate are given using the step-by-step model which consists starting from a “root model” M1 linking the dependent variable to the principal explanatory variable and to include in a progressive way the other explanatory variables. In our case, we have 5 models (see table 4) which are:
– M1 = Gender parity Index;
– M2 = M1 + Exchange rate FCFA/USD;
– M3 = M2 + Money supply;
– M4 = M3 + Life expectancy to the birth in the male population;
– M5 = M4 + Gross fixed capital formation.
The gender parity index becomes significant at the level of 5% only when one includes the GFCF (M5 model). The GFCF is consequently an inhibiting variable of the index of gender parity index. Thus, for the improvement of the gender parity index in terms of exercise of a remunerated economic activity to have a significant impact on the economic growth, one would need an implementation of accompanying measures concerning investments as shown by Agénor, Canuto and da Silva (2010). Those investments could be oriented/realized in particular in the field of the improvement of the human capital which occupies an important among the factors of the economic development.
Also let us note that the exchange rate FCFA/USD has a significant and positive impact at the levels of 5% in the models M2 and M3 and 1% in the model M4 the positive impact obtained is in conformity with the theoretical predictions insofar as a rise of the exchange rate, and thus a depreciation of the national currency, encourages exports, in Volving by this fact a rise of the currencies inflow and boosting rocket the economic growth. This impact becomes however non significant in the last model (M5 Model) with the inclusion of the GFCF. The latter constitutes consequently an intermediate variable by which the exchange rate acts on the economic growth. Knowing the dynamic of long term, it would also be important to have an idea with regard to the short term.
Analysis of the short-term dynamics: The error correction model (ECM)
Error Model Correction is used to jointly model the short term and long term dynamics. In our case, it is presented as follows:
DDLOGPIBit = β0 +β1*DLOGIPit + β2*DLOGFBCFit+ β3*DLOGESPit+ β4*DLOGM2it + β5*DLOGCHGEit + β6* it-1+υit
avec:
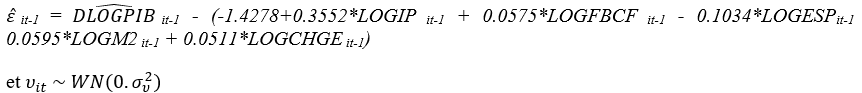
β6 is the coefficient or speed of adjustment of the growth rate of GDP around its long term growth path. It is also by this fact called “power of recall”. It must be negative insofar as when the growth rate DLOGPIB at period t-1 has suddenly deviated from its value
of steady balance given here by:
(-1.4278 , 0.3552 , 0.0575 , 0.1034 , 0.0595 , 0.0511)*(1 , LOGIP t-1 , LOGFBCF t-1 , LOGESPt-1 , LOGM2 t-1 , LOGCHGE t-1)’, a force inherent to the economic system must automatically bring back it to the long run path. The closer the adjustment coefficient is to -1, the more the adjustment is fast. Consequently, the sudden starts caused by a shock could not last a long time because of the high stabilizing force.
Table 5 presents the results of the estimation of the ECM. According to these results, the model makes explains 53.51% of the short-term variations of the growth rate of the GDP per capita. It is globally significant at the level of 1%, with a Durbin-Watson value equal to 2.03 testifying the absence of auto correlation of the residual. This value of Durbin-Watson thus comes to corroborate the stationnarity of the error term (see Figure 4). This is the proof of a good adjustment quality as Figure 3 shows it well. We also can notice that the effect of the force of recall is significant at the level of 5% with a coefficient equal to -0.88. Thus, it would take on average 14 months for the economies of the CEMAC zone return on their balanced path after a shock.
In the short run, the gender parity index has a negative effect on the economic growth contrary to the GFCF. This effect is significant at the level of 10%. This can be explained by the existence of a more or less long time necessary to perceive the impacts of an improvement of the gender aspects on the economic growth. GFCF, as for it, remains very significant even in the short run.
Estimation of the Sexo-Specific Growth Rate: A Comparative Analysis
The sexo-specific growth rate is that which corresponds to a situation of perfect equality of chances between men and women. In our study, this equality of chances relates to only the participation in a paid activity.
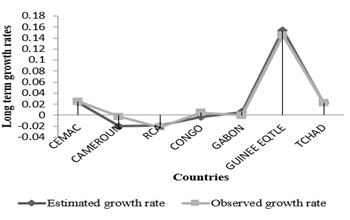
It proves to be important for any economy to have an idea about profits of performance which one would have carried out in the event of improvement of a certain number of indicators known as social among which the gender parity index as regards exercise of a remunerated activity, which is far from being negligible. This explains the particular interest of this analysis. But as a preliminary, it would be necessary to check the adequacy of our principal model estimated above. This checking is done by comparing for each country like for the group (zone CEMAC) the observed average growth rates and those estimated using the parameters estimated from the model over the period of study.
On Figure 5, we can observe that the curve of the average estimated growth rates tend to merge with that of the observed rates. We can thus consider the parameters of our model to estimate the average sexo-specific growth rates in order to deduce the profits in performance which the CEMAC zone economies would have obtained in the case of perfect equality of chances between men and women as regards participation in a paid economic activity, i.e. if the index of parity is equal to 1 or 100 (if it is expressed as a percentage as it is the case in our analysis).
Table 6 presents the benefits of performance which would have been obtained by the economies of zone CEMAC in the event of perfect equality of chances between men and women as regards participation in a paid activity. We can remark that the country which would have obtained the highest profit is Chad (+ 7.647%) followed by Gabon (+ 7.055%) while the least profit is observed in Congo (+ 2.783%).
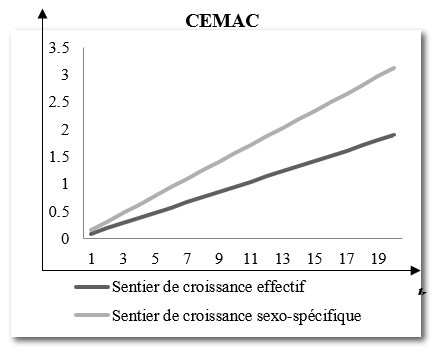
These estimates thus enable us to determine the slopes of the various observed and sexo-specific growth paths. From the slopes whose procedure of calculation is in Table 9, we draw the various economic growth paths for CEMAC zone in a global way and for each country. We can observe on figures 6 and 7 that the sexo-specific growth path is above the observed path.
CONCLUSION
In this paper, it was about the estimation of the impact on the economic growth rates in the CEMAC zone of the gender gap in terms of participation in paid economic activity. For that purpose, we carried out a panel data analysis after having elaborated a balanced growth model integrating the gender aspect. The results obtained show that the improvement of the woman/man parity index in the paid economic activity has a significant at 5% level and positive impact in the long run on the economic growth in the CEMAC zone. The step-by-step model enables us to notice that this impact is significant only if the improvement of the gender index is accompanied by a rise of the fixed capital gross formation. The parameters obtained from the regression enable us to estimate for each country of CEMAC zone the sexo-specific growth rates of the GDP per capita and thus the profits which would result from this in terms of economic performance and to plot for each country the sexo-specific growth paths. It comes out from this study that implementing policies aiming at reducing the existing gap between men and women in a paid activity would be beneficial for all the economies of the CEMAC zone in terms of economic performance. In a concrete way, it would be important to implement inciting measurements aiming at encouraging education and at reinforcing the profession nalization of the girl. It would be also interesting to carry out the sensitization of the populations in order to fight against the cultural norms advocating the sexual division of labor. These public awareness campaigns could relate in particular to the benefits, for the whole community, (and thus for an economy which wants to be strong) of a gender-equal participation in the economic life of a nation.
REFERENCES
- Aaronson, D., R. Dehejia, A. Jordan, C. Pop‐Eleches, C. Samii and K. Schulze (2018), “The Effect of Fertility on Mothers’ Labor Supply over the Last Two Centuries”, Center on Global Economic Governance, CDEP‐CGEG WP No. 68.
- Agénor, P-R. (2012), “A Computable OLG Model for Gender and Growth Policy Analysis,” Discussion Paper No. 169, Centre for Growth and Business Cycle Research, 50 p. http://www.socialsciences.manchester.ac.uk/cgbcr/discussionpapers/index.html.
- Agénor, P-R, O. Canuto and Luiz P. da Silva (2010), “On Gender and Growth the Role of Intergenerational Health Externalities and Women’s Occupational Constraints”, The World Bank Poverty Reduction and Economic Management Network, Policy Research Working Paper 5492, 50 p., Décembre.
- Bandiera, A. and A. Natraj (2013), “Does Gender Inequality Hinder Development and Economic Growth? Evidence and Policy Implications”, The World Bank Research Observer, Vol. 28, No 1, pp. 2-21.
- Barro R. and J. W. Lee (1996), “International Measures of Schooling Years and Schooling Quality”, American Economic Review, No 86, pp. 218-223.
- Barro, R. and X. Sala-I-Martin (2003), Economic Growth, 2nd edition. The MIT Press, Cambridge.
- Becker, G. S. (1981), A Treatise on the Family, Cambridge, MA: Harvard University Press.
- Becker, G. S. and H. G. Lewis (1973), “On the interaction between the quantity and quality of children”, Journal of Political Economy, No 81, pp. 279-288.
- Besley, T. and R. Burgess (2004), “Can Labor Regulation Hinder Economic Performance? Evidence from India”. The Quarterly Journal of Economics, No 119 pp. 91-134.
- Blackden, C. Mark and C. Bhanu (1999), “Gender, Growth, and Poverty Reduction: Special Program of Assistance for Africa”, 1998 Status Report on Poverty in Sub-Saharan Africa, World Bank Technical Paper No. 428.
- Blackden, C. Mark, S. Canagarajah, S. Klasen, and D. Lawson (2006) “Gender and Growth in Sub-Saharan Africa: Issues and Evidence,” Research Paper No. 2006/37, UNU-Wider, Avril.
- Bloom, E. David., D. Canning, G. Fink and Jocelyn E. Finlay (2009), « Fertility, female labor force participation, and the demographic dividend », Journal of Economic Growth, No. 14, pp. 79-101, DOI 10.1007/sl0887-009-9039-9.
- Boserup, E. (1970), Woman’s Role in Economic Development. Earthscan Publications, London.
- Braunstein, E. (2008), “The Feminist Political Economy of the Rent-Seeking Society: An Investigation of Gender Inequality and Economic Growth”, Journal of Economic Issues, No 42, pp. 959-979.
- Braunstein, E. (2011), “Gender Equality and Economic Growth,” Fe Dergi, Vol. 3, No 2, pp. 54-67. URL: http://cins.ankara.edu.tr/6_5.html.
- Busse, M., and C. Spielmann (2006), “Gender Inequality and Trade”, Review of International Economics, Vol. 14, No 3. pp. 362–79.
- Cavalcanti, T. V. D. V., and J. Tavares (2008), “The Output Cost of Gender Discrimination: A Model-Based Macroeconomic Estimate”, Proceedings of the German Development Economics Conference, Zürich 2008, No 43.
- Cuberes, D., and M. Teignier, (2014), “Gender Inequality and Economic Growth: A Critical Review”, Journal of International Development, Vol. 26 No2, pp. 260-276.
- Daly, K. (2007): “Gender Inequality, Growth and Global Ageing”, Society of Business Economist Journal, Vol. 38, No 1.
- Del Rey, E., A. Kyriacou, and J.I. Silva (2021), « Maternity leave and female labor force participation: evidence from 159 countries ». Journal of Population Econoùmics No. 34, pp. 803–824. https://doi.org/10.1007/s00148-020-00806-1.
- Desvaux, G., S. Devillard, and P. Baumgarten (2007), “Women Matter: la Mixité Levier de Performance de L’entreprise” Paris, France: McKinsey & Company. (http://www.mckinsey.com/ locations/paris/ home/women matter/pdfs/Women matter oct2007 english.pdf).
- Doepke, M. (2014), “Gary Becker on the Quantity and Quality of Children”, IZA DP No. 8610.
- Doepke, M. and M. Tertilt (2009), “Women’s liberation: What’s in it for men?”, Quarterly Journal of Economics, Vol. 124, No 4, pp. 1541-1591.
- Duflo, E. (2005) “Gender Equality in Development”, Non publié, Massachusetts Institute of Technology.
- Duflo, E. (2010), “Gender inequality and development?” ABCDE Conference, Stockholm, Mai.
- Esteve-Volart, Berta. (2009), “Gender Discrimination and Growth: Theory and Evidence from India,” Development Economics Papers Discussion, http://dept.econ.yorku.ca/~berta/disc-january2009.pdf.
- Greenwood, J., A. Seshadri, and M. Yorukoglu (2005), “Engines of Liberation”. Review of Economic Studies, Vol. 72, No 1. pp. 109–33.
- Gümbel, D. (2004). The Influence of Gender Inequality on Economic Growth. Hausarbeit im Rahmen des Haupte seminars Okonomie des Geschlechterverhaltens in der Geschichte von Prof. Dr. Batten im SS.
- Kim, J., J-W. Lee, and K. Shin (2016), “A Model of Gender Inequality and Economic Growth”, ADB working paper series No, 475, Février.
- Klasen, S. et F. Lamanna (2009). “The Impact of Gender Inequality in Education and Employment on Economic Growth: New Evidence for a Panel of Countries”, Feminist Economics, Vol. 15, No 3 pp. 91-132.
- Lagerlöf, N-P. (2003) “Gender Equality and Long-Run Growth”, Journal of Economic Growth, No 8, Décembre, pp. 403-26.
- Letablier, M. T., A. Luci, A. Math, and O. Thévenon (2009), “The Costs of Raising Children and the Effectiveness of Policies to Support Parenthood in European Countries: A Literature”, INED Working Paper 158. (http://europa.eu/epic/docs/eu report cost of children final 11-05-2009.pdf).
- Lopez-Claros, A., A. Ellis and R. Halperin-Kaddari (2020), The Gender Equality and Governance Index: Empowering Women for the Prosperity of Nations, Global Governance Forum.
- Lopez-Claros, A. and S. Zahidi. (2005). “Women’s Empowerment: Measuring the Global Gender Gap”, World Economic Forum.
- (http://www.unece.org/fileadmin/DAM/stats/gender/publications/MultiCountry/WomenEmpowerment. pdf).
- Milovanović, M. (2023). “The Relationship between Fertility and Female Participation in the Labour Force in OECD Countries 2000–2020: It Is (Again) Negative”, Central European Economic Journal, Vol. 10, No. 57, pp. 254-274. DOI: 10.2478/ceej-2023-0015.
- Pissarides, C. (2006), “Lisbon Five Years Later: What Future for European Employment and Growth?”, Keynote address delivered at the Austrian Presidency Conference on Innovations in Labor Market Policies: Challenges in Times of Globalisation.
- Quisumbing, Agnes R. (2003), “What Have We Learned from Research on Intrahousehold Allocation?” In Agnes R. Quisumbing (ed) Household Decisions, Gender and Development: A Synthesis of Recent Research, pp. 1-16, Washington, D.C.: International Food Policy Research Institute.
- Silva, M. Santos and S. Klasen, (2021), “Gender inequality as a barrier to economic growth: a review of the theoretical literature,” Review of Economics of the Household, Springer, Vol. 19, No. 3, pp. 581-614. DOI: 10.1007/s11150-020-09535-6.
♦♦♦
APPENDIX
Tables
Table 1: Results of the unit root tests
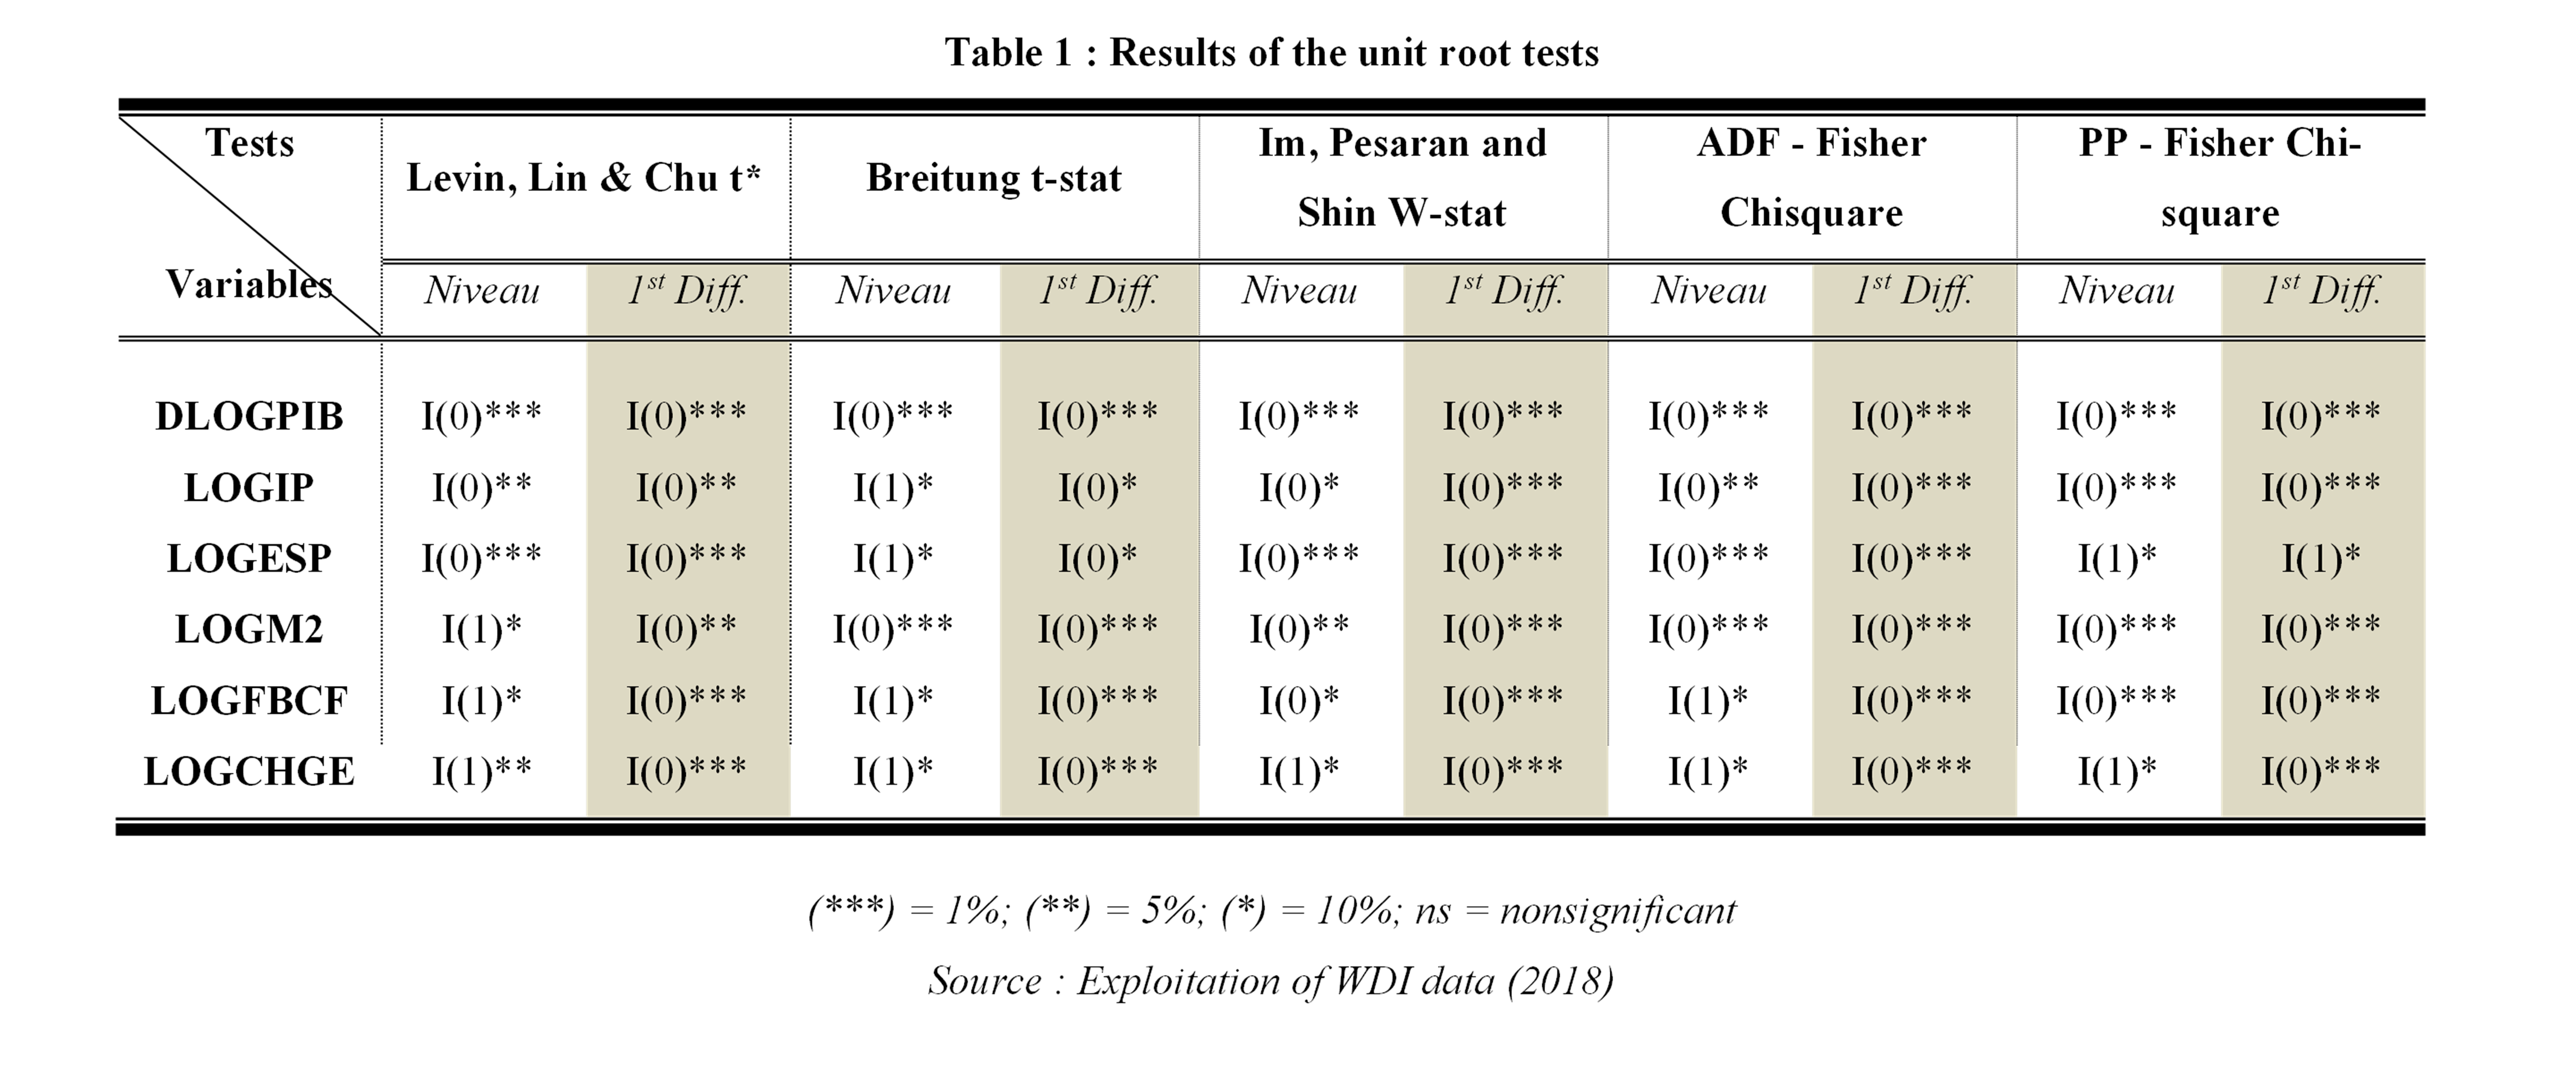
(***) = 1%; (**) = 5%; (*) = 10%; ns = nonsignificant
Source : Exploitation of WDI data (2018)
Table 2: Results of the estimation of the model
| Dependent Variable: DLOGPIB | ||||
| Method: Panel EGLS (Cross-section random effects) | ||||
| Swamy and Arora estimator of component variances | ||||
| Variable | Coefficient | Std. Error | t-Statistic | Prob. |
| LOGIP | 0.355239 | 0.173132 | 2.051840 | 0.0421 |
| LOGFBCF | 0.057469 | 0.009180 | 6.260456 | 0.0000 |
| LOGESP | -0.103412 | 0.123973 | -0.834146 | 0.4056 |
| LOGM2 | -0.059493 | 0.007906 | -7.525453 | 0.0000 |
| LOGCHGE | 0.051053 | 0.034621 | 1.474597 | 0.1426 |
| C | -1.427837 | 0.693828 | -2.057912 | 0.0415 |
| Effects Specification | ||||
| S.D. | Rho | |||
| Cross-section random | 0.000000 | 0.0000 | ||
| Idiosyncratic random | 0.094907 | 1.0000 | ||
| Weighted Statistics | ||||
| R-squared | 0.370083 | Mean dependent var | 0.025650 | |
| Adjusted R-squared | 0.347260 | S.D. dependent var | 0.117950 | |
| S.E. of regression | 0.095294 | Sum squared resid | 1.253179 | |
| F-statistic | 16.21527 | Durbin-Watson stat | 1.700945 | |
| Prob(F-statistic) | 0.000000 | |||
Table 3 : Multicollinearity test Results
| Variance Inflation Factors | |||
| Coefficient | Uncentered | Centered | |
| Variable | Variance | VIF | VIF |
| LOGIP | 0.029975 | 9409.016 | 1.290292 |
| LOGFBCF | 8.43E-05 | 974.7623 | 2.486937 |
| LOGESP | 0.015369 | 3814.477 | 2.587027 |
| LOGM2 | 6.25E-05 | 701.6319 | 1.993549 |
| LOGCHGE | 0.001199 | 741.0528 | 1.273520 |
| C | 0.481398 | 7696.050 | NA |
Table 4: Step-by-step model
| Variables | Gross effects | Net effects | ||||
| M0 | M1 | M2 | M3 | M4 | M5 | |
| LOGIP | 0.1968[ns] | 0.1968[ns] | -0.0257[ns] | 0.3233[ns] | 0.2346[ns] | 0.3552** |
| LOGCHGE | 0.0780** | 0.0790** | 0.0907** | 0.1146*** | 0.0511[ns] | |
| LOGM2 | -0.0229*** | -0.0301*** | -0.0439*** | -0.0595*** | ||
| LOGESP | -0.3077* | 0.4073[ns] | -0.1034[ns] | |||
| LOGFBCF | 0.0032[ns] | 0.0575*** | ||||
| R² | 0.0034 | 0.0362 | 0.1236 | 0.1373 | 0.3701 | |
| ΔR² | 0.0034 | 0.0328 | 0.0874 | 0.0137 | 0.2328 | |
| DW stat | 1.3931 | 1.4169 | 1.5831 | 1.6154 | 1.7009 | |
| Prob (F-stat) | 0.4862 | 0.0743 | 0.0003 | 0.0004 | 0.0000 | |
| Nombre d’observations | 144 | 144 | 144 | 144 | 144 | |
(***) = 1% ; (**) = 5% ; (*) = 10%; ns = non significatif.
Source : Exploitation of WDI data (2018)
Table 5: Results of the estimation of the ECM
| Dependent Variable: DDLOGPIB | ||||
| Method: Panel Least Squares | ||||
| Cross-sections included: 6 | ||||
| Total panel (balanced) observations: 138 | ||||
| Variable | Coefficient | Std. Error | t-Statistic | Prob. |
| DLOGIP | -3.459095 | 1.766272 | -1.958416 | 0.0524 |
| DLOGFBCF | 0.150919 | 0.031088 | 4.854550 | 0.0000 |
| DLOGESP | -0.474415 | 1.263883 | -0.375363 | 0.7080 |
| DLOGM2 | -0.057773 | 0.053470 | -1.080477 | 0.2820 |
| DLOGCHGE | 0.018925 | 0.055982 | 0.338054 | 0.7359 |
| RESID01(-1) | -0.881328 | 0.081897 | -10.76148 | 0.0000 |
| C | 0.005869 | 0.013596 | 0.431680 | 0.6667 |
| Effects Specification | ||||
| Cross-section fixed (dummy variables) | ||||
| R-squared | 0.535087 | Mean dependent var | 0.001097 | |
| Adjusted R-squared | 0.494499 | S.D. dependent var | 0.125420 | |
| S.E. of regression | 0.089172 | Akaike info criterion | -1.913562 | |
| Sum squared resid | 1.001903 | Schwarz criterion | -1.659019 | |
| Log likelihood | 144.0358 | Hannan-Quinn criter. | -1.810122 | |
| F-statistic | 13.18347 | Durbin-Watson stat | 2.029255 | |
| Prob(F-statistic) | 0.000000 | |||
Table 6: Observed growth rate, estimated sexo-specific growth rate and estimated benefits en terms of economic growth
| Pays | Taux de croissance observé (g) | Taux de croissance sexo-spécifique estimé (g*) | Gain estimé en termes de croissance (g* – g) |
| CEMAC | 0.02461 | 0.08588 | 0.06126 |
| CAMEROUN | -0.00274 | 0.06204 | 0.06479 |
| RCA | -0.02160 | 0.04736 | 0.06897 |
| CONGO | 0.00456 | 0.03239 | 0.02783 |
| GABON | -0.00044 | 0.07010 | 0.07055 |
| GUINÉE EQTLE | 0.14552 | 0.20449 | 0.05897 |
| TCHAD | 0.02240 | 0.09886 | 0.07647 |
Source : Exploitation of WDI data (2018)
Note: g and g* are the geométric averages of the observed and estimated sexo-specific annual growth rates respectively.
with the growth rate corresponding to the year t and T = 25. This procedure is the than that of g*. It is important to recall that for each country, the series g*t is generated using the parameters of the estimated model.
For the case of the CEMAC zone, we use the simple arithmetic average of the rates of the six (06) countries.
Table 7: Result of the Pedroni cointegration test
| Pedroni Residual Cointegration Test | ||||||||
| Series: DLOGPIB LOGIP LOGFBCF LOGESP LOGM2 LOGCHGE | ||||||||
| Cross-sections included: 6 | ||||||||
| Null Hypothesis: No cointegration | ||||||||
| Trend assumption: No deterministic trend | ||||||||
| Automatic lag length selection based on SIC with a max lag of 3 | ||||||||
| Newey-West automatic bandwidth selection and Bartlett kernel | ||||||||
| Alternative hypothesis: common AR coefs. (within-dimension) | ||||||||
| Weighted | ||||||||
| Statistic | Prob. | Statistic | Prob. | |||||
| Panel v-Statistic | -2.199536 | 0.9861 | -2.293648 | 0.9891 | ||||
| Panel rho-Statistic | 0.838385 | 0.7991 | 0.888399 | 0.8128 | ||||
| Panel PP-Statistic | -11.47221 | 0.0000 | -8.646182 | 0.0000 | ||||
| Panel ADF-Statistic | -5.814295 | 0.0000 | -5.612600 | 0.0000 | ||||
| Alternative hypothesis: individual AR coefs. (between-dimension) | ||||||||
| Statistic | Prob. | |||||||
| Group rho-Statistic | 1.528267 | 0.9368 | ||||||
| Group PP-Statistic | -13.41042 | 0.0000 | ||||||
| Group ADF-Statistic | -6.943629 | 0.0000 | ||||||
Table 8: Results of the Hausman specification test
| Test Summary | Chi-Sq. Statistic | Chi-Sq. d.f. | Prob. |
| Cross-section random | 0.0000 | 5 | 1.0000 |
The model is thus a random effect model
Table 9: Slopes of the growth paths
| n | δ | g | g* | Pente du sentier de croissance effectif (n+g+δ) | Pente du sentier de croissance sexo-spécifique (n+g*+δ) | |
| CEMAC | 0.025254 | 0.045 | 0.024614 | 0.085876 | 0.094869 | 0.15613 |
| Cameroon | 0.027109 | 0.045 | -0.00274 | 0.062045 | 0.069364 | 0.134153 |
| RCA | 0.021713 | 0.045 | -0.0216 | 0.047364 | 0.04511 | 0.114077 |
| Congo | 0.027964 | 0.045 | 0.004557 | 0.032388 | 0.077521 | 0.105352 |
| Gabon | 0.02157 | 0.045 | -0.00044 | 0.070105 | 0.066129 | 0.136675 |
| Equatorial Guinea | 0.024733 | 0.045 | 0.14552 | 0.20449 | 0.215254 | 0.274223 |
| Chad | 0.028437 | 0.045 | 0.022398 | 0.098864 | 0.095835 | 0.172301 |
Note: The depreciation rate δ is assumed to be equal to 4.5% for all countries. n is the average annual demographic growth rate obtened using the following formula:
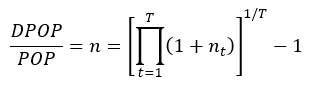
where nt is given by DPOPt/POPt-1 . The series nt is generated from data on the number of inhabitants provided the WDI 2018.
T = 54.
Figures
Figure 1: Correlogram of the long term model’s residual
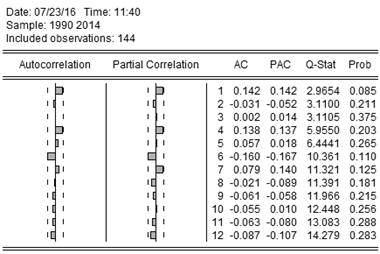
Source: Exploitation of WDI data (2018)
Figure 2: empirical Adjustement of the model to the observed variations of the GDP per capita
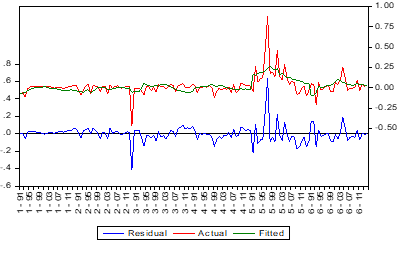
Source: Exploitation of WDI data (2018)
Figure 3: Empirical adjustement of the ECM to the observed variations
Source: Exploitation of WDI data (2018)
Figure 4: Correlogram of the error term of the MCE
Source: Exploitation of WDI data (2018)
Figure 5: observed and estimated growth rate of the GDP per capita
Source: Exploitation of WDI data (2018)
Figure 6: observed and sexo-specific growth paths of the CEMAC zone
Source: Exploitation of WDI data (2018)
Figure 7: observed and sexo-specific growth paths for each countries
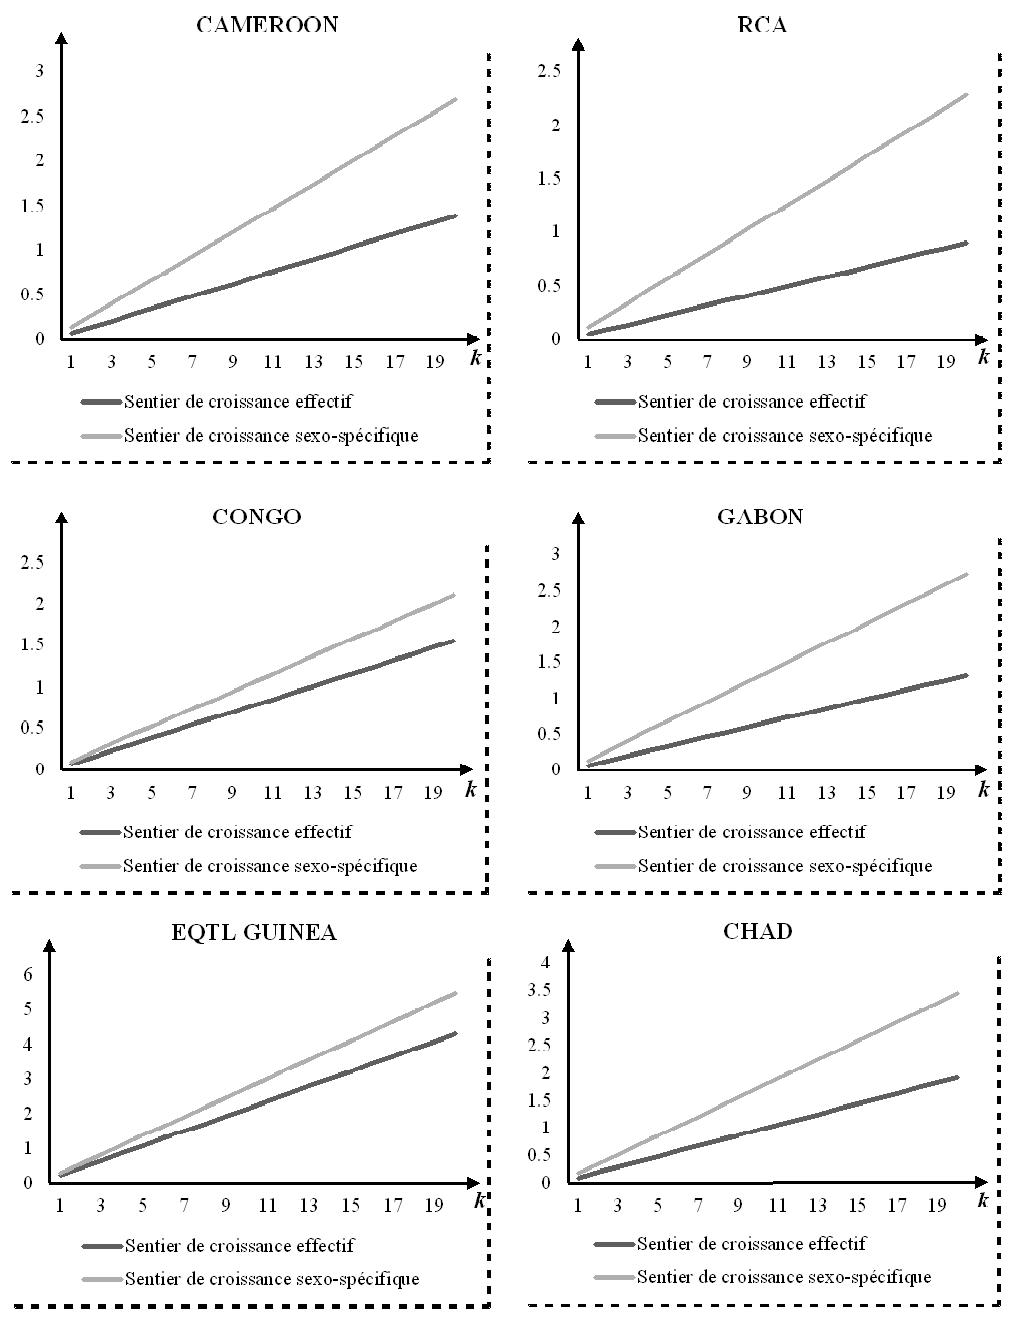
Figure 8: Correlogramme of the GDP per capita growth rate (in level)
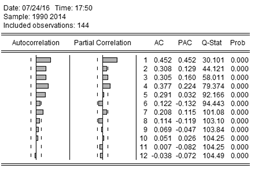
Figure 9: Correlogramme of the per capita growth rate (in 1st difference)