
Impact Evaluation of Livelihood Program (DILP) in Tigaon, Camarines Sur
- Cosejo, Gigi
- 152-214
- Feb 25, 2025
- Education
Impact Evaluation of Livelihood Program (DILP) in Tigaon, Camarines Sur
*Cosejo, Gigi
Partido State University, Camarines Sur, Philippines
San Rafael National High School, Camarines Sur, Philippines
DOI: https://dx.doi.org/10.47772/IJRISS.2025.915EC0012
Received: 08 January 2025; Accepted: 23 January 2025; Published: 25 February 2025
ABSTRACT
The Philippine government has been implementing initiatives for the poorest sectors by designing interventions for livelihood and employment that reduce poverty. Hunclear whether the use of government resources for this pro-poor initiative has achieved the intended outcome using the commonest measures of effectiveness and impacts to justify the use of public funds. This paper discussed the evaluation of the impacts of the Department of Labor and Employment Integrated Livelihood Program (DILP) in Tigaon on a range of socioeconomic and institutional outcome indicators. A quasi-experimental research design was adapted to quantify the changes in the project impact indicators before and after the project. It employed a total enumeration of the project beneficiaries’ respondents. The data were generated using questionnaires. Results showed that the implemented program generated small profits, create jobs for the household members, and produced positive intermediate outcomes on the beneficiaries’ knowledge, skills, and attitude. The study recommends additional financial support should be part of the livelihood support package to ensure sustainability against unforeseen events that could cause disruptions or losses on these livelihood projects.
Keywords: impact evaluation, livelihood program, socioeconomic condition, intermediate outcomes
THE PROBLEM
Background of the Study
Many projects implemented by the government do not have an impact evaluation study to justify the use of public funds. The Philippine government has been implementing initiatives for livelihood to reduce poverty and need to evaluate them to justify the use of public funds becomes imperative and compelling. (Acosta et al.,2018).
Livelihood assistance helps bring out rural communities from the poverty trap and improve their socioeconomic life (Dawood et al.,2016). However, it is unclear whether the use of government resources for pro-poor programs has been properly accounted for using the commonest measures of effectiveness and impact. The absence of this vital information is critical to the sustained infusion of support by a government entity such as a local government unit where resources are limited and many concerns contend for the use of these scarce resources.
The national government’s essential role is to lead and pitch the local government to contribute to national development. The devolved powers and authority granted to local government units give them opportunities and inspiration to develop abilities to sustain the needs of their constituents.
In pursuing this critical task, national agencies assist the local government in attaining its objective. One of these, is the Department of Labor and Employment (DOLE). The DOLE is a national agency tasked with developing strategies, implementing programs, and carrying out initiatives in labor and employment that are in line with the government’s policy of inclusive growth in both formal and informal economies. The livelihood program mandates to foster gainful jobs, humane working conditions, and industrial peace to ensure equitable protection of rights. This intervention is a grant assistance program for capacity building in marginalized sectors for groups and individuals. The working starter in setting up a business solely given are equipment, tools, materials, training on business planning and operation, social security, and continuing technical and business advisory service.
The accredited co-partner scheme of the guidelines in the implementation of DOLE Integrated Livelihood Program (DILP) put the local government unit at the forefront of addressing poverty in the municipality as co-implementers of this program. The program also provides capacity-building and grant assistance to the local government.
Under this program, the local government of Tigaon implemented a memorandum of agreement with Department of Social Welfare and Development as Department of Labor and Employment. The livelihood program aimed to develop poor household members’ entrepreneurial, and technical skills to enable them to manage their business ventures and access jobs. The target beneficiaries were the working-age members of poor households and were assessed through the National Housing Targeting System or Listahan for Microenterprise Track.
Despite, the completion of this implemented livelihood project, the assessments of impact have not been conducted. The results from these impact assessments could help improve the delivery of program services and enhance the capacity of field personnel in both tracks, and the program guidelines in the future by learning from the processes and outcomes.
This study evaluated the impact of the implemented DOLE Integrated Livelihood Program (DILP) in Tigaon, Camarines Sur, Philippines to draw a conclusion and establish robust evidence that can be used in justifying the use of public funds in the context of the value for money principles or return on investment.
Research Objectives
This study generally aimed to evaluate the impact of the implemented DOLE Integrated Livelihood Program (DILP) in Tigaon, Camarines Sur, Philippines. The study aimed to achieve the following specific objectives
Determine the demographic profile of the beneficiary after the livelihood program in terms of:
Age
Sex
Civil Status
Number of Children
Educational attainment
Employment status
Nature of employment
Class of worker
Determine the economic characteristics of the beneficiary after the livelihood program in terms of:
Nature of industry employed
Household ownership
Housing type
Construction materials
Main source of water
Main source of electricity
Household assets owned
Access to insurance
Social Services
Savings
Loan sources
Make an inventory of the entrepreneurial activities and the number of livelihood activities engaged by beneficiary households along:
Manufacturing/Processing
Transportation
Construction Workers
Repair of motor vehicle
Electrician/ Technician
Determine the monthly revenue, cost, and net income of the beneficiary’s household earned from participation in economic activities as specified for the following income sources after the program along:
Manufacturing/ Processing
Transportation
Construction worker
Repair of motor vehicle
Electrician/ Technician
Determine the changes created by the program on monthly expenditure of the household along:
Food
Clothing and footwear
Furnitures, Appliances and Household Maintenance
Health
Education
Housing, water, electricity, gas, and other fuels
Transportation
Communication
Determine the changes created by the program on the number of households employed in the livelihood activities;
Determine the proportion of non-household workers employed in the livelihood activities;
Determine the changes created by the livelihood program on the self-perception of poverty by the beneficiary;
Determine the changes created by the livelihood program on self-perception of self-esteem of beneficiary households;
Determine the changes created by the livelihood program on self-perception of skills of beneficiary households;
Determine the changes created by the livelihood program on self- perception of employability of beneficiary households;
Determine the changes created by the program on socio-economic conditions along:
nature of industry and category of work
housing type
main source of water and electricity
household assets owned
social services
savings and loan sources
Determine the net changes created by the project on profitability of livelihood activities.
Significance of the Study
This study will benefit to local government units in the conceptualization of design, processes, and promotion of sustainability of livelihood projects implemented in their area by gaining insights on the information generated on impacts and discussion of the impacts of livelihood projects on outcome indicators.
The information generated will strengthen the existing livelihood programs of the government.
For academic institutions, the information on the study can be used as reference material by researchers, the administration, the students, and the faculty members who will be interested in conducting similar studies in the future that will contribute to the growing body of work on this topic.
For the recipients of the livelihood projects the data generated by this study can be used as reference to further enhance their knowledge in running enterprises.
Scope and Delimitation of the Study
This study was conducted in Tigaon, Camarines Sur, Philippines. The respondents in this study are delimited to the identified and registered beneficiaries of the livelihood program under the categorization of individual projects implemented by Department of Labor and Employment, Local Government Unit, and Department of Social and Welfare Development.
The study only focused on the project entrepreneurial activities in monthly income, monthly expenditures, employment created, and the beneficiary’s perception on poverty, self-esteem, skills, and employability as change indicators.
The respondents of the study covered only the 156 registered beneficiaries who operated their business in the study area such as manufacturing and processing (processed food, nego kart, cooking, baking, sewing), small transport, repair of motor vehicle, construction, and technician tools.
This impact evaluation study made use of proxy counterfactuals particularly for income data sets due to absence of baseline data. The proxy counterfactuals made use of enterprises in the study area such as crop farming and gardening and wholesale and retail enterprises coded as non-recipients of the program who did not avail of the livelihood project, but have the same or almost similar characteristics in capitalization and scale of operation while the treated group of the study make use of all the enterprises that received funding for the program.
REVIEW OF RELATED LITERATURE AND STUDIES
This chapter presents the review of related literature and studies which were found to have relevance to the present study. Also included in this chapter is the synthesis of the state of the art, the gap bridged by the study, the theoretical framework, and the conceptual framework.
Related Literature
Theory of Change in Livelihood Program Evaluation
Evaluation study look for to understand the change from intervention and processes of livelihood project and how these conciliations contribute in strengthening the livelihood outcomes among recipients. This is often explicated through “Theory of Change” (Acosta, 2018; Banerjee et al., 2015; Corpus et al., 2019). This theory assesses livelihood impact against, the changes indicators and expected outcomes.
The Theory of Change explains how a given mechanism is expected to lead to a development change. (UNDAG Guidance, 2017). The primary impact pathways through which livelihood improvement as identified in the theory of change are funds for entrepreneurship and training of entrepreneur management which has a direct impact on changes in income which is expected to increase income and behavioral changes among beneficiaries. The perception of poverty reduced the incidence of poor and even those who are considered non-poor. In behavior, it produced a positive intermediate outcome on work, skills, and values.
Livelihood Program
Livelihood is the means, activities, and entitlements by which people make a living (Babulo et al., 2008; Hua et al. 2017). According to Babulo and Hua, a livelihood system is reforming domain that integrates both the opportunities and assets to a group of people for attaining objectives, aspirations, and exposure to a range of beneficial or harmful ecological, social, economic and political perturbations that may help or hinder groups capacities to make a living. Sustainable livelihood is the demand to meet the basic needs of the poor sustainably (Babulo et al., 2008). It was sustainable when it carries on with and recuperate from stresses and shocks, maintain its capabilities and assets while eroding the natural resource base (Smyth et al., 2017). This further explained as a way of thinking about the objectives, scope, and priorities for the development (Hua et al., 2017).
Studies on BFAR Livelihood Program in the coastal areas of 3 provinces in Maguindanao: Jolo Sulu, Tawi-Tawi and Basilan employing a descriptive and correlational survey with 270 respondents using multi-stage sampling to evaluate the livelihood assistance like motorized pump boat and non-motorized. Results revealed that economic impacts on the beneficiary’s lives were very evident. Almost 234 respondents believed that their income was increased by the acquisition of home appliances, more children sent to school, house improvements, etc. (Mamalangkap et al., 2015). The livelihood assistance improves the living conditions, expanding trade, and technology integration which leaves a significant development in poverty reduction (Dawood et al., 2016). People turn on a wide range of livelihood activities as crucial contributors to well-being (Smyth et al., 2017).
Impact of Livelihood Program
A study in the sampaguita livelihood at Laguna, a qualitative and quantitative methods were used to gather research data from 34 households. Fifteen (15) of these households attended FFS while the other 19 households did not. The study revealed that, this is effective mechanism in alleviating poverty specifically those marginalized poor families. The project improved household daily income (Bacud et al., 2014).
In Bangladesh where financial assets take part a significant role in poverty reduction in community-based fisheries. To achieve the sustainable management in livelihood, it requires strong institutional and financial support from the government (Nurul Islam et al.,2014). The great participation of local government is relatively important to sustain the existing potential of the local communities.
In the study of impact evaluation of cash transfers in Bolivia, it was found out that, it has considerable positive impacts on women decision-making and empowerment (Amber et al.,2017).
The study of conditional cash transfers of 4P’s Program, showed that it encourages actual savings, paying off loans, and keeping bank deposit (Canare, 2016).
Socio-economic Indicators
The socio-economic indicators were applied to evaluate the impact of livestock in livelihood at Pakistan (2014-2015). In the study of farming system, it demonstrates that intervention applied achieve high yields and profits. However, the performance of other socio-economic marked poorly documented on economic aspects of sustainability (Garibaldi et al., 2017).
Income
The project on the provision of cash and food as a livelihood strategy which improved recipients living conditions after the intervention. In Somalia, the livelihood activities engaged by women as important source of income for families and local government. It delineated that 40 to 65% of the total annual revenues collected from informal sector dominated by street vendors (Kettunen, 2021).
In municipality of Looc, Romblon, the sustainable livelihood project in aquaculture micro-enterprise proved a success in community natural assets and market demand. The daily profits improved from 100 pesos to 225 pesos (Acosta et al., 2018).
Attitudes
In the study of the Bangladesh, the impact evaluation undertaken on strengthening women’s ability which aims to empower vulnerable women to become more resilient and develop a sustainable livelihood called “SWAPNO” (Iqbal et al.,2017). This training brings development to a desirable change in behavior. In the farmers’ training it has been considered a critical input for accelerating agriculture and production technology for agricultural development (Christopher et al., 2020).
(Petty et al., 2017) found that recipients of livelihood project become more optimistic with higher self-esteem, self-and confidence and aspire to live better. It showed strong evidence that women boosted their confidence in meetings and group participation than before. Instead of borrowing money with high-interest rates, they relied more on their savings. The result brought higher control over personal household assets as compared to the non-beneficiaries (Khazi et al., 2017).
In Nigeria, the livelihood for the ultra-poor study revealed that accessibility to human asset and financial asset has a positive effect on well-being. It needs to have an access to human asset and financial asset to overcome poverty and vulnerability (Kasim, 2019).
Knowledge
The majority of the beneficiaries found that they have better knowledge of accounting as compared to those non-beneficiaries. In Punjab Pakistan, a study on the analysis of the effectiveness of Farmer Field School in many farmers shows that this approach helps farmers to develop their abilities in analytical, critical, and creativity to make better decisions in leadership, communication, and management. It only implies that the program of local government on livelihood which caters for training for vulnerable groups contributes to rural development and poverty alleviation. It also strengthens their field skills through a process of hands-on field-based (Butt et al.,2015).
Skills
Livelihood project improve group participation and increase confidence in intervening in meetings. It also empowers recipients in decision-making and increasing household resources (Janzen et al.,2021; Amber et al., 2017). The capacity of individuals to work, their education and skills contributes to how a household can utilize the livelihood resources available to it (Smyth et al., 2017).
Synthesis of the State-of-the-Art
The review literature and studies showed the capacity of livelihood programs to uplift socio-economic condition and promote changes in entrepreneurial traits through skills and training enhancement, and acquisition of relevant information to improve their business’s production and development.
Most of the studies focused on the assessment of the livelihood program in terms of the process of implementation but not on the impact evaluation of livelihood programs for the purpose of achieving sustainability.
Gap Bridged by the Study
Most studies, that focused on describing livelihoods such as cash grants, forest, farming, food transfers, livestock, and fisheries, which impact the economic condition, food security, and sustainability. However, very few studies evaluated the impact of the livelihood program in terms of poverty reduction as indicators by change in monthly income, monthly expenditures, entrepreneurial activities and related competencies and behavior related to entrepreneurship such as employability, skills, and self-esteem.
Theoretical Paradigm
The following theories provided the roadmap for developing the key arguments and premise of this study: The theory of social change, the theory of need achievement, the cultural theory of entrepreneurship, the theory of innovation, the theory of social innovation, the theory of sustainable livelihood, and theory of change.
Theory of Social Change advances that social change evolve from any alteration in the social order of a society—reflected for instance in institutions or relations, brought about by modified thought processes (Arjomand, 2004). This may refer to the notion of social progress or sociocultural evolution, the philosophical idea that society moves forward by evolutionary means. It may refer to a paradigmatic change in the socio-economic structure. In this study, social change refers to changes in economic order of a local government, brought about by modified entrepreneurial climate and through processes of individual beneficiaries of entrepreneurial project as a development intervention.
The Theory of Need for Achievement by McClelland (1965) advances that entrepreneurial activity is driven by innate needs of individuals such as project beneficiaries that eventually determine the extent to which the individual will engage in entrepreneurship. These needs are the need for achievement, the need for power and the need for affiliation. Individuals who are highly motivated and have a need for achieving challenging goals are usually more interested in entrepreneurship tasks as compared to those who have a low or moderate need for motivation. Individuals who wish to exercise control over others and acquire power are also more likely to be entrepreneurs. People who desire to socially affiliate with others and gain social acceptance and acknowledgement are also likely to become entrepreneurs in the future. Achievement theories propose that motivation and performance vary according to the strength of one’s need for achievement. The need for achievement is culturally acquired and is a key psychological attribute of entrepreneurs. It is satisfied primarily by an intrinsic sense of success and excellence rather than extrinsic rewards. The need for achievement may be treated as one of the most important dimensions of conscientiousness as well as one of the most revealing.
The Cultural Theory of Entrepreneurship by Cochran (1965) emphasized the significance of cultural values in both the attitudes of entrepreneurs as well as investors. Entrepreneurs are influenced by how their culture views certain factors of their occupation, such as risk-taking attitudes and difficulty level of career development. Some cultures value innovation and entrepreneurship, while others discourage it.
The Theory of Innovation by Schumpeter attributes entrepreneurial activity to creativity and innovation, largely asserting that reformation of all processes related to goods and services is the only driving factor of entrepreneurship. It advances that the introduction of new goods, new methods of production, creative acquisitions, new markets and the new organization will all eventually lead to a significant increase in entrepreneurial activity. This theory essentially lays the foundation for how competition in a market breeds innovation, which further leads to acts of entrepreneurship (Sledsik, 2013).
The Theory of Social Innovation advocates that co-produced solutions are assumed to have positive societal effects, either through increasing aggregate utilitarian value, or by empowering citizens in innovation processes (Ayob et al, 2016)
The Theory of Sustainable Livelihood considers that a livelihood is sustainable when it can cope with and recover from stresses and shocks and maintain or improve its capabilities and assets both now and in the future, while not undermining the natural resource base (Morse, and McNamara, 2013).
The Theory of Change explains how and why a sequence of logically linked events, aka pathways of change, should lead to an ultimate outcome. It does so by articulating assumptions (or worldviews), and the beliefs and hypotheses they rest on, about how short-, medium-, and long-term change happens in a specific external context; and stipulating how early and intermediate outcomes (preconditions) toward the long-term change will be brought about and documented with indicators that suggest how much of, for whom, and when each outcome is to be realized (Serrate, 2017).
This study advances the theory that an altered condition in a local government which is a preferred state of development and uplifted socioeconomic conditions of the residents can be achieved through entrepreneurship as a livelihood intervention. But it would require entrepreneurs to respond to this development vision: individuals who driven by innate needs to engage in entrepreneurship. The cultural dimension of the local government unit in terms of policy support as demonstrated in the implementation of a livelihood project will determine the attitude, the level of enthusiasm and even the outcome of the entrepreneurial project whether it can facilitate or constrain the achievement of the positive socioeconomic change. The livelihood intervention provided by the local government inspires creativity and innovation fueling competition and competitiveness. The competitiveness of both the enterprise and the entrepreneurs will define their individual resiliency whether such enterprise will succumb or succeed in the future resulting from these mixes of institutional support, individual capacity and innate entrepreneurial determination of individual beneficiaries. The theory of change will explicate in empirical terms how these inputs and process to achieve social change aka development and economic upliftment of individuals translate to positive or negative outcomes, or no outcomes at all.
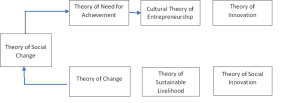
The theoretical framework of the study is presented in Figure 1.
Figure 1. Theoretical Framework of the Study
Conceptual Paradigm
The conceptual framework as shown in Figure 2 presents the input, output, process, and change pathway to livelihood program interventions as strategy to alleviate poverty.
As the framework shows, the inputs consisted of funds for entrepreneurship, training on entrepreneur management. Using the inputs, activities were implemented consisted with the project activity plans target.
The evaluation process consisted of survey of the beneficiaries using questionnaires. The information generated were analyzed using descriptive analysis, difference-in-difference, and multiple regression.
The change created by the project were in the form of income, perception of poverty, self-esteem, employability, and skills.
These can prove the overall impact of the project.
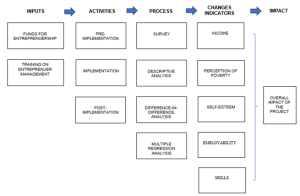
Figure 2. Conceptual Framework of the Study
Definition of Terms
To have a clear understanding of the study, terms that were commonly used were defined as follows:
DOLE Kabuhayan Program Beneficiaries. This refers to eligible beneficiaries who meet the qualifications determined by the local PESO Office as provided in Department Order No. 137-14 S.2014 such as self-employed with insufficient income, marginalized- fisherfolks and landless farmers, unpaid family workers- women and youth, low minimum earners, seasonal workers, displaced workers, persons with disability, senior citizens, indigenous people, parents of child laborers, rebel returnees and victims of armed conflicts.
DOLE Kabuhayan Program. The Program offers grant assistance for capacity building on livelihood ventures for groups or individuals. This project is supported by IRR Department Order No. 137-14 S.2014. It has two components: (1) Livelihood or Kabuhayan Program and (2) Emergency Employment Program (EEP) or Tulong Panghanapbuhay sa Displaced/Disadvantaged workers or TUPAD. The working capital in setting up their business- raw materials, equipment, tools, training, social security, and continuing technical assistance. The grant assistance for livelihood is categorized into Kabuhayan Formation, Enhancement, and Restoration.
Livelihood Program. This refers to the contextualization of government to its local community with co-partnership of local government units. This concept is varied in Philippine settings and mostly in developing countries. Its primary aims of poverty reduction through improvement of the economic situation, living conditions of people, and promoting equitable growth.
Economic Characteristic. This concept pertains to the living condition specified in the local settings. The data gathered from this will serve as the preliminary data that will be used to measure the changes in economic conditions.
Monthly Income. This refers to the income from the economic activities among beneficiaries. It is one of the indicators to measure the economic condition of the beneficiaries. The changes in income imply that implemented program has a direct effect on the evaluation process of this study.
Monthly Expenditures. It is defined as the overall expenses of the family. An item of expenditure covering essential and non-essential goods. The basic needs belong to the physiological pyramid.
Entrepreneurial Activities. This refers to a process of designing and creating a new product and service that generates income for the most vulnerable and marginalized workers and families. It refers to a livelihood venture for groups and individuals which contributes to massive job generation and substantial poverty reduction.
RESEARCH METHODOLOGY
This chapter discusses the research design, sampling techniques, data collection tools, data collection techniques and analysis methods.
Research Design
This study adopted a quasi-experimental impact evaluation design to evaluate the impact of this study. It determined the causal relationship between a government intervention and its results. The strength of this study was a group of non-beneficiaries and beneficiaries of the program implemented which has identified based on their demographic profile as poorest of the poor. Probability sampling techniques were employed in this study. Whereas, the total beneficiaries of the program implemented were the respondents such as “beneficiaries” and “non-beneficiaries”. A difference-in-difference is used in calculating the change in indicators of causal impact in the value of the outcome program (Handa et al., 2014).
In Brazil, this method was presented to accessible language to a broad research audience widely in management-related fields. Difference-in-Differences (DiD) is the most frequently used methods in impact evaluation studies. This is a combination of before-after and treatment-control group comparisons (Fredriksson and de Oliveira, 2019).
Location of the Study
This study was conducted in the municipality of Tigaon, Camarines Sur, Philippines.The data were collected from 12 barangays identified as recipients of DOLE Integrated livelihood Program (DILP) Batch 1-2018.
Sampling Methodology
This study employed a total enumeration sampling technique of beneficiaries of the livelihood project in the manufacturing/processing, transportation, construction works, electrical technology, and repair of a motor vehicle.
Beneficiaries of the project who were no longer available during the survey due to residential transfer, work deployment, and death were no longer covered as respondents of the study.
The sample in this study, were selected from a list of beneficiaries in the following barangays (San Rafael, San Francisco, Caraycayon, Gingaroy, Mabalodbalod, Salvacion, Gubat, Talojongon, Vinagre, Tinawagan, Cabalinadan, Poblacion).
Respondents of the Study
The respondents in this study are the 84 out of 156 program recipients from 12 barangays as identified and registered beneficiaries under the DOLE Integrated Livelihood Program in Tigaon, Camarines Sur. Other respondents who did not answer the survey questionnaires were due to some external factors such as; migration, employment, no financial funds, and even death that affects the results of the study.
Data Gathering Procedure
The researcher conducted a personal visit to the PESO Office to get the list of identified beneficiaries for pre-survey interviews and verification. A letter of permission to conduct the study was prepared and it signed by the respective offices of the Punong Barangays in Tigaon, Camarines Sur. The researcher and enumerators visited the identified household beneficiaries in 12 barangays to administer the survey questionnaires. The respondents were briefed on how to respond in each item before the survey questions were posed.
Data Generating Instrument
The study adopted the semi-structured survey questionnaires modified from, Corpus et. al, (2019) published by the Philippine Institute of Development Studies. The instrument was pre-tested and content validated by experts to ensure content reliability.
The questionnaires for respondents consisted of seven (7) parts namely: Part 1 delved a demographic characteristic; Part 2 delved an economic characteristic; Part 3 delved a net income from livelihood activities; Part 4 delved a household expenditure; Part 5 delved a number of household and non-household workers employed; Part 6 delved self-perception on poverty; and Part 7 delved on self-perception on self-esteem, skills, and employability.
DATA ANALYSIS
The study employed descriptive statistics.
The perception on poverty and entrepreneurial behavior were analyzed using Likert scale method, where: 1=no response, 2= I don’t know, 3= non-poor, 4=poor for self-perception on poverty, where: 1= strongly agree, 2= agree, 3= strongly disagree, 4=disagree for perception on self-esteem and employability, where: 1= all of the time, 2= most of the time, 3= sometimes, 4= never for self-perception on skills.
A Time 1 – Time 2 analysis (Delfino, 2015) was used to determine the changes created by the program interventions on key change indicators of the program.
A Difference -in- Differences analytical tool was employed to quantify impacts attributed to the livelihood program (Fredriksson et al., 2019; Handa et al.,2014).
The multiple regression analysis was employed to identify which variables contributed to the impact of the program and conform the significant influence of these variables to the impacts (Pinthukas, 2015).
This analysis assigned non-recipients (non-beneficiaries) which include crop farming, gardening, wholesale and retail enterprises as counterfactuals of the study. While the program recipients (beneficiaries) composed of manufacturing and processing, transportation, construction works, repair of motor vehicle, electrician and technician enterprises as treated group. The average net income was generated for both counterfactual and treated group before and after the project intervention and the difference between them were computed to determine the net change or impact on household income by livelihood.
To further interpret, the counterfactual value was computed to determine the net change in non-recipients (non-beneficiaries).
RESULTS
This chapter presents the findings, analysis and interpretation of the data gathered concerning the Impact Evaluation of DOLE Integrated Livelihood Program (DILP) in Tigaon, Camarines Sur.
Socio-Demographic Profile of DOLE Livelihood Program Recipients
The socio-demographic profile of respondents is presented in Table 1. Results showed that respondents are almost equally dispersed across age group ranging from 41-50 through 60 and above. More than one-half, or 66% are married; and more than one-half 56% have children aged 16 years and or above. Mostly of the respondents completed elementary and secondary level only. Majority are self-employed (82%).
These indicate that majority of the program recipients have familial obligations, have high dependents and low education attainment. These further indicate that recipients operated own business as a form of self-employment.
Table 1. Socio-demographic Profile of DOLE Livelihood Program Recipients
| Attributes | Frequency | Percentage |
| Age Group | ||
| 18-30 | 6 | 7 |
| 31-40 | 17 | 20 |
| 41-50 | 19 | 23 |
| 51-60 | 20 | 24 |
| 60 above | 22 | 26 |
| Total | n=84 | 100% |
| Sex | ||
| Male | 15 | 18 |
| Female | 69 | 82 |
| Total | n=84 | 100% |
| Civil Status | ||
| Single | 1 | 1 |
| Married | 66 | 79 |
| Live-in | 9 | 11 |
| Separated | 3 | 4 |
| Widowed | 5 | 6 |
| Total | n=84 | 100% |
| Number of Children | ||
| < 5 years | 19 | 7 |
| 5-9 years | 38 | 15 |
| 10-15 years | 57 | 22 |
| >16 years | 143 | 56 |
| Total | n=257 | 100% |
| Educational Attainment | ||
| Elementary level | 4 | 5 |
| Elementary Graduate | 24 | 29 |
| Secondary level | 28 | 33 |
| Secondary Graduate | 12 | 14 |
| Tertiary level | 6 | 7 |
| College Graduate | 9 | 11 |
| Vocational | 1 | 1 |
| Total | n=84 | 100% |
| Employment Status | ||
| Employed | 11 | 13 |
| Self-Employed | 69 | 82 |
| Unemployed | 4 | 5 |
| Total | n=84 | 100% |
| Nature of Employment | ||
| Permanent | 5 | 6 |
| Business | 67 | 80 |
| Unpaid Family work | 3 | 4 |
| Casual | 5 | 6 |
| Seasonal | 4 | 5 |
| Total | n=84 | 100% |
| Class of Workers | ||
| Worked for private household | 4 | 5 |
| Worked for a private establishment | 3 | 4 |
| Worked for gov. operation | 3 | 4 |
| Worked with pay on own family-operated business | 24 | 28 |
| Worked without pay on own family-operated farm or business | 50 | 59 |
| Total | n=84 | 100% |
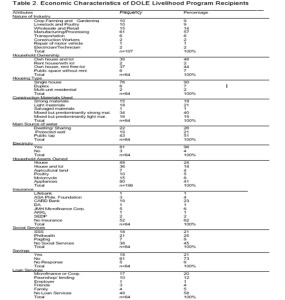
Economic Characteristics of DOLE Livelihood Program Recipients
The economic characteristics of DOLE livelihood program recipients are presented in Table 2.
Results showed that in terms of nature of livelihood engaged by respondents, more than one half or 57% are in the processing livelihood. This was followed by wholesale and retail with 14% of the recipients were engaged. The respondents who belong to the repair of motor vehicle merely compose 1%.
These indicate that manufacturing/processing livelihood is the dominant livelihood program in the area after the program implementation.
In terms of household ownership, less than one half of the respondents (46%) own house and lot. Those who own house with rent free-lot posted an almost similar proportion of 44%.
In terms of construction materials used for their housing units, almost one half, or 40% use mixed but predominantly strong materials. This is followed by houses made up of light and mixed but predominantly light materials which posted 21% and 19% respectively.
The source of water is tapped water for one half of the respondents (51%), while the rest are spread along dwelling wells.
The same observation holds true for household assets with less than one half, or 41% of the respondents own appliances followed by having house (24%) and house and lot (18%).
More than one half or 62% of the recipients have no insurance. The rest have varying nature of insurance mostly provided by microfinance organizations (23%).
The same observation holds true with social services wherein almost one half of the recipients of the program (45%) is not covered by social services. Almost the same proportion of 46% are covered by social services, mainly SSS (21%) and Philhealth (25%).
It is interesting to note that more than one half of the respondents or 58% have no loan services.
The economic characteristics of respondents indicated that more or less one half of the beneficiaries’ households are marginalized as depicted by all indicators of material style of life. The material style of life in households as indicated by house structure and furnishings, provides an indicator of relative wealth or social status in a community. The presence or absence of aspects of house construction and furnishings, access of electricity, and piped water as well as social services and credit are indicative of differential social status. In the case of the respondents covered by the study, these suggests that a lot of the beneficiaries represented the disadvantaged sector of the communities in the service area.
Inventory of Livelihood Activities under the DOLE Livelihood Program
The inventory of livelihood activities under the DOLE livelihood program are presented in Table 3.
Results showed that manufacturing/processing livelihoods have the highest number of recipients (85%). It was followed by transportation livelihood (8%). The repair of motor vehicle livelihood is the least with 1% of the total proportion of response.
These indicate that most beneficiaries showed their interest in manufacturing and processing (processed food, food cart vending, cooking, baking, and sewing) or had been already engaged in the livelihood activity even before the program implementation.
Table 3. Inventory of Livelihood Activities under the DOLE Livelihood Program
| Livelihood Activities | f | % |
| Manufacturing/Processing | 61 | 85 |
| Transportation | 6 | 8 |
| Construction Workers | 2 | 3 |
| Repair of motor vehicle | 1 | 1 |
| Electrician/Technician | 2 | 3 |
| Total | n=72 | 100% |
Monthly Revenue, Cost, and Net Income of the Livelihood Program
The monthly revenue, cost, and net income of the livelihood program after the program implementation are presented in Table 4.
Results showed that manufacturing/processing livelihood posted monthly net income of Php 10,102. This proceeds from a revenue of Php 16,474 and a production cost of Php 6,372. It was followed by construction work with Php 9,050 monthly net income. This proceeds from a revenue of Php 9,900 and estimated cost of Php 850 monthly. The repair of motor vehicle posted the least monthly revenue (Php 3,500) among the economic activities that were supported by the livelihood program. This proceeds from a monthly revenue of Php 3,500 and estimated monthly cost of Php 1,030.
These indicate that all the economic activities supported by the livelihood program despite varying costs, were able to register positive net returns.
Table 4. Monthly Revenue, Cost, and Net Income of the Livelihood Program
| Economic Activities | f | Estimated | Estimated | Estimated |
| Revenue (Php) | Cost (Php) | Net Income (Php) | ||
| Manufacturing/Processing | 61 | 16,474 | 6,372 | 10,102 |
| Transportation | 6 | 4,733 | 454 | 4,279 |
| Construction Workers | 2 | 9,900 | 850 | 9,050 |
| Repair of motor vehicle | 1 | 3,500 | 1,030 | 2,470 |
| Electrician/Technician | 2 | 3,600 | 250 | 3,350 |
Changes Created by the Project on Monthly Expenditures of Household
The changes created by the project on monthly expenditures of a household before and after the program implementation are presented in Table 5.
Results showed a monthly expenditure of the average respondent before the implementation of the livelihood program at Php 6,998. This declined to a monthly expenditure of Php 6,778 after the project implementation.
These indicate that the household expenditures reduced a little bit after the intervention. Notably, there was a visible reduction in food expenditures from 74% to 69% after the project implementation. This observation could be attributed to the movement of household members away from the parental households to live independently suggesting the enabling influence of the project.
Table 5. Monthly Expenditures of Households Before and After the Program Implementation
| HH Expenditures | Before (Php) | % | After (Php) | % |
| Food | 5,194 | 74 | 4,674 | 69 |
| Clothing | 127 | 2 | 132 | 2 |
| Footwear | 52 | 1 | 73 | 1 |
| Furniture, Appliances, Maintenance | 315 | 5 | 456 | 7 |
| Health | 249 | 4 | 198 | 3 |
| Education | 373 | 5 | 199 | 3 |
| Water | 149 | 2 | 202 | 3 |
| Electricity and Gas Fuels | 418 | 6 | 648 | 10 |
| Transportation | 91 | 1 | 119 | 2 |
| Communication | 30 | 0.43 | 77 | 1 |
| Total | Php 6,998 | 100% | Php 6,778 | 100% |
Changes Created by the Program on the Number of Household Workers Employed in the Livelihood Activities
The total number of household workers employed in the livelihood activities before and after the program implementation are presented in Figure 3.
Results showed that most of the household workers are employed in manufacturing/processing livelihood. It has posted an increase after the program implementation to 4 household workers from a total of 29 before the project to 33 after the implementation of the project. The number of household workers in electrician/technician posted 0 household worker employed. These indicate that the manufacturing and processing livelihood provided the relatively higher livelihood activity in terms of generating employment for household workers.
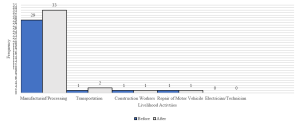
Figure 3. Total Number of household workers employed in the livelihood activities
Changes Created by the Project on the Proportion of Non-Household Workers Employed in the Livelihood Activities
The proportion of non-household workers employed in the livelihood activities by respondents before and after the program implementation are presented in Figure 4.
Results showed that the proportion of non-household workers employed in repair of motor vehicle livelihood were sustained at 100% before and after the implementation. While the non-household workers employed in manufacturing/processing livelihood decreased to 42% after the implementation from the previous 79% before the program.
These indicate that the manufacturing/processing livelihood did not absorb nor generated employment for non-household workers. These suggest that the employment opportunity for non-household workers before the program, were taken over mostly by household member workers. This could be attributed to the family-managed enterprise nature of the livelihood activities supported by the project.
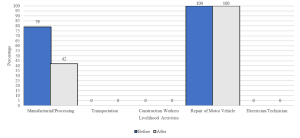
Figure 4. Number of Non- Household Workers Employed in the Livelihood Activities
Changes Created by the Livelihood Program on Self- Perception of Poverty by Beneficiaries
The self-perception of poverty by program beneficiaries before and after the program implementation are presented in Table 6.
Results showed that before the program implementation there were 87% of the respondents who stated that they are poor, but this proportion declined to 69% after the implementation. On the other hand, there were 10% of the respondents who perceived that they belong to non-poor before the project implementation and increased to 25% after the project implementation.
These indicate that the livelihood program supported by the intervention have poverty reducing effect. It reduced the incidence of poor and even those who are considered non-poor. This suggest that the movement in poverty is more profound among the poor than those non-poor moving to higher socioeconomic status.
Table 6. Self- Perception of Poverty Before and After the Implementation
| Before | After | |||
| Indicators | f | % | f | % |
| Poor (4) | 73 | 87 | 58 | 69 |
| Non-poor (3) | 8 | 10 | 21 | 25 |
| I don’t know (2) | 3 | 4 | 5 | 6 |
| No response (1) | 0 | 0 | 0 | 0 |
| Total | 84 | 100 | 84 | 100 |
Changes Created by the Livelihood Project on Self- Perception of Self-Esteem by Program Beneficiaries
The self-perception of self-esteem by program beneficiaries before and after the program implementation are presented in Figure 5.
Results revealed that the “wishing more respect for myself” perception of self-esteem statement posted a weighted mean of 3.48 before the project implementation and slightly increased to 3.49 after the project implementation. The perception of self-esteem statement of “doing things as well as most other people” posted a weighted mean of 3.29 before the project implementation which also increased to 3.31 after the project implementation. On the other hand, the perception of self-esteem statement of “feeling of not having much to be proud of “registered a highest weighted mean of 3.07 before the project implementation and decreased to a weighted mean of 2.95.
These indicate that livelihood program led to positive change of perception of personal pride among the recipients.
In terms of personal “worth of self and at least on an equal plane with others”, this perception statement posted a weighted mean of 3.25 before the project implementation and increased to weighted mean of 3.29. The perception of self-esteem statement of “being satisfied with oneself” showed a positive change from weighted mean of 3.42 to 3.45.
These indicate that the project improved self-respect, self-confidence, pride, self-worth, and feeling of being satisfied with oneself among the beneficiaries.
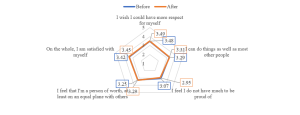
Figure 5. Self- Perception of Self-Esteem Before and After the Program Implementation
Changes Created by the Program on Self-Perception of Skills
The self-perception of skills before and after the program implementation are presented in Figure 6.
Results showed that the perception of “being time conscious and manageable” posted a weighted mean of 3.33 before the project implementation and increased to 3.42 after the project implementation. On the other hand, the perception statement of “listening attentively to other people and trying not to interrupt others” registered a weighted mean of 3.21 and increased to 3.29 after the project implementation.
The perception statement on “budgeting and prioritizing things rather than wants” posted the highest weighted mean of 3.44 after the project implementation from a weighted mean of 3.33 before the project. The perception statement on “trying to save extra money for emergencies” posted a weighted mean of 3.31 before the project implementation and increased to 3.39 after the project implementation. However, the perception statement on “wearing clothes that suit in the occasion one is attending” posted a weighted mean of 3.31 before the project implementation and decreased to 2.76 after the project implementation.
These indicate that the project resulted to the improvement of time management, communication, relationship with co-workers, management of finances, investment orientation and frugality of recipients.
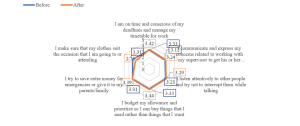
Figure 6. Self-Perception of Skills Before and After the Program Implementation
Changes Created by the Project on Self- Perception of Employability
The self-perception of employability before and after the program implementation are presented in Figure 7.
Results showed that the self-perception of employability statement on “taking to explain an idea takes several tries” posted a weighted mean of 3.11 before the project but decreased to a weighted mean of 2.61 after the project implementation. The perception statement on “trying to consider other’s way of thinking before reaching a solution” posted a weighted mean of 3.19 before the project and increased to 3.24 after the project implementation. The perception statement “knowing how to get along with different types of personalities” posted a weighted mean of 3.11 before the project implementation and slightly increased to 3.15 after the project implementation. While the perception statement on “something to do things at the last minute” posted weighted mean of 3.15 before the project, and decreased to weighted mean of 2.7 after the project implementation. The perception statement on “proposing ideas to help teammates to achieve their goals” posted a weighted mean of 3.17 before the project implementation and slightly increased to 3.18 after the project.
These indicate that the project improved the recipient’s employability as revealed by the self-rated improvements in being articulate, being considerate of others opinion in reaching decisions, being flexible, being on time, and being a team player.
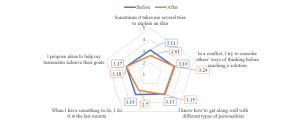
Figure 7. Self-Perception of Employability Before and After the Program Implementation
Changes Created by the Program on Socio-Economic Condition of Beneficiaries
The changes created by livelihood program on socio-economic condition of program beneficiaries are presented in Table 7.
Results showed that in terms of change in livelihood activities recorded for the area, the proportion of manufacturing and processing livelihood increased from 84% to 85% before and after the program implementation respectively. It posted a 1% change for the two periods. Similarly, the transportation livelihood also demonstrated an increase for 7% to 8% before and after the program implementation respectively. It also registered a positive 1% change for the two periods.
In terms of class of work, there was a reduction in the proportion of those who worked for private household from 14% to 5%, posting a negative net change of -9% for the two periods. Similarly, the proportion of workers in private livelihood declined from 6% to 4% registering a negative net change of -2%. However, there was an increase of workers with pay in family operated business from 21% to 29% posting a positive net change of 8%. While, those who worked in non-family operated livelihood without pay also increased from 55% to 60% posting a positive net change of 5%. In terms of housing type, there was an increase in proportion of single housing type houses from 89% to 90% posting positive net change of 1%, while a reduction in the proportion of multi-residential houses was observed from 1% to 0% for the two periods and posting a negative net change of -1%.
In terms of main source of water, the proportion of dwelling/sharing water source declined from 30% to 26% posting a negative net change of -4%. While, there was an increase in the use of public tap water from 48% to 51% before and after the project posting a positive net change of 3%. In terms of main source of electricity, there was an increase of proportion household electricity from 94% to 96% before and after the project posting a positive net change of 2%.
In terms of household assets owned, there was a notable increase in appliances owned from 73% to 95% before and after the project posting a positive net change of 22%. This is followed by an increase in proportion of motorcycle owned from 13% to 18% before and after the program posting a positive change of 5%.
There was no change in social programs accessed by household for the two periods. Also, the proportion of household that have savings was similar to the proportion of household without savings. In terms of loan sources, there was a reduction in the proportion of households that accessed microfinance from 53% to 49% before and after the project posting a negative net change of -4%. However, there was an increase in proportion of households that availed from pawnshops or lending shops from 21% to 23% before and after the project posting a positive net change of 3%. There was also an increase in the proportion of borrowings from 21% to 23% before and after the project posting a net change of 2%. These indicate that the project resulted to the reduction in labor-intensive, wage-based, and marginal underground enterprises, while facilitated the increase in proportion of innovative, value adding, and high return enterprises. It has also reduced the pattern of domestic helper employment but instead increased self-employment. The project also encouraged independence and promoted access to basic household necessities such as electricity and tap water improving the state of relative marginalization of the beneficiaries.
The project improved the socio-economic condition of recipient households as indicated by the increasing number of small type transport assets and the availment of appliances for comfortable living. The negative change in microfinance as a source of loans signified the start of freedom from perpetual bondage to private loan sharks.
Table 7. Impact of Livelihood Program on Socio-economic Condition of Beneficiaries
| Before | After | T1-T0 | |||||||
| f | % | f | % | % | |||||
| Nature of Industry | |||||||||
| Manufacturing/Processing | 56 | 84 | 61 | 85 | 1 | ||||
| Transportation | 5 | 7 | 6 | 8 | 1 | ||||
| Construction Workers | 4 | 6 | 2 | 3 | -3 | ||||
| Repair of motor vehicle | 1 | 1 | 1 | 1 | 0 | ||||
| Electrician/ Tech. | 1 | 1 | 2 | 3 | 2 | ||||
| Total | 67 | 100 | 72 | 100 | |||||
| Class of Work | |||||||||
| Worked for private household | 12 | 14 | 4 | 5 | -9 | ||||
| Worked for a private establishment | 5 | 6 | 3 | 4 | -2 | ||||
| Worked for government operation | 3 | 4 | 3 | 4 | 0 | ||||
| Worked with pay own-operated fam. Business | 18 | 21 | 24 | 29 | 8 | ||||
| Worked without pay own-operated fam. Business | 46 | 55 | 50 | 60 | 5 | ||||
| Total | 84 | 100 | 84 | 100 | |||||
| Housing Type | |||||||||
| Single | 75 | 89 | 76 | 90 | 1 | ||||
| Duplex | 6 | 7 | 6 | 7 | 0 | ||||
| Multi-residential | 1 | 1 | 0 | 0 | -1 | ||||
| Others | 2 | 2 | 2 | 2 | 0 | ||||
| Total | 84 | 100 | 84 | 100 | |||||
| Main source of water | |||||||||
| Dwelling/Sharing | 25 | 30 | 22 | 26 | -4 | ||||
| Protected well | 19 | 23 | 19 | 23 | 0 | ||||
| Public Tap | 40 | 48 | 43 | 51 | 3 | ||||
| Total | 84 | 100 | 84 | 100 | |||||
| Main Source of electricity | |||||||||
| Yes | 79 | 94 | 81 | 96 | 2 | ||||
| No | 5 | 6 | 3 | 4 | -2 | ||||
| Total | 84 | 100 | 84 | 100 | |||||
| Household asset owned | |||||||||
| House | 48 | 57 | 48 | 57 | 0 | ||||
| House and lot | 36 | 43 | 36 | 43 | 0 | ||||
| Agricultural land | 6 | 7 | 7 | 8 | 1 | ||||
| Poultry | 12 | 14 | 10 | 12 | -2 | ||||
| Motorcycle | 11 | 13 | 15 | 18 | 5 | ||||
| Appliances | 61 | 73 | 80 | 95 | 22 | ||||
| Total | 174 | 100 | 196 | 100 | |||||
| Social Programs | |||||||||
| SSS | 18 | 39 | 18 | 39 | 0 | ||||
| Philhealth
Pagibig Total |
21
7 46 |
46
15 100 |
21
7 46 |
46
15 100 |
0
0 |
||||
| Savings | |||||||||
| Yes
No |
16
68 |
19
81 |
19
65 |
23
77 |
4
-4 |
||||
| Total | 84 | 100 | 84 | 100 | |||||
| Loan Sources | |||||||||
| Microfinance | 20 | 53 | 17 | 49 | -4 | ||||
| Pawnshop/Lending | 10 | 26 | 10 | 29 | 3 | ||||
| Borrowings | 8 | 21 | 8 | 23 | 2 | ||||
| Total | 38 | 100 | 35 | 100 | |||||
Changes in Monthly Mean Revenue, Operating Expenses, and Net Income of Livelihood Activities
The mean revenue, mean operating expenses, and mean net income of livelihood activities are presented in Table 8.
Results showed that there is significant change in the monthly net income of construction works livelihood at Php 5,745 higher than other livelihood activities after the project implementation. It was followed by manufacturing and processing livelihood which posted Php 3,099 change in net income. While the electrician and technician livelihood posted the same revenue before and after the project implementation.
These indicate that the livelihood intervention improved the monthly net income of recipients for livelihood activities supported by the project. The change was notable to have variability ranging from low to medium to high depending on the nature of the enterprise.
Table 8. Mean Revenue, Mean Operating Expenses and Mean Net Income of Livelihood Activities by Respondent
| Economic Activity | Revenue | Operating Expenses | Net Income | Change | % Increase | |||
| Before Php | After Php | Before Php | After Php | Before Php | After Php | Amount | ||
| Manufacturing and Processing | 12,170 | 16,474 | 5,167 | 6,372 | 7,003 | 10,102 | 3,099 | 31 |
| Transportation | 4,420 | 4,733 | 615 | 454 | 3,805 | 4,279 | 474 | 11 |
| Construction Workers | 3,710 | 9,900 | 405 | 850 | 3,305 | 9,050 | 5,745 | 63 |
| Repair of Motor Vehicle | 1,400 | 3,500 | 630 | 1,030 | 770 | 2,470 | 1,700 | 69 |
| Electrician/Technician | 3,600 | 3,600 | 2,502 | 250 | 3,350 | 3,350 | 0 | 0 |
Net Changes Created by the Program on Profitability of Livelihood Activities
The net changes in monthly average net income before and after the implementation of livelihood program in recipients and non-recipients are presented in Table 9.
The crop farming and gardening, wholesale and retail livelihood which were not covered by the intervention demonstrated net changes in net income before and after the project implementation ranging from 5% to 21%. However, the livelihood such as manufacturing and processing, transportation, construction works, repair of motor vehicle, electrician and technician which were covered by the intervention demonstrated change in net income ranging from 12% to 221% before and after the project implementation.
The average change in net income of non-recipients was estimated at 13% before and after the project. Whereas the recipients of livelihood who are covered by the intervention posted an average change in net income at 90% before and after the project. Overall, the project has created a net change of 77% increase in average monthly net income of all livelihood covered by the project.
These indicate that the livelihood intervention significantly created change in net income as measure of project impact on the livelihood of covered by the project. The impact was noticed to have high variability ranging from low to extremely high depending on the nature of the enterprise.
It is interesting to note that there was almost no change in net income among electrician/technician livelihood. This reflected the capacity of the project to mitigate the downtrend in net income in the sector. The emergence of Chinese stores and products in the district which sell very cheap but disposable electronic gadgets threatened the survival and profitability of this livelihood. The livelihood project somehow had cushioned the negative impact of this development to the electrician/technician livelihood. The cancelling effect of the livelihood support resulted to a zero, or computed absence of highly visible positive change in the net income of this sector.
Table 9. Changes in Monthly Average Net Income Before and After the Implementation of Livelihood Program in Recipients and Non-Recipients
| Livelihood Activities | Non- Recipients | Livelihood Activities | Recipients | ||||||
| Before | After | Diff. | Change | Before | After | Diff. | Change | ||
| Net Income Php | Net Income Php | % | Net Income Php | Net Income Php | % | ||||
| Crop Farming and Gardening | 11,982 | 12,590 | 608 | 5% | Manufacturing and Processing | 7,003 | 10,102 | 3,099 | 44% |
| Wholesale Retail | 2,708 | 3,266 | 558 | 21% | Transportation | 3,805 | 4,279 | 474 | 12% |
| Construction Workers | 3,305 | 9,050 | 5,745 | 174% | |||||
| Repair of motor vehicle | 770 | 2,470 | 1,700 | 221% | |||||
| Electrician and Technician | 3,350 | 3,350 | 0 | 0% | |||||
Ave. Change 13% 90%
Net Change= (Change in Recipients-Change in Non-Recipients) 77%
COUNTERFACTUAL VALUE=Recipient Before- (Nonrecipient Before-Nonrecipient After)
=14,883- (14,690-15,856)
=14,883- (-1,166)
=16,049
*** Counterfactual Value= 7.8%= (1,166/14,883) x100%
There is an increase of an average of 7.8% without the intervention.
Logistic Regression Parameters of Program Impact Evaluation
The multiple regression analysis on net income of program recipients is presented in Table 10.
The regression analysis used the beneficiaries of the program that receive and did not receive the livelihood support for the project. They were dichotomized using the codes 1=recipient of project support, and 0=non recipients of project support. These were used a dependent variable. It also used time variable as proxy for project impact or change which was also dichotomized as 1=after the project, 0= before the project.
The results showed in R Square at 0.049553, it means that only 4.9% of the variation in the presence of livelihood program can be attributed to the variation of the interaction of the independent variables. However, in Adjusted R Square it showed low at 0.014132, it indicates that only 1.14% of the variation in the presence of livelihood program can be attributed to the variation of the interaction of the independent variables. Further, predictor variables such as sex, educational level, loan access, and savings are poor predictors of net income that confined to the value of adjusted R square.
Results showed that it has a possible estimated variation in the dependent variables such as sex, education, loan access, and savings. Among the independent variables, only time is found to be a significant predictor (p=0.038) of presence of program livelihood support. This indicates that variation in time (with or without project) contributes significantly to the variation in project support. This suggests that the project influence the presence of the project interventions significantly, and those respondents who are recipients of the project.
Table 10. Multiple Regression Analysis on Net Income of Program Recipients
| Regression Statistics | |
| Multiple R | 0.222604 |
| R Square | 0.049553 |
| Adjusted R Square | 0.014132 |
| Standard Error | 8701.264 |
| Observations | 168 |
| Parameters | Coefficients | P-value |
| Intercept Net Income | -1360.64 | 0.765689 |
| Time | 2810.279 | 0.038649 |
| Entrep | -1945.84 | 0.219826 |
| Sex | 2141.318 | 0.472836 |
| Educ | 270.4255 | 0.524668 |
| Loanacces | 974.6293 | 0.478887 |
| Savings | 2238.881 | 0.206339 |
DISCUSSION
This chapter discussed the evaluation, delimitation and weakness concerning the Impact Evaluation of DOLE Integrated Livelihood Program (DILP) in Tigaon, Camarines Sur.
Among the livelihood activities supported by the project, the manufacturing and processing as well as the construction work livelihood categories registered the relatively highest net returns. These highlighted the importance of the following elements in pursuing livelihood projects in the context of poverty alleviation: (1) the use of innovation yields higher return, (2) the use of raw labor for production when enhanced with simple machines yields high return, and (3) the use of innovation in processing livelihood and enhancement of raw labor with simple machines with adequate support from the government yields higher returns. The Theory of Innovation by Schumpeter attributes to creativity and innovation, largely asserting that reformation of all processes related to goods and services is the only driving factor of entrepreneurship which eventually led to a significant increase in entrepreneurial activity.
It is very evident from the relatively higher return posted by manufacturing and processing livelihood supported by the project that the introduction of innovation through value adding enhances profit of beneficiaries as entrepreneurs. This emphasizes the importance of creation and value addition in implementing sustainable livelihood for the poor as a strategy to reduce poverty. The livelihood assistance from the government or other institutions improves the living conditions, expanding trade, and technology integration which leaves a notable development in poverty reduction (Dawood et al., 2016).
It is also very evident from the relatively higher return posted by the construction work-related livelihood that the use of raw services when enhanced with simple equipment and machines enhances profit of labor-based enterprises. This highlighted the importance of upscaling quality of services and efficiency in generating outputs of labor in enhancing the income of daily wage-earning laborers in the construction-related industries such as carpenters, plumbers, masons, etc. This explicated in the theory of sustainable livelihood which shows the importance of coping and recovering from stressors and shocks that improve its capabilities and assets both now and, in the future, (Morse, and McNamara, 2013). In theory of innovation, it lays the foundation for how competition in a market breeds innovation, which further leads to acts of entrepreneurship (Sledsik, 2013).
Given the initial marginalized capitalization of these livelihood categories, the support from the project provided the enabling environment for the beneficiaries to implement innovations, promote quality and efficiency achieving relatively higher profitability. The profit realized by their livelihood activities may be relatively small for a monthly net return of an adequately funded enterprise. But the fact that almost all of the livelihood activities funded by the project posted positive net returns confirmed the strong potential of livelihood activities that are financially supported by the government to post encouraging economic impact.
The livelihood activities funded by the project did not much created opportunities for employment for private individuals. Rather, the employment generated were captured by the household family members showing the potential of government supported livelihood projects to absorb idle manpower from the households and make them productive. The small-scale nature of the livelihood enterprises funded by the project do not have the sufficient financial resources to cover the wage of private labor. If they do, the cost of labor will dissipate the profit accruing to the enterprise compromising operational sustainability. This explained why the livelihood project did not create much employment for private individuals other than household members. Therefore, the livelihood activities did not only create small wealth in the form of small profit generated, but also created jobs for the household members.
For the beneficiaries, the livelihood program has created some behavioral changes. The project has been able to improve the behavior of its clienteles. It emphasized the significance of cultural values in both the attitudes of entrepreneurs as well as investors (Cochran, 1965). The support to livelihood had been able to produce positive intermediate outcomes on the beneficiaries as reflected in their answers to the self-rated questionnaires. The differences in the mean ratings in the question statements from the self-rated questionnaires that probed on their knowledge, skills and attitude showed positive changes. The intervention in general had become successful in upgrading self-confidence, in teaching frugality and time management, and in promoting self-worth among the project beneficiaries. Livelihood project improve group participation and increase confidence in intervening in meetings. It also empowers recipients in decision-making and increasing household resources (Janzen et al.,2021; Amber et al., 2017). This showed the potential of government supported livelihood projects as effective learning space where people could be engaged in the process of earning a living and could at the same time be engaged in the process of learning key values and virtues to become good citizens necessary for building a pleasant and livable society.
The livelihood project also created changes in the competencies of the beneficiaries as indicated by the positive self-rated responses on questions that probed on the project’s perceived impact on their work skills, knowledge and attitude. Basing from the response from the self-rated questionnaire, those who availed the livelihood support believed that the project provided them opportunities in further improving their decision-making capabilities, their relationships with colleagues in the work environment, their concern for quality and their positive attitude towards work. This highlighted the capacity development goals of the livelihood project to improve the work skills, values and skills of Filipino workers to create a productive and competitive economy. In theory of need for achievement it has a psychological attribute for entrepreneurs. It proposes that motivation and performance vary according to the strength of one’s need for achievement (Mc Clelland, 1965). The World Bank policy paper for Southeast Asia highlighted the crucial role of the services sector, apart from the agriculture and industry sector in propelling their economies toward the 21st century. For the Philippines, it specifically prescribed the investment of government resources to make its workers’ competitive and industry-ready to be able to deliver quality products and services that can compete with the world and support its growing economy. This project resulted to the improvement of time management, communication, relationship with co-workers, management of finances, investment orientation and frugality of recipients.
It underscored the importance of developing a workforce imbued with competitive skills, positive work values and attitude towards work as the foundation of completive and highly productive economies. The constraint confronted by formal skills training institutions to realize this direction to the informal sectors –or those non-schooling, individuals who are engrossed with their self-operated enterprises to eke out a living for their families on a daily basis- is addressed through the informal form of learning that is gained indirectly from the operation of the livelihood enterprise that the project has supported.
The poverty reducing impact of the project is evident from the movement in the proportion of households from poverty over time as shown by the changes in the self-rated poverty question responses covering the two periods. There was observable climb in the proportion of poor households to non-poor, and even those who considered themselves below poor moving above towards poor household status. In theory of social change, it shows a paradigmatic change in the socio-economic structure. Self-rated measures for determining poverty status of the household becomes an acceptable tool in poverty economics to generate field data to guide government policy. In this study, the self-rated data generating tool was used to determine the movement in poverty situation of households using their personal experience of poverty and perceptions on the changes in their socioeconomic condition over time.
Generally, the impact created by the project modest but very significant. This could be attributed to the quantal and temporal dimensions of the project implementation. On the temporal, the project implementation, as common with many development projects of the government, was carried out for a defined period whose project implementation is only warranted by the budget and the time table specified in the project. The relatively short duration of project implementation initiated the projects towards the stage of incubation and growth, too short for the growing livelihood project to push through maturity and self-sustaining stage. This late stage is the point where the enterprise becomes resilient enough to be weaned from government support and become self-sustaining and capable enough to extend its own resources to support others. On the quantal, the support given covers financial capital for the operation of the livelihood covering variable costs such production inputs and some fixed assets for the occupation such as tools and light equipment given on single shot approach, coupled with capacity development that covered adequate length of time for the assimilation of learned competencies. The financial assistance nature of the support for the livelihood makes each project assets less resilient towards the risks of uncertainty and loss which is a common experience in establishing enterprises. Back-up capital for business or a form of ‘reserve tire’ is a necessary element for business because of the risk associated with it. This feature was not part of the project to provide backup support a project that is stricken with operational misfortune to keep them afloat and be able to survive through it. However, the modest impacts detected in this study could not solely be attributed to the quantal and temporal dimensions of the project. There are other hosts of factors that could have contributed towards having stalled or diminished the intermediate outcomes attributable to the project. These include the effect of the pandemic and typhoons which were not considered in the study. It is very much possible that the two-year hiatus in economic activities due to quarantine procedures and lockdowns implemented during the pandemic could have reduced the quantifiable socioeconomic and behavioral impact indicators created by the project. It is also very much possible that the frequent typhoons that struck the project area could have stalled the expected if not experienced positive changes due to the project supported livelihood activities. It is always recognized that disasters such as typhoons stall growth trajectories, the impacts are more discernable not only on economic but also on non-economic losses and damages such as participation in governance, optimism and motivation for management and cooperation. The possibility that the combinations of both negative impacts from the pandemic and typhoons could have contributed much in cancelling much of the positive changes brought by the project on the beneficiaries and their livelihood activities.
Using binary regression analysis, this project empirically confirmed the effect of the intervention on the beneficiaries for whatever positive changes that were observed for them as captured in this study. Using time period as proxy for the project intervention as the explanatory variable and the likelihood that such variable will influence the variability in the two dichotomized dependent variables representing the beneficiaries and the non-beneficiaries of the project where 1 represents project beneficiaries and the observed improvements in them, and where 0 represents the non-beneficiaries of the project. The positive correlation of time as an intervention proxy to the dependent variable singled out the project beneficiaries as the object of much of the changes created by the intervention, where the project beneficiaries represented the dependent variable with higher value in the dichotomized coding scheme employed. This significant and positive correlation of the indirect intervention variable to the project beneficiary as indirect outcome variable provided the empirical evidence to support the observed changes captured for the various impact indicators discussed in this study. In this study, the use of datasets representing proxies for cause-and-effect relationship was attributed to the absence of robust baseline data that were generated by a project pre-implementation study. The commonality of this case in many governments implemented development intervention forced many impact evaluations studies to adopt quasi-experimental research design to satisfy the requirement for the ‘with and without’ and ‘before and after’ project intervention datasets. Also, the absence of counterfactual in the data analysis all the more made it less robust necessitating further confirmatory evaluation. However, more robust studies in impact evaluation require significantly higher cost way beyond the resources of research projects of similar scale to this study.
SUMMARY, CONCLUSIONS AND RECOMMENDATIONS
This chapter presents the summary, conclusions, and recommendations of the data gathered concerning the Impact Evaluation of DOLE Integrated Livelihood Program (DILP) in Tigaon, Camarines Sur.
In summary, majority of the program recipients have familial obligations, have high dependents, low education attainment and operated own business as a form of self-employment. Among these own businesses for self-employment, the manufacturing/processing livelihood is the dominant livelihood program. A lot of the beneficiaries represented the disadvantaged sector of the communities in the service area. Most of them showed in manufacturing and processing (processed food, food cart vending, cooking, baking, and sewing). The livelihood activities supported by the livelihood program despite varying costs, were able to register positive net returns. In theory of sustainable livelihood, it is important in the livelihood to maintain and improve its capabilities and assets both now and in the future, while not undermining the natural resource base (Morse, and McNamara, 2013).
The project in slightly reducing household expenditures notably in food expenditures due to the movement of household members away from the parental households to live independently suggesting the enabling influence of the project. The livelihood project increased the financial assets of the beneficiaries mainly acquired from grants which significantly reduced the financial obligations from informal and usurious sources.
The manufacturing and processing livelihood provided the relatively higher livelihood activity in terms of generating employment for household workers. While these livelihoods did not absorb nor generated employment for non-household workers. These suggest that the employment opportunity for non-household workers, they created employment by household member workers due to the family-managed enterprise nature of the livelihood activities supported by the project.
The livelihood activities supported by the program have poverty reducing effect. It reduced the incidence of poor and even those who are considered non-poor. The movement in poverty is more profound among the poor than those non-poor moving to relatively higher socioeconomic status. Similarly, in theory of social change, it has a paradigmatic change in the socio-economic structure of livelihood beneficiaries. The project also led to positive change of perceptions of personal pride among the recipients, improved self-respect, self-confidence, pride, self-worth, and feeling of being satisfied with oneself and improvement of time management, communication, relationship with co-workers, management of finances, investment orientation and frugality of recipients. Also, the project resulted to the improvement of the recipient’s employability by being articulate, being considerate of others opinion in reaching decisions, being flexible, being on time, and being a team player. The significance of cultural values in both the attitudes of entrepreneurs as well as investors (Cochran, 1965). The project resulted to the reduction in labor-intensive, wage-based, and marginal underground enterprises, while facilitated the increase in proportion of innovative, value adding, and high return livelihood enterprises. To some extent, the project improved the socio-economic condition of recipient households. Among the livelihoods, there was improvement in profit. These changes were empirically validated in this study.
This study demonstrated that well-meaning livelihood program that support the poor have the ability to post improvement in behavior of entrepreneur’s beneficiaries in terms of knowledge, skills, attitude related to managing small-scale livelihood enterprise, and have poverty reducing effect. The impacts created by the project maybe significant and great but these expected outcomes maybe stalled by uncontrolled factors and uncertainties that are commonly not factored in nor anticipated during the project conceptualization and implementation. The more sensitive endogenous or beneficiaries’ related factors that are sensitive to these events are the economic factors such as the revenue, cost and net income from livelihood activities. The findings and insight generated by this study will significantly contribute in re-structuring and improving conceptualization and implementation of livelihood activities that aim to improve the lives of poor, undercapitalized entrepreneurs. It will have implications in the development of policies and interventions that uses livelihood as strategy for poverty alleviation. More importantly, it has provided strong justification in the development of additional financial support for livelihood project against uncertainties and calamities to make them resilient and remain profitable despite the losses caused by the disasters.
It is therefore recommended by this study that additional financial support should be part of the livelihood support package to ensure sustainability against unforeseen events that could cause disruptions or losses on these livelihood projects. Livelihood insurance or other forms of rehabilitative support should be part of livelihood project.
There is a need to provide further support for those livelihood activities funded by the project that demonstrated success. This support should aim for the upscaling of these livelihood enterprises. It was documented by this study that the livelihood activities did not create so much employment opportunities for private individuals although it has created livelihood opportunities for household members. These successful livelihood activities if supported for upscaling can have the financial capacity to employ more private individuals due to expanded scale of operation and capitalization.
There is a need to establish more public facilities that will support food production and processing to achieve product quality and safety. These two attributes of food or processed products are key elements for enhancing product competitiveness. These facilities may include drying facilities, pulverizing facilities, biochemical assessment facilities, and product packaging facilities.
There is also a need to further capacitate beneficiaries on developing innovative products out of the existing ones, on sanitary food preparation and handling and food processing. Processed food products should be subjected for shelf-life studies to ascertain their safety.
Microcredit facilities should also be made accessible to beneficiaries of the livelihood activities to enable those that have demonstrated success to consider expansion and integrate innovation in their enterprises.
Local policies supportive to small-scale enterprises should be enacted by the LGU in order to encourage enterprise development in the area.
There is a need for these livelihood beneficiaries to be organized into a collective group such a cooperative to provide them the autonomy and power to chart their own destinies, promote their business interest, and access information and markets.
There must be baseline information before the project implementation in order to have a more robust measurement of the project impacts. In this study, the weakness was identified in the absence of baseline information by which to make comparisons on the changes in the parameters used for quantifying changes that are attributed to the project. It is recommended that a more improved research design must be adopted in the future to document these changes. The research design must include baseline data before the project implementation, robust similar data after the project implementation, and a counterfactual in order to satisfy the requirements needed by a robust impact evaluation study following a with and without and before and after research protocol.
REFERENCES
- Acosta P., Avalos J., (2018). The Philippines Sustainable Program: Providing and Expanding Access to Employment and Livelihood Opportunities. World Bank Social Protection and Policy Note. May 2018 No. 13.
- Amber K., De Brauw Alan., (2017). The Impacts of Cash Transfers on Women’s Empowerment Learning from Pakistan’s BISP Program. Social Protection and Labor Discussion Paper No. 1702. World bank Group Social Protection and Labor.
- Araos N., Melad K., Orbeta A Jr., (2020): Deepening the Narrative: Qualitative Follow-up Study on the Third Impact Evaluation of Pantawid Pamilya. PIDS Discussion Paper Series No.2020-53. econstor.eu.
- Arjomand S., (2004). Social Theory and the Changing World. Mass Democracy, Development, Modernization, and Globalization. State University of New York. International Sociology Vol. 19 (3): 321-353 DOI: 10.1177/0268580904045344
- Ayob N., Teasdale S., Fagan K., (2016). What a social innovation ‘Came to Be’: Tracing the evolution of a contested concept. J Soc Policy. 2016;45(4):635–53
- Babulo B., Mays B., Nega F., Tollens E., Nyssen J., Deckers J., Mathijs E., (2008). Household Livelihood Strategies and Dependence in the Highlands of Tigray, Northern Ethiopia. Agricultural System Vol. 98. Issue 2 pages 147-155. www.sciencedirect.com
- Bacud et al., (2014). “The Sampaguita Livelihood System in Sta. Cruz, Laguna, Philippines: A Case of a Transformative Resilience Development”.
- Banerjee A., Duflo E., Goldberg N., Karlan D., Christopher U., (2015). A Multifaceted Program Causes Lasting Progress for the Very Poor: Evidence from Six Countries. Science Vol.348 No. 6236.10.1126/science.1260799.
- Butt T., Gao Q.,Zakaria M., Hussan Y.,(2015). An Analysis of the Effectiveness,Farmer Field School (FFS) Approach in Sustainable Rural Livelihood (SRL): The Experience of Punjab, Pakistan. Agricultural Science. Scientific Research Publishing, Vol. 6 No.10 Article ID:60365, p.12, 10.4236/as.2015.610111.
- Canare T., (2016). The Impact of Conditional Cash Transfer on Savings and Other Associated Variables: Evidence from the Philippines’ 4Ps Program. Southeast Asian Journal of Economics 5(1), January- June 2017: 107-145.
- Cochran T., (1965). The Entrepreneur in Economic Change. Explorations in Entrepreneurial History. New York Vol.3 Issue 1.
- Corpus J P., Ballesteros M., Orbeta A Jr., Socioeconomic Profile of Sustainable Livelihood Program Participants: Evidence from a Household Survey (2019). Philippine Institute Development of Studies. https://www.pids.gov.ph
- Dawood S., Leng K., Rohayah S., (2016). Poverty eradication, government role and sustainable livelihood in rural Malaysia: An empirical study of community perception in Northern Peninsular Malaysia. Malaysian Journal of Society and Space. 12 Issue 8 Pages 61-70. ISSN 2180-2491.
- Fredriksson A., De Oliviera G., (2019). Impact Evaluation Using Difference-in-Difference. RAUSP Management Journal. Vol.54 No.4,2019. Emerald Publishing Limited 2531-0488. DOI 10.1108/RAUSP-05-2019-0112.
- Handa S., Park M., (2012). Livelihood Empowerment Against Poverty Program Ghana Baseline Report. The University of North Carolina, Department of Public Policy.Chapel Hill, NC, USA.
- Hua X., Yan J., Zhang Y., (2017). Evaluating the Role of Livelihood Assets in Suitable Livelihood Strategies: Protocol for anti-poverty policy in Easter Tibetan Plateau China. Ecological Indicators Volume 78 pages 62-74. https://doi.org/10.1016/j.ecolind.2017.03.009
- Iqbal K.,Mahmud M.,Chowdhury T.,Roy P.,Hasib A.,(2017). Impact Evaluation of the 1st Phase of SWAPNO.Bangladesh Institute of Development Studies.
- James C., (2011). Theory of Change Review. A Report Commissioned by Comic Relief.
- Janzen S., Magnan N., Sharma S., Thompson W., (2021). Pay It Forward: Impacts of Rural Livelihood Programs with Built-in Spillovers. Nepa School of Social Sciences and Humanities and IDA Associates, sudhindra@ida.com
- Kasim Y., (2019). Impacts of Livelihood Assets on Well-Being of Rural Households in Northern, Nigeria. Department of Public Administration, Umaru-Ali Shinkafi Polytechnic Sokoto, Nigeria. http://TuEngr.com
- Kettunen J., (2021). Building Livelihood Resilience in Kenya, Somalia, and Ethiopia. Hame University of Applied Sciences.
- Mamalangkap et al., (2015). BFAR Livelihood Program in the Coastal Areas Provinces in Magunidanao: Jolo Sulu, Tawi-Tawi and Basilan.
- McClelland D., (1965). N Achievement and Entrepreneurship: A Longitudinal Study. Journal of Personality and Social Psychology, 1 (4) 389- 392. https://doi.org/10.1037/h0021956
- Mc Guire J., (2013). Conditional Cash Transfer in Bolivia: Origin, Impacts, and Universality. Department of Government, Wesleyan University. jmcguire@wesleyan.edu.
- Morse S., McNamara N., (2013). Sustainable Livelihood Approach. A Critique of Theory and Practice. DOI.10.1007/978-94-007-6268-8. Springer Science and Business Media-Dordrecht.
- National Economic Development Authority (2017). Philippine Development Plan 2017-2022”. https://pdp.neda.gov.ph.
- National Economic Development Authority (2016). “Ambisyon Natin 2040”. https://2040.neda.gov.ph.
- Petty R., Wegener D. & Fabrigar L. (1997). Attitude and Attitude Change. Annu. Rev. Pschol.1997.48:609-47.
- Pinthukas N., (2015). Farmer’s Perception and Adaptation in Organic Vegetable Production for Sustainable Livelihood in Chiang Mai Province. Agriculture and Agriculture Science Procedia 5 (2015) 46-51.www.sciencedirect.com
- Philippine Commission on Women (2019). https://pcw.gov.ph/great-women
- Sledsik K., (2013). Schumpeter’s View on Innovation and Entrepreneurship. Management Trends in Theory and Practice, (ed.) Stefan Hittmar, Faculty of Management Science and Informatics, University of Zilina & Institute of Management by University of Zilina, 2013, ISBN 978-80-554-0736-4
- Smyth E., Vanclay F., (2017). The Social Frameworks for Project. A Conceptual but a Practical Model to assist in assessing, planning, and managing the social impacts of projects. Impact Assessment and Project Appraisal, 35:1, 65-80, DOI: 10.1080/ 14615517. 2016.1271539. https// doi.org/ 10.1080/ 14615517. 2016.1271
APPENDICES
Appendix A: Letter Asking Permission to Conduct the Study

Appendix B: Respondents’ Survey Questionnaires
| IDENTIFICATION AND OTHER INFORMATION |
| INTRODUCTION
Good morning/afternoon, my name is (ENUMERATOR’S FULL NAME) of Partido State University, Goa Campus. We are currently surveying a study on the Impact Evaluation DOLE Integrated Livelihood Program (DILP) in Tigaon, Camarines Sur. We would like to as for some information about your household. Can you confirm that [NAME OF LIVELIHOOD PARTICIPANT HOUSEHOLD MEMBER] is a member of this household? If so, may I have some of your time for an interview? CONSENT AND CONFIDENTIALITY CLAUSE All information collected from this interview will be held strictly confidential and will only be used for research. We will not share your personal information with any third party. Moreover, you have the right to object to processing your data, access the data that we will process, and have your data corrected. Do you have any questions regarding the survey? Do you agree to be interviewed? YES GO TO NEXT SECTION NO GO-TO INTERVIEW END DATE |
| RESPONDENT’S NAME
LAST NAME FIRST NAME, EXTENSION NAME MIDDLE NAME |
| 1. DEMOGRAPHIC CHARACTERESTICS
AGE: ( ) 18-30 ( ) 31-40 ( ) 41-50 ( ) 51-60 ( ) 60 Years above SEX: ( ) Male ( ) Female CIVIL STATUS: ( ) Single ( ) Married ( ) Live-in ( ) Separated ( ) Widowed NUMBER OF BEFORE CHILDREN: ( ) Less than 5 years old ( ) 5-9 years old ( ) 10-15 years old ( ) 16 years old above
EDUCATIONAL ATTAINMENT: Elementary Secondary Tertiary ( ) Grade 1 ( ) Grade 7 ( ) 1st year ( ) Grade 2 ( ) Grade 8 ( ) 2nd year ( ) Grade 3 ( ) Grade 9 ( ) 3rd year ( ) Grade 4 ( ) Grade 10 ( ) 4th year ( ) Grade 5 ( ) Grade 11 ( Graduate ( ) Grade 6 ( ) Grade 12 ( ) Graduate ( ) Graduate ( )Others: Pls. specify _______________ |
AFTER ( ) Less than 5 years old ( ) 5-9 years old ( ) 10-15 years old ( ) 16 years old above
Elementary Secondary Tertiary ( ) Grade 1 ( ) Grade 7 ( ) 1st year ( ) Grade 2 ( ) Grade 8 ( ) 2nd year ( ) Grade 3 ( ) Grade 9 ( ) 3rd year ( ) Grade 4 ( ) Grade 10 ( ) 4th year ( ) Grade 5 ( ) Grade 11 ( ) Graduate ( ) Grade 6 ( ) Grade 12 ( ) Graduate ( ) Graduate ( )Others: Pls. specify __________________ |
| 2.ECONOMIC CHARACTERESTICS
EMPLOYMENT STATUS: BEFORE ( ) Employed ( ) Self-Employed ( ) Unemployed NATURE OF EMPLOYMENT: ( ) Permanent job ( ) Business ( ) Unpaid family work ( ) Casual job ( ) Seasonal job NATURE OF INDUSTRY EMPLOYED: ( ) Crop Farming and Gardening ( ) Livestock and Poultry Raising ( ) Wholesale and Retail ( ) Manufacturing ( ) Transportation ( ) Others: Pls. specify__________________ CLASS OF WORKER: ( ) Worked for private household ( ) Worked for a private establishment ( ) Worked for government operation ( ) Worked with pay on own family-operated farm or business ( ) Worked without pay on own family- operated farm or business
NOTE TO THE INTERVIEWER: DO NOT ASK QUESTIONS ON THIS PART TO THE RESPONDENT. ANSWER THEM THROUGH OBSERVATION AT THE TIME OF VISIT.
HOUSEHOLD OWNERSHIP: BEFORE ( ) Own house and lot ( ) Rent house/room including lot ( ) Own house, rent lot ( ) Others: Pls. specify _____________ HOUSING TYPE: ( ) Single house ( ) Duplex ( ) Multi-unit residential unit ( ) Other housing unit: specify________
CONSTRUCTION MATERIALS ( ) Strong materials (aluminum, tile) USED: ( ) Light materials (cogon, nipa) ( ) Salvaged materials ( ) Mixed but predominantly strong ( ) Mixed but predominantly light mat MAIN SOURCE OF WATER SUPPLY: Community water system piped into: ( ) Dwelling/Sharing ( ) Protected ( ) Public tap ELECTRICITY: Is there any electricity in the house? ( ) Yes ( ) No
HOUSEHOLD ASSET OWNED: ( ) House ( ) House and lot ( ) Agricultural land ( ) Animals ( ) Motorcycle ( ) Appliances: __________________ ( ) Others: Pls. specify __________ INSURANCE: Pls. specify______________________________ SOCIAL SERVICES: ( ) SSS ( ) Philhealth ( ) Pag-ibig ( ) Others: ______________________________ SAVINGS: Are there savings to any bank? ( ) Yes ( ) No ( ) No response/ refused
LOAN SERVICES: ( ) Microfinance or credit cooperative ( ) Pawnshop/ lending company ( ) Employer ( ) Friends ( ) Others Pls. specify ________________ |
AFTER ( ) Employed ( ) Self-Employed ( ) Unemployed
( ) Permanent job ( ) Business ( ) Unpaid family work ( ) Casual job ( ) Seasonal job
( ) Crop Farming and Gardening ( ) Livestock and Poultry Raising ( ) Wholesale and Retail ( ) Manufacturing ( ) Transportation ( ) Others: Pls. specify__________________
( ) Worked for private household ( ) Worked for a private establishment ( ) Worked for government operation ( ) Worked with pay on own family-operated farm or business ( ) Worked without pay on own family-operated farm or business
( ) Own house and lot ( ) Rent house/room including lot ( ) Own house, rent lot ( ) Others: Pls. specify _____________________
( ) Single house ( ) Duplex ( ) Multi-unit residential unit ( ) Other housing unit: specify_________________________
( ) Strong materials (galvanized iron, aluminum, tile) ( ) Light materials (cogon, nipa) ( ) Salvaged materials ( ) Mixed but predominantly strong materials ( ) Mixed but predominantly light materials
Community water system piped into: ( ) Dwelling/Sharing ( ) Protected well ( ) Public tap
Is there any electricity in the building or house? ( ) Yes ( ) No
( ) House ( ) House and lot ( ) Agricultural land ( ) Animals ( ) Motorcycle ( ) Appliances: _______________________ ( ) Others: Pls. specify________________
Pls. specify_______________________________ ( ) SSS ( ) Philhealth ( ) Pag-ibig ( ) Others: ____________________________________ Are there savings in any bank? ( ) Yes ( ) No ( ) No response/ refused
( ) Microfinance or credit cooperative ( ) Pawnshop/ lending company ( ) Employer ( ) Friends ( ) Others Pls. specify ___________________________
|
| 3. NET INCOME FROM ENTREPRENEURIAL ACTIVITY |
| MANUFACTURING /PROCESSING | |||
| INC-9. During a MONTH PRIOR TO LIVELIHOOD IMPLEMENTATION (November 2018) and a MONTH AFTER THE LIVELIHOOD IMPLEMENTATION (March 2022) did [NAME OF OPERATOR] receive payment for rendering such services?
1 – Yes 2 – No |
|||
| INCOME FROM SERVICES RENDERED | BEFORE | AFTER | |
| 1. Gross receipts for services rendered during the reference period | Php | ||
| COSTS INCURRED a MONTH PRIOR TO LIVELIHOOD IMPLEMENTATION (November 2018) and a MONTH AFTER THE LIVELIHOOD IMPLEMENTATION (March 2022) IN RENDERING SERVICES | |||
| 1. Gross salaries and wages for paid workers including paid household members | Php | ||
| 2. Materials and supplies purchased (excluding goods purchased for resale) | Php | ||
| 3. Other operating expenses | Php | ||
| TOTAL COSTS (DO NOT ASK) | Php | ||
| C. NET INCOME (DO NOT ASK) | Php | ||
| TRANSPORTATION
INC-9. During a MONTH PRIOR TO LIVELIHOOD IMPLEMENTATION (November 2018) and a MONTH AFTER THE LIVELIHOOD IMPLEMENTATION (March 2022) did [NAME OF OPERATOR] receive payment for rendering such services? 3 – Yes 4 – No |
||||
| INCOME FROM SERVICES RENDERED | BEFORE | AFTER | ||
| 1. Gross receipts for services rendered during the reference period | Php | |||
| COSTS INCURRED a MONTH PRIOR TO LIVELIHOOD IMPLEMENTATION (November 2018) and a MONTH AFTER THE LIVELIHOOD IMPLEMENTATION (March 2022) IN RENDERING SERVICES | ||||
| 1. Gross salaries and wages for paid workers including paid household members | Php | |||
| 2. Materials and supplies purchased (excluding goods purchased for resale) | Php | |||
| 3. Other operating expenses | Php | |||
| TOTAL COSTS (DO NOT ASK) | Php | |||
| C. NET INCOME (DO NOT ASK) | Php | |||
| CONSTRUCTION WORKERS | ||||
| INC-9. During a MONTH PRIOR TO LIVELIHOOD IMPLEMENTATION (November 2018) and a MONTH AFTER THE LIVELIHOOD IMPLEMENTATION (March 2022) did [NAME OF OPERATOR] receive payment for rendering such services?
5 – Yes 6 – No |
||||
| INCOME FROM SERVICES RENDERED | BEFORE | AFTER | ||
| 1. Gross receipts for services rendered during the reference period | Php | |||
| COSTS INCURRED a MONTH PRIOR TO LIVELIHOOD IMPLEMENTATION (November 2018) and a MONTH AFTER THE LIVELIHOOD IMPLEMENTATION (March 2022) IN RENDERING SERVICES | ||||
| 1. Gross salaries and wages for paid workers including paid household members | Php | |||
| 2. Materials and supplies purchased (excluding goods purchased for resale) | Php | |||
| 3. Other operating expenses | Php | |||
| TOTAL COSTS (DO NOT ASK)
C. NET INCOME (DO NOT ASK) |
Php
Php |
|||
| REPAIR OF MOTOR VEHICLE | ||||
| INC-9. During a MONTH PRIOR TO LIVELIHOOD IMPLEMENTATION (November 2018) and a MONTH AFTER THE LIVELIHOOD IMPLEMENTATION (March 2022) did [NAME OF OPERATOR] receive payment for rendering such services?
7 – Yes 8 – No |
||||
| INCOME FROM SERVICES RENDERED | BEFORE | AFTER | ||
| 1. Gross receipts for services rendered during the reference period | Php | |||
| COSTS INCURRED a MONTH PRIOR TO LIVELIHOOD IMPLEMENTATION (November 2018) and a MONTH AFTER THE LIVELIHOOD IMPLEMENTATION (March 2022) IN RENDERING SERVICES | ||||
| 1. Gross salaries and wages for paid workers including paid household members | Php | |||
| 2. Materials and supplies purchased (excluding goods purchased for resale) | Php | |||
| 3. Other operating expenses | Php | |||
| TOTAL COSTS (DO NOT ASK) | Php | |||
| C. NET INCOME (DO NOT ASK) | Php | |||
In this part of the interview, I will ask you about your household’s expenditures during a MONTH PRIOR TO LIVELIHOOD IMPLEMENTATION (November 2018) and a MONTH AFTER THE LIVELIHOOD IMPLEMENTATION (March 2022)
4.HOUSEHOLD EXPENDITURES
| The following questions are about your household’s consumption of food and beverages. Please give me your household’s food consumption every week a MONTH PRIOR TO LIVELIHOOD IMPLEMENTATION (November 2018) and a MONTH AFTER THE LIVELIHOOD IMPLEMENTATION (March 2022).
(INCLUDE ALL FOOD AND BEVERAGES CONSUMED FROM PURCHASES, WHETHER IN CASH OR ON CREDIT, FROM GIFTS, AND THE HOUSEHOLD’S PRODUCTION.) |
||||||
| HE-1. Is a MONTH PRIOR TO LIVELIHOOD IMPLEMENTATION (November 2018) and a MONTH AFTER THE LIVELIHOOD IMPLEMENTATION (March 2022) how much on average is your household’s weekly consumption of [NAME OF ITEM]?
|
IN CASH OR ON CREDIT
(WEEKLY) |
IN-KIND OR SELF-PRODUCED
(WEEKLY) |
RECEIVED AS
GIFTS OR FOR FREE (TOTAL FOR LAST 6 MONTHS) |
|||
| A. BREAD AND CEREALS | BEFORE | AFTER | BEFORE | AFTER | BEFORE | AFTER |
| 1. Rice | Php | Php | Php | |||
| 2. Corn | Php | Php | Php | |||
| 3. Bread | Php | Php | Php | |||
| 4. Pasta | Php | Php | Php | |||
| TOTAL (DO NOT ASK) | ||||||
| B. MEAT
1. Beef |
Php | Php | Php | |||||||||||
| 2. Pork | Php | Php | Php | |||||||||||
| 3. Chicken | Php | Php | Php | |||||||||||
| 4. Preserved or processed meat (tocino, tapa, hotdog, liver spread, luncheon meat, corned beef, longganisa, bacon, embotido, sausage, etc.) | Php | Php | Php | |||||||||||
| TOTAL (DO NOT ASK) | ||||||||||||||
| C. FISH AND SEAFOOD | BEFORE | AFTER | BEFORE | AFTER | BEFORE | AFTER | ||||||||
| 1. Fish (fresh or frozen) | Php | Php | Php | |||||||||||
| 2. Dried, smoked or salted fish (e.g. tuyo, tinapa) | Php | Php | Php | |||||||||||
| TOTAL (DO NOT ASK) | ||||||||||||||
| D. MILK, CHEESE, AND EGGS | BEFORE | AFTER | BEFORE | AFTER | BEFORE | AFTER | ||||||||
| 1. Cheese and curd (e.g. kesong puti, cottage cheese, etc.) | Php | Php | Php | |||||||||||
| 2. Eggs (including balut, penoy, salted eggs, quail eggs, etc.) | Php | Php | Php | |||||||||||
| 3. Other milk, cheese, and eggs not elsewhere classified | Php | Php | Php | |||||||||||
| TOTAL (DO NOT ASK) | ||||||||||||||
| E. OILS AND FATS | BEFORE | AFTER | BEFORE | AFTER | BEFORE | AFTER | ||||||||
| 1. Butter Products | Php | Php | Php | |||||||||||
| 2.Margarine, Peanut butter etc. | Php | Php | Php | |||||||||||
| 3.Edible oil, Cooking Oil | Php | Php | Php | |||||||||||
| TOTAL (DO NOT ASK)
|
||||||||||||||
| F. FRUITS | BEFORE | AFTER | BEFORE | AFTER | BEFORE | AFTER | ||||||||
| 1. Fresh fruits (e.g. banana, mango, apple,
2. Dried Preserved Fruits |
Php | Php | Php | |||||||||||
| TOTAL (DO NOT ASK) | ||||||||||||||
| G. VEGETABLES | ||||||||||||||
| 1. Leafy vegetables (e.g pechay, kangkong, camote tops, cabbage, mustasa, malunggay leaves, etc.) | Php | Php | Php | |||||||||||
| 2. Fruit vegetables (e.g., ampalaya, okra, tomato, squash, beans, legumes, etc.) | Php | Php | Php | |||||||||||
| 3. Others: Pls. specify_____________ | Php | Php | Php | |||||||||||
| TOTAL (DO NOT ASK) | ||||||||||||||
| H. SUGAR, JAM, HONEY, CHOCOLATE | BEFORE | AFTER | BEFORE | AFTER | BEFORE | AFTER |
| 1. Sugar | Php | Php | Php | |||
| 2. Chocolates | Php | Php | Php | |||
| 3. Ice cream | Php | Php | Php | |||
| TOTAL (DO NOT ASK) | ||||||
| I. FOOD PRODUCTS NOT ELSEWHERE CLASSIFIED | BEFORE | AFTER | BEFORE | AFTER | BEFORE | AFTER |
| 1. Condiments | Php | Php | Php | |||
| TOTAL (DO NOT ASK) | ||||||
| J. COFFEE, TEA, AND COCOA | BEFORE | AFTER | BEFORE | AFTER | BEFORE | AFTER |
| 1. Coffee | Php | Php | Php | |||
| 2. Cocoa (including Milo, Ovaltine, Ricoa, tablea, cacao beans) | Php | Php | Php | |||
| 3. Others: Pls. specify_________ | Php | Php | Php | |||
| TOTAL (DO NOT ASK) | ||||||
| K. MINERAL WATER, SOFT DRINKS, FRUIT AND
VEGETABLE JUICES |
BEFORE | AFTER | BEFORE | AFTER | BEFORE | AFTER |
| 1. Mineral and spring water | Php | Php | Php | |||
| 2. Soft drinks | Php | Php | Php | |||
| 2. Fruit Juices | Php | Php | Php | |||
| TOTAL (DO NOT ASK) |
| The following questions are about your household’s actual expenditures a MONTH PRIOR TO LIVELIHOOD IMPLEMENTATION (November 2018) and a month AFTER THE LIVELIHOOD IMPLEMENTATION (March 2022) on items such as clothing, appliances, furniture, health, and education.
(INCLUDE ALL PURCHASES (WHETHER IN CASH OR ON CREDIT), AND ITEMS RECEIVED AS GIFTS OR FOR FREE.) |
|||||||||||||
| HE-2. Did your household spend on [NAME OF ITEM], or received them as a gift, a MONTH PRIOR TO LIVELIHOOD IMPLEMENTATION (November 2018) and a MONTH AFTER THE LIVELIHOOD IMPLEMENTATION (March 2022)
1 – Yes 2 – NoGO TO the NEXT ITEM |
IN CASH OR ON
CREDIT
|
IN-KIND OR SELF-PRODUCED
|
RECEIVED AS
GIFTS OR FOR FREE (LAST 1 MONTH)
|
||||||||||
| BEFORE | AFTER |
BEFORE |
AFTER |
||||||||||
| A | B | C | D | ||||||||||
| A. CLOTHING AND FOOTWEAR | |||||||||||||
| 1. Clothing (e.g. articles of clothing such as shirts, dress, pants, shirts, underwear, socks; clothing accessories such as handkerchiefs, scarfs, belts, helmets; services paid for dressmaking, tailoring, and repair of garments; and rental of clothing) | Php | Php | |||||||||||
| 2. Footwear (e.g. shoes and other footwear for men, women, boys, girls, and infants; parts of footwear; and rental and repair of footwear) | Php | Php | |||||||||||
| TOTAL (DO NOT ASK) | |||||||||||||
| B. FURNITURE, APPLIANCES, EQUIPMENT, AND ROUTINE
HOUSEHOLD MAINTENANCE |
|
||||||||||||
| BEFORE | AFTER | BEFORE | AFTER | ||||||||||
| 1. Repair of Furniture, furnishings, carpets, and other floor covering (includes a dining table, dining chairs, sala set, sofa bed, cabinet, shoe rack, TV rack; ceiling lights, lamps, pictures, sculptures, mirrors, mattresses; and carpets and linoleum) | Php | Php | |||||||||||
| 2. Household textiles (e.g. curtains, bedsheets, pillows, pillowcases, blankets, mosquito nets, etc.) | Php | Php | |||||||||||
| 3. Glassware, tableware, and household utensils (e.g. vases, plates, bowls, glasses, pots, pans, waste bins, bread containers, coffee containers, etc.) | Php | Php | |||||||||||
| 4. Repair of household appliances | Php | Php | |||||||||||
| 5. Transport equipment for household use (e.g. motor cars,
motorcycles, bicycles, tricycles, etc.) |
Php | Php | |||||||||||
| 6. Audio-visual, electronic, and communications equipment Repair (e.g. cellphone, landline phone, television, VCD/DVD player, radio, camera, tablet, desktop computer, laptop computer, printer, scanner, cassette recorder, MP3 player, karaoke/video, microphone, etc.) | Php | Php | |||||||||||
| TOTAL (DO NOT ASK) | |||||||||||||
| C. HEALTH | ||||||
| 1. Medical products, therapeutic gadgets, and equipment (e.g. medicine, vitamins, supplements, thermometer, bandages, etc.) | Php | Php | ||||
| 2. Outpatient medical services (e.g. medical services, dental services, paramedical services) | Php | Php | ||||
| 3.Hospital services (inpatient services in public or private hospitals)
TOTAL (DO NOT ASK) |
Php | Php | ||||
| D. EDUCATION | ||||||
| 1. Education not defined by level (e.g. vocational training, review center, etc.) | Php | Php | ||||
| 2. Allowances for family members studying away from home | Php | Php | ||||
| 3. Other education expenses (e.g. school uniform, computer rental services, printing services, and other educational expenses) | Php | Php | ||||
| TOTAL (DO NOT ASK) |
| The following questions are about your average monthly expenses or consumption a MONTH PRIOR TO LIVELIHOOD IMPLEMENTATION (November 2018) and a MONTH AFTER THE LIVELIHOOD IMPLEMENTATION (March 2022) on items such as personal effects, housing, electricity, water, restaurants, and transportation.
(INCLUDE ALL PURCHASES WHETHER IN CASH OR ON CREDIT, AND ITEMS RECEIVED AS GIFTS OR FOR FREE.) |
||||||
| HE-3. Did your household spend on [NAME OF ITEM] or received them as a gift in the past month?
1 – Yes 2 – NoGO TO the NEXT ITEM |
IN CASH OR ON
CREDIT |
IN-KIND OR SELF-
PRODUCED |
RECEIVED AS GIFTS
OR FOR FREE |
|||
| BEFORE-AFTER | BEFORE-AFTER | |||||
| A. HOUSING, WATER, ELECTRICITY, GAS, AND OTHER FUELS | ||||||
| 1. Actual rentals for housing (actual rental paid, other actual rentals) | Php | Php | ||||
| 2. Imputed rentals for housing (imputed rentals of owner-occupiers) | Php | Php | ||||
| 3. Maintenance and repair of the dwelling (service charges for plumbers, electricians, carpenters, painters, and materials for repair such as paint, wallpaper, etc.) | Php | Php | ||||
| 4. Water supply services related to the dwelling | Php | Php | ||||
| 5. Electricity, gas, and other fuels (electricity, LPG, kerosene, fuelwood, charcoal, and other fuels) | Php | Php | ||||
| TOTAL (DO NOT ASK) | ||||||
| B. TRANSPORT
|
||||||
| 1. Operation of personal transport equipment (purchase of
fuel, spare parts, repair services, driving lessons, driving license, toll fees, parking fees, etc.) |
Php | Php | ||||
| 2. Transport services (expenses on transport fare such as on jeepney, tricycle, bus, shuttle, train, airplane, ferry, etc.) | Php | Php | ||||
| C. COMMUNICATION | ||||||
| 1. Postal/courier services (purchase of sending letters, packages, remittances) | Php | Php | ||||
| 2. Telephone and telefax services (prepaid phone/Internet card, electronic load, Internet subscription, telephone subscription, etc.) | Php | Php | ||||
| TOTAL (DO NOT ASK) | ||||||
| 5. SOURCES OF FUNDS a MONTH PRIOR TO LIVELIHOOD IMPLEMENTATION (November 2018) and a MONTH AFTER THE LIVELIHOOD IMPLEMENTATION (March 2022)
Choose all that apply |
|
| BEFORE
( ) Grants from the livelihood program ( ) Business earnings ( ) A loan from a microfinance/lending company ( ) Borrowings please specify ______________________ ( ) Remittances ( ) Sales of assets |
( ) Grants from the livelihood program ( ) Business earnings ( ) A loan from a microfinance/lending company ( ) Borrowings please specify ______________________ ( ) Remittances ( ) Sales of assets |
| 6. NUMBER OF WORKERS EMPLOYED (ENTREPRENEURIAL ACTIVITIES)
KINDLY WRITE THE EXACT NUMBERS OF WORKERS CORRESPONDING TO YOUR ANSWER
|
|||||
| ENTREPRENEURIAL ACTIVITIES | HOUSEHOLD WORKERS | NON-HOUSEHOLD WORKERS | |||
| BEFORE | AFTER | BEFORE | AFTER | ||
| Food Processing | |||||
| Manufacturing | |||||
| Transportation | |||||
| Others, please specify________________
TOTAL |
|||||
| SELF-PERCEPTION ON POVERTY
SELF-PERCEPTION OF ENTREPRENEURIAL TRAITS
KINDLY PUT CHECK (/) CORRESPONDS ON YOUR ANSWER a MONTH PRIOR TO LIVELIHOOD IMPLEMENTATION (November 2018) and a MONTH AFTER THE LIVELIHOOD IMPLEMENTATION (March 2022) |
||||||||||||||||||||||||||||||||||||||||||||||||||||||||||||||||||||||||||||||||||||||||||||||||||||||||||||||||||||||||||||||||||||||||||||||||||||||||||||||||||||||||||||||||||||||||||||||||||||||||||||||
| 1. Where would you place your family at this level?
BEFORE AFTER ( ) Poor ( ) Poor ( ) Non-Poor ( ) Non-Poor ( ) I don’t know ( ) I don’t know ( ) No response/ Refused ( ) No response/ Refused
2. For the next set of questions, I’m going to read a set of statements about how you see yourself. There are no right or wrong answers. Please tell me whether you strongly agree, disagree, or strongly disagree with each statement. SELF-ESTEEM
3. For the next set of questions, I’m going to read a set of statements about how you see yourself. There are no right or wrong answers. For each statement, please tell me if it is all of the time, most of the time, sometimes, and never. SKILLS
4. For the last set of questions, I’m going to read a set of statements about how you see yourself. There are no right or wrong answers. Please tell me whether you strongly agree, disagree, or strongly disagree with each statement. EMPLOYABILITY
END OF QUESTIONNAIRES
|
||||||||||||||||||||||||||||||||||||||||||||||||||||||||||||||||||||||||||||||||||||||||||||||||||||||||||||||||||||||||||||||||||||||||||||||||||||||||||||||||||||||||||||||||||||||||||||||||||||||||||||||
Source: Discussion Paper Series 2019-2020 by PIDS
Appendix C
Documentation
During the Survey
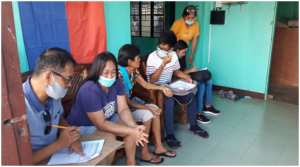


CURRICULUM VITAE

GIGI M. COSEJO
Zone 5 San Rafael, Tigaon, Camarines Sur
gigi.mercolita15@gmail.com
PERSONAL INFORMATION
Date of Birth: September 15, 1982
Age: 40
Place of Birth: Las Pias City
Civil status: Married
Religion: United Pentecostal Church, Philippines
PROFESSIONAL QUALIFICATION
Licensure Examination for Teachers Passer
September 30, 2019
License No.
Events Management Services
CBTED-TESDA
November-January 2020
Poblacion, Tigaon, Camarines Sur
EDUCATIONAL BACKGROUND
Graduate Studies Partido State University
Master in Public Affairs
Major in Local Governance and Development
December 2022
College Southern Luzon State University
Bachelor of Arts
Major in Public Administration
April 2006
Vocational Course Teacher Certificate Program
Ateneo de Naga University
Naga City
April 2019
Events Management Services
CBTED-TESDA
Poblacion, Tigaon, Camarines Sur
WORK EXPERIENCE
November 2020-Present
Secondary Teacher
San Rafael National High School
San Rafael, Tigaon, Camarines Sur
June 2019-May 2019
ALS Implementer
Poblacion, Tigaon, Camarines Sur
June 2009-May 2016
Receptionist/Hostess
Oceana Restaurant
Hilton Dubai Jumeirah Resort
Dubai, UAE
October 2006-May 2009
Cashier/ Accounting Clerk
Motorstar Phils. Inc.
Rodriguez Quezon City
SEMINARS, TRAINING ATTENDED