
Influence of Principals’ Allocation of Teaching and Learning Resources on Learners’ Academic Performance in Kenya Certificate of Secondary Education in Kisii County, Kenya
- Thomas Odongo Ololo
- Dr. Mary Anyango Onditi
- Dr. Benard Mwebi
- 975-1004
- Jun 3, 2024
- Education
Influence of Principals’ Allocation of Teaching and Learning Resources on Learners’ Academic Performance in Kenya Certificate of Secondary Education in Kisii County, Kenya
Thomas Odongo Ololo1, Dr. Mary Anyango Onditi2, Dr. Benard Mwebi3
1PhD Candidate, Department of Curriculum and Educational Management, Jaramogi Oginga Odinga University of Science and Technology-JOOUST
2Senior Lecturer and Chairperson Department of Curriculum and Educational Management, Jaramogi Oginga Odinga University of Science and Technology-JOOUST
3Senior Lecturer, Jaramogi Oginga Odinga University of Science and Technology-JOOUST.
DOI : https://dx.doi.org/10.47772/IJRISS.2024.803067S
Received: 24 April 2024; Accepted: 03 May 2024; Published: 03 June 2024
ABSTRACT
Teaching and learning resources are needed for quality curriculum delivery. The purpose of this study was to investigate the Influence of Principals’ allocation of teaching and learning resources on learners’ academic performance in Kenya Certificate of Secondary Education (K.C.S.E.) in Public Schools. The objective of this study was to establish the influence of Principals’ allocation of teaching and learning resources on learners’ academic performance in K.C.S.E. This study was anchored on Karl Ludwig von Bertalanffy General Systems Theory. Mixed method research design of explanatory sequential type with a prioritized quantitative approach in phase one followed by qualitative approach in phase two was applied in the study. The target population was 4,691 participants which included: 340 Principals, 1360 Heads of Departments (H.O. Ds) and 2,991 teachers. A sample of 451 respondents participated in the study. The researcher used proportionate stratified random sampling technique to select 85 schools, 114 H.O. Ds and 252 teachers and census sampling to select national and special schools while 85 Principals of the selected schools were purposefully sampled. Questionnaires and interview guides were used to collect quantitative and qualitative data respectively. Content validity, Criterion validity, Construct validity and Face validity, of the research instruments were ensured through evaluation by the University supervisors and other experts while internal consistency reliability was estimated by using Cronbach’s alpha coefficient formula which yielded alpha coefficient of over 0.7 which was considered adequate. Quantitative data were analysed using Statistical Package of Social Sciences (SPSS) Version 29 while qualitative data were analysed thematically and presented using direct quotes from the respondents and integrated with the findings of phase one. Descriptive statistics were presented in tables and graphs while inferential statistics were presented in terms of Pearson’s correlation coefficients, Anova and Regression coefficients. The study found out a moderate positive relationship between allocation of teaching and learning resources (r=.072, p≤.05; 2 tailed) and learners’ academic performance in K.C.S.E. Therefore, the null hypothesis was upheld which indicated that teaching and learning resources are inadequate in the study locale. This result was supported by Principals’ interviews for they cited inadequate funding as a drawback towards providing teaching and learning resources. It is hoped that the findings of this study would provide information that would be a base for corrective measures towards the unexpected low academic performance in the study locale. The study recommended that further research should be done on influence of principals’ leadership skills development on academic performance in K.C.S.E.
Key words: Curriculum delivery, teaching and learning resources, academic performance, K.C.S.E, Kenya.
INTRODUCTION
It has been observed that Sustainable Development Goal Four (S.D.G 4) would be met if increase in access is supported by use of educational infrastructures and information communication technology to lead to quality learning outcomes (UNESCO, 2015). Principals perform activities that form a dynamic interrelationship among the school structures and stakeholders thereby depict the interconnectedness between them and a possible dependence of academic performance on them (Greatbatch and Tate, 2018). It is the argument of Vanblaere and Devos (2017) that the principal should provide instructional directions that would influence the teachers to show collective responsibility and practice reflective dialogue before, during and after presenting lessons to the learners to enable them to achieve higher academic grades. The key role of the principals is to provide direction, resources and support to teachers and students in order to enhance high quality teaching and learning outcomes (Stosich and Bristol, 2018). Therefore, leadership practices should focus on individual components of the instructional programs and other elements in the school that may influence classroom instruction and how such programs may also influence other factors in the school (Wallace Foundation, 2013) to result in the intended learning outcomes.
Similarly, Kenya Vision 2030 underscores the importance of education in ensuring relevant human and social capital for sustainable development (Republic of Kenya, 2019a). A glimpse of national trends of students’ performance in Kenya Certificate of Secondary Education (K.C.S.E.) from 2018 to 2022 is shown in Table 1.
Table 1: National analysis of K.C.S.E. performance by mean score and grades from 2018 to 2022
| Year | 2018 | 2019 | 2020 | 2021 | 2022 | AVERAGE |
| Mean score | 3.927 | 4.467 | 4.503 | 4.201 | 4.469 | 4.313 |
| Mean grade | D | D+ | D+ | D + | D+ | D+ |
Source: Adopted from Kenya National Examination Council, (2023).
Table 2 indicates that nationally, there was fluctuating candidates’ performances during 2018 to 2022 with the national average K.C.S.E performance within the five-year period standing at 4.313 which is a mean grade of D+. The low performance would not enable the exiting learners to compete favourably in nationally and internationally in both education and employment arena where high quality academic grades are demanded for employment and continued education (UNESCO, 2017). On the other hand, an improvement in academic performance may lead to increased future income to individuals and to the nation (Hanushek, 2011). Table 2 highlights the learners’ performance in K.C.S.E in all the Counties in Nyanza Region from 2018 to 2022.
Table 2: Learners’ Performance in K.C.S.E in Nyanza Region from 2018-2022.
| MEAN SCORES | |||||||
| COUNTY | 2018 | 2019 | 2020 | 2021 | 2022 | AVERAGE | MEAN GRADE |
| Siaya | 4.470 | 4.800 | 4.120 | 4.580 | 4.915 | 4.577 | D+ |
| Nyamira | 3.580 | 4.340 | 4.740 | 5.190 | 4.999 | 4.569 | D+ |
| Migori | 4.100 | 4.140 | 4.140 | 5.350 | 4.981 | 4.542 | D+ |
| Kisumu | 4.160 | 4.490 | 4.700 | 4.330 | 4.823 | 4.500 | D+ |
| Homa Bay | 3.690 | 4.680 | 4.760 | 4.980 | 4.343 | 4.491 | D+ |
| Kisii | 3.340 | 3.560 | 3.980 | 4.710 | 4.770 | 4.072 | D+ |
| Nyanza | 3.890 | 4.330 | 4.410 | 4.860 | 4.810 | 4.460 | D+ |
Source: Siaya County Education Office, 2022.
Table 3 indicates that performance in K.C.S.E across six Counties resembles the national trend with learning outcomes averaging a mean grade of D+ during the five year period. Comparatively Kisii County like other Counties posts a fluctuating mean scores and has the lowest average mean of 4.072 (D+) and far much lower than the national average of 4.313 (D+). It may also suggest that a large number of the candidates obtained grades D+ and below, which almost disqualifies them from pursuing any professional course (Republic of Kenya, 2018).
1.1 Statement of the problem
The Teachers’ Service Commission substantively appoints Principals to provide satisfactory quality leadership in public secondary schools in Kenya alongside introduction of performance contracting (P.C) for the principals and teacher performance appraisal and development (T.P.A.D) for all teachers (RoK, 2015) with a view to improve on the quality of learning outcomes. Despite this arrangement, there has been persistent low academic performance in K.C.S.E. in Kenya and the study locale. The low educational achievement suggests a lasting negative impact on individual lives and represents lost output for the national economy as a whole (Michel more and Dynarski, 2016) due to a reduced technical skilled human capital and increased low level of productivity. In the context of this study, it may suggest that learners exiting secondary school education might not be competitively absorbed in training institutions to acquire relevant knowledge and skills for their individual and national development (Hanushek, 2011). The government has prevailed upon education stakeholders to address the worrying trend of low academic performance (Republic of Kenya, 2019). Therefore, the researcher investigated the influence of principals’ leadership practices on academic performance in K.C.S.E in public schools in Kisii County to shed light on the persistent low average academic performance.
1.2 Purpose of the study
The purpose of this study was to investigate the influence of principals’ allocation of teaching and learning resources on learners’ academic performance in Kenya Certificate of Secondary Education (K.C.S.E.) in public schools in Kisii County.
1.3 Objective of the study
The study was guided by the following research objective;
- To establish the influence of principals’ allocation of teaching and learning resources on learners’ academic performance in K.C.S.E. in Kisii County, Kenya.
1.4 Hypothesis of the study
The study was guided by the following research hypothesis;
Ho1 To establish the influence of principals’ allocation of teaching and learning resources on learners’ academic performance in K.C.S.E. in Kisii County, Kenya.
1.5 Scope of the study
The current study was based on the influence of Principals’ allocation of teaching and learning resources on learners’ academic performance in public secondary schools in Kisii County. Secondary school Principals, Heads of Departments (Ho Ds) and Teachers were the participants in the study. The County is constituted by eleven sub-counties which are: Kisii Central, Kitutu Central, Kenyenya, Nyamache, Masaba South, Gucha, Gucha South, Kisii South, Etago, Sameta and Marani,
1.6 Theoretical framework
This study was anchored on Karl Ludwig von Bertalanffy (1968) General Systems Theory viewed from the perspective of Murphy et al., (2007) leadership for learning model. A system is a cohesive combination of interrelated and interdependent parts which can be natural or human-made and is composed of its subsystems, environment where it exists and the supra-system in a hierarchical dimension (Roth, 2019). General Systems Theory could be suitable in the management of public secondary schools in Kenya due to their being semi-autonomous institutions with various components such as the Board of Management (B.O.M). Externally, they relate with other agencies such as the Ministry of Education and the Teachers’ Service Commission (T.S.C.) in school management. The relevance of Bertalanffy (1968) General System’s theory when looked at through the lens of Murphy (2007) leadership for learning model emanates from the fact that principals’ promotion of professional development of teachers can influence learners’ academic performance in K.C.S.E. in Kisii County.
LITERATURE REVIEW
2.1 Staffing of subjects and learners’ academic performance in K.C.S.E.
Feng and Sass (2018) study in U.S.A. determined the efficacy of non-wage compensation scheme of Florida’s Critical Teacher Shortage Program (F.C.T.S.P.) on teacher retention. The study focused on loan forgiveness component and the one-time retention bonus of up to $1,200. The results of the study suggested that both loan forgiveness and short-term bonuses had substantial contribution in teacher retention among Mathematics, Science and Special Education. Specifically, there were a 10.4%, 8.9% and 32.2% in teacher retention respectively. Above all, the teachers who benefited from the two programs had a noticeable improvement in their job performance than those teachers who were ineligible. The reviewed study addressed teacher shortage mitigation measure via financial incentives that were offered through a government initiative in U.S.A., the current study explored how the principals approach staffing issues in their schools to the level of influencing learners’ academic performance.
Ayeni and Amanekwe (2018) study in Nigeria investigated the impact of teachers’ instructional workload management on students’ academic performance. It was a descriptive survey that used stratified random sampling technique to sample 12 schools, 12 principals and 120 teachers. The results of the study demonstrated that there was a negative correlation between teachers’ workload and students’ academic performance (r-cal=-0.420). The result indicated that teachers are overwhelmed with excess workload to the extent that they are unable to perform their core instructional duties and this contributes to low students’ academic achievement. The forgoing study dwelled on public and private secondary schools in Nigeria while this study was done in public secondary schools in Kenya because they are more directly influenced by the instructional policies from the national government than private schools.
Moreover, other studies in Kenyan context have found a considerable link between staffing and learners’ academic achievement. For instance Okemwa and Mudulia (2019) study which applied mixed method research design in Masaba South Sub- County revealed that teachers were inadequate making 12.5% of classes to go untaught and about 50% of the schools used volunteer teachers some of whom were unqualified to teach, resulting into poor academic performance in K.C.S.E in the study locale. Similarly, Adika and Sika (2019) study in Suba Sub- County identified that teachers’ workload significantly positively influenced academic performance (r = .523, N=154, p<0.01) and that for every one unit of increase in teachers workload, there was a decrease in academic performance at a coefficient (-.558). The reviewed studies did not consider other contextual factors such as school type and principals having been trained in school leadership before appointment that might contribute to academic performance. The current study considered the named factors to fill the gap. However, their findings have been confirmed by recent studies including Ireri et al., (2023) study whose sample size was 71 participants established that there was understaffing among the national schools in Kenya with staffing being statistically significantly correlated to academic performance (r=.372, p-value =0.05) and Likoko et al.,(2023) study in Trans Nzoia County whose sample size was 262 participants revealed that staffing status significantly influenced academic performance (β=0.644, p-value=0.000<0.05). Besides, improper staffing practices such as unclear transfer procedures by the Teachers’ Service Commission (Wanjala, 2019) have been noted by research to lower teachers’ morale in teaching in primary schools of Merti Sub-County and academic performance in K.C.S.E. in Kakamega County (Angote et al., 2023). Whereas the reviewed studies have made contributions in the body of knowledge, in the context of the current study, the studies of Ireri et al., (2023) and Likoko et al., (2023) had very small samples which rendered them to lack external validity, the current study applied a larger sample size to fill this gap while Wanjala (2019) study was done in primary school set up whose curriculum and other school internal factors defer to a large extent with those of secondary school level where the current study was based and Angote et al., (2023) study dwelt on the perception of teachers towards their transfer on academic performance thus failed to show clearly the association between transfers and academic performance.
2.2 Allocation of Information Communication Technologies and learners’ academic performance in K.C.S.E.
Wright and Reeves (2019) study in U.S.A examined the perspectives of institutional stakeholders at a state college in Florida on adoption of Open Educational Resources (O.E.R.). It had a sample size of 176 participants. Results of the study revealed that even though O.E. Rs has challenges such as time consuming, difficulty in getting links to get materials and acquiring license to use them, they are generally affordable, allow for creativity and flexibility, cost effective, accurate, make students fully engaged in, and enjoy their learning. The reviewed study dwelt on the perspectives of institutional stakeholders on the use of OERs in teaching and learning, the current study filled the gap by exploring the influence of ICT on learners’ academic performance. Similarly, impact of I.C.T. on academic performance have been confirmed to be significant by Park and Weng (2020) among the OECD countries.
According to Kasujja and Baluku (2020) study in Uganda that investigated ICT usage in teaching and its influence on students’ academic performance in Uganda Certificate of Education (UCE) in Kasese District, Uganda. The study used cross-section research design to collect data and chi-square to analyse quantitative data. There were 291 respondents for the study. The study revealed that accessibility and utilization of the ICT had positive and significant influence on students’ academic performance in U.C.E. Further, using the nominal-by-nominal contingency coefficient of 0.149 at significance level of 0.030(Sig<0.05), the study concluded that 14.9% of the students’ academic performance in U.C.E. could be attributed to the accessibility of ICT in the schools during teaching and learning. However, the study of Mugizi and Amwine (2020) in a private school context of Uganda found a positive but insignificant influence between application of ICT in collaborative teaching and learning and teachers’ job performance. The study recommended for more ICT facilities to be allocated to the teachers as opposed to school administration. The study of Kasujja and Baluka (2020) applied cross-sectional survey to study the influence of use of ICT on students’ academic performance, the current study applied explanatory sequential design while that of Mugizi and Amwine (2020) was done in a private school. Therefore, its results may not be universally applied in public schools as is the case of the current study.
Kipkoech and Mbugua (2019) study in Kenya investigated the cause of lack of improvement in academic performance in secondary schools in Taita- Taveta County, despite the implementation of I.C.T projects. The result indicated that there was a positive and statistically significant association between ICT infrastructure and academic performance among the secondary schools in Taita-Taveta County at p = 0.047 tested at 0.05 level of significance. It recommended that more ICT infrastructure should be distributed to the schools and intense training of teachers, school administrators and students should be rolled out to allow the school stakeholders be conversant with the ICT skills to enable for their beneficial use in the schools. The reviewed study majored on investigating the cause of lack of improvement in academic performance yet there is I.C.T project in secondary schools. The current study explored influence of allocation of teaching and learning resources on learners’ academic performance in Kenya. Moreover, Kimuya et al., (2021) cross –sectional survey in Nairobi County found out that there was a statistically significant association between teachers’ perception of principals enhancement of ICT in teaching and learning strategy and academic performance. However, Okemwa et al., (2020) which studied influence of B.O.M infrastructural development practices on academic performance in Nyamira County revealed that 60.2% of the students highlighted that there were no computer laboratories in their schools and this occurrence negatively affected academic performance.
2.3 Allocation of Science laboratories and learners’ academic performance in K.C.S.E.
In U.S.A. Smith, et al., (2020) investigated the difference of teaching Physics’ experimental skills and Physics’ content on students’ examination performance and acquisition of Physics’ experimental skills. The study involved exposing all students to attend the same theory lessons and do the same homework assignments and examinations. On the other hand, one group of students were enrolled in physics experimental lessons in the laboratories and the second group only attended physics theory reinforcement lessons. The study results indicated that there was no measurable difference between laboratory experimental experiences on examination performance. However, there was a marked measurable and significant positive change on students’ engagement in experimentation laboratory skills. The study concluded that using laboratory to teach experimental physics had a direct benefit on students’ acquisition of experimental skills and did not introduce any negative impact on course examination performance. The reviewed study used experimental comparative design whereby the researchers aimed at finding out the impact of exposing students to physics hands-on laboratory practical. The current study used explanatory sequential design to determine the effect of allocation of teaching and learning resources on teachers’ job performance in Kisii County.
Mosotho (2017) study in Lesotho assessed the availability of laboratory resources in readiness for the introduction of A-level Chemistry. It randomly sampled 263 first year students at the National University of Lesotho in the Faculties of Health Sciences, Agriculture and Science and Technology. It used questionnaires to collect data from the participants. The results of the study revealed that 90% of schools had physical laboratories but are not adequately used due to lack of materials. The reviewed study contacted former high school students to report about the state of laboratories in their former schools by use of one research instrument. The current study used the participants on the ground to report about the phenomenon under study, to guard against any reporting bias that maybe occasioned by use of former students that could be harbouring negative feelings about their former schools.
In Kenya, Chepkonga (2017) investigated the influence of learning facilities on the provision of quality education in public early childhood development education in West Pokot County. The study used mixed method research by employing questionnaires, checklist and interview guide. It sampled 4 education officers, 37 head teachers and 205 teachers. The study used both descriptive and inferential statistics to analyse collected data. The results of the study indicated that there was no statistically significant influence of learning facilities on the provision of quality education in West Pokot County. The computed value x2= 2.532, df=4 and p=0.687 and the critical value of x2=13.277, df=4 and p=0.01. In conclusion, the study noted that learning facilities in E.C.D.E centres in West Pokot do not result in improvement in the provision of quality education in the mentioned centres. Thus, the study recommended that the West Pokot County government should make it a priority to improve on construction of learning facilities to allow for the teachers to be able to provide quality education to the learner. However, the contributions of learning resources on academic performance have been found to be statistically significant by (Ondieki et al., 2020).
RESEARCH METHODOLOGY
3.1 Research design
This study applied Mixed Method Research design of explanatory sequential approach which involved prioritising quantitative phase over qualitative phase with data integration (Creswell & Creswell, 2018). Explanatory sequential approach was meant to identify potential predictive power of principals’ allocation of teaching and learning resources on students’ academic performance in K.C.S.E and to allow use of the results for purposefully selecting informants for the second phase (Creswell & Creswell, 2018) and construction of semi-structured interview schedule. The rationale for mixing in the current study was that neither quantitative nor qualitative methods were independently sufficient to capture the trends and details of the situation, such as a complex issue of influence of resources on learners’ academic performance in K.C.S.E. in the study locale. Subsequently, mixed method research approach was applied in this study for two reasons: convergence of data to enhance the research finding validity, thereby strengthened and enriched the study’s conclusions. Also as a complementary mechanism to allow the researcher gain deeper and complete understanding of the research problem and provide clarification of results found in the quantitative phase during qualitative phase and results integration (Creswell & Creswell, 2018).
Glykeria et al. (2024) asserts that researchers should always transparently answer research questions by using rigorous approaches they find suitable for the study design to support the exploration of the facts between variables and participants to be able to arrive at valid results. Therefore, in the first phase, the quantitative- numeric data was collected, using questionnaires and the data was subjected to descriptive and inferential statistics analysis while in the second phase, a qualitative approach which depended on the purposively identified quantitative results (Creswell, 2014) that needed more information gathering for better understanding, was used to collect text data through individual semi-structured interviews, to help explain and contextualize quantitative results such as why certain external and internal factors, tested in the first phase, may be significant predictors of the students’ academic performance in K.C.S.E. in Kisii County. The visual model of the procedures for the explanatory sequential approach is presented in Figure 1.
Figure 1: Steps of Explanatory Sequential Approach
Phase 1- Quantitative Phase 2- Qualitative
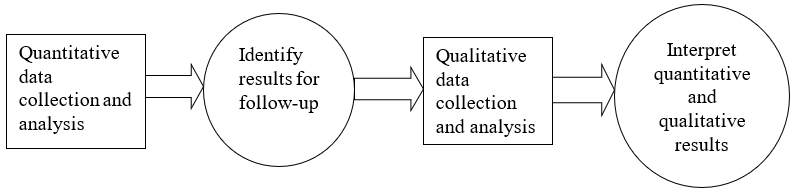
Source: Cres well and Cres well (2018).
Figure 1 shows how the explanatory sequential approach was implemented step by step. Priority in this design was given to the quantitative method, because it represents the major aspect of data collection and analysis in the study that will determine the relationship between the predictor variables and the outcome variable. A follow-up study was done during the second phase of data collection using qualitative approaches which focussed on explanations and contextualization of quantitative results by exploring in-depth about the text data concerning the four study objectives (Creswell, 2014).
In this study, first, integration was done at methods level by connecting whereby, the researcher first analysed the quantitative data, then used its findings to develop sampling criteria for the follow-up qualitative phase (Fetters et al., 2013). Specifically, Maximum Variation Sampling technique (M.V.S) was used to identify and purposively sample individuals who demonstrated higher, average and lower levels of academic performances in K.C.S.E. which enabled the researcher to juxtapose the reasoning patterns between the three groups of Principal respondents (Creswell, 2014). Secondly, integration was done at the interpretation and reporting level through the use of narratives and joint displays whereby the researcher described the findings in single report of quantitative and qualitative on one hand and on the other hand organised the findings in an integrated results matrix that was used to juxtapose both quantitative and qualitative findings to allow side-by-side comparisons and to provide evidence to support the researcher’s process of drawing meta-inferences and new insights about the research topic through contiguous approaches (Guetterman et al., 2015; Plano Clark and Sanders, 2015).
3.2 Study population
3.2.1 Schools
The target population of schools was 340 public secondary schools. The schools are in five categories; National schools, Special schools, Extra-county schools, County schools and Sub-County schools. Table 3 shows the distribution of schools in Kisii County.
Table 3: Summary of Target Population of Secondary schools
| Sub-county | Categories of schools | |||||
| National | Special | Extra County | County | Sub-county | TOTAL | |
| Kenyenya | 1 | 10 | 33 | 44 | ||
| Kitutu Central | 1 | 1 | 2 | 16 | 20 | |
| Kisii Central | 1 | 1 | 4 | 4 | 29 | 39 |
| Nyamache | 2 | 5 | 42 | 49 | ||
| Masaba South | 2 | 2 | 40 | 44 | ||
| Gucha | 1 | 2 | 18 | 21 | ||
| Gucha South | 4 | 3 | 14 | 21 | ||
| Kisii South | 6 | 9 | 18 | 33 | ||
| Etago | 1 | 2 | 14 | 17 | ||
| Sameta | 2 | 2 | 17 | 21 | ||
| Marani | 2 | 2 | 27 | 31 | ||
| TOTAL | 2 | 1 | 27 | 43 | 267 | 340 |
Source: Kisii County T.S.C. Office, (2023).
3.2.2 Respondents
According to the Kisii County Teachers’ Commission Office (2021), the County has 340 public secondary schools and 4,691 teachers which includes 340 principals, 1360 Heads of Departments (Ho Ds) and 2,991 are teachers. There fore the target population where the respondents were derived from is 4,691 people. Table 4 shows their distribution in the County.
Table 4: Target Study Populations
| Sub-counties | Schools | All Teachers on duty | Principals | HoDs | Teachers |
| Kenyenya | 44 | 534 | 44 | 176 | 314 |
| Kitutu Central | 20 | 378 | 20 | 80 | 278 |
| Kisii Central | 39 | 707 | 39 | 156 | 512 |
| Nyamache | 49 | 583 | 49 | 196 | 338 |
| Masaba South | 44 | 585 | 44 | 176 | 365 |
| Gucha | 21 | 251 | 21 | 84 | 146 |
| Gucha South | 21 | 312 | 21 | 84 | 207 |
| Kisii South | 33 | 488 | 33 | 132 | 323 |
| Etago | 17 | 182 | 17 | 68 | 97 |
| Semeta | 21 | 301 | 21 | 84 | 196 |
| Marani | 31 | 370 | 31 | 124 | 215 |
| TOTAL | 340 | 4691 | 340 | 1360 | 2,991 |
Source: Kisii County T.S.C Office, (2023).
Table 4 illustrates the distribution of schools and teachers in Kisii County. It has a total of 4,691 teachers. This includes school administrators and the assistant teachers. In terms of heads of Departments, there are four per school who are in charge of: Languages, Sciences and Mathematics, Humanities and Technical and Applied subjects (Republic of Kenya, 2018a). Furthermore, the distribution of all teachers across the sub-counties and categories of schools in Kisii County is as indicated in table 5.
Table 5: Distribution of teachers per school category in the Sub-Counties
| Sub-County | Category of schools | |||||
|
National |
Special | Extra-County | County | Sub-County | TOTAL | |
| Etago | – | – | 18 | 28 | 136 | 182 |
| Gucha | – | – | 24 | 32 | 195 | 251 |
| Gucha South | – | – | 102 | 52 | 158 | 312 |
| Kenyenya | – | – | 43 | 180 | 311 | 534 |
| Kisii Central | 88 | 11 | 148 | 110 | 350 | 707 |
| Kisii South | – | – | 158 | 131 | 199 | 488 |
| Kitutu Central | 86 | – | 9 | 49 | 234 | 378 |
| Marani | – | – | 37 | 23 | 310 | 370 |
| Masaba South | – | – | 101 | 32 | 452 | 585 |
| Nyamache | – | – | 37 | 106 | 440 | 583 |
| Sameta | – | – | 107 | 54 | 140 | 301 |
| TOTAL | 174 | 11 | 784 | 797 | 2,925 | 4,691 |
Source: Kisii County T.S.C Office, (2023).
Table 5 indicates that there is a total of 4,691 teachers. These are spread out in the Sub-Counties in terms of 174 teachers in the National schools, 11 teachers in the Special school, 784 teachers in the Extra-County schools, 797 teachers in the County schools and 2, 925 teachers in the Sub-County schools. It further shows that Sub-County schools have more than half the total number of teachers, suggesting that there are more Sub-County schools in Kisii County than any other type of school.
3.3 Sampling Techniques and Sample Size
Sampling is a statistical process of selecting a sub-set of participants from a target population of interest for the purpose of doing a scientific study to allow for making statistical inferences about the target population (Descombe, 2017). A sample is a sub-set of the target population selected by a researcher for the study whose findings should reflect the entire population characteristics (Kothari, 2013). Sample determination for any sample survey is based on objectives of the study, level of confidence of the desired estimates, size of the population and cost of enumeration (Yozgatligil & Ayhan, 2018) and characteristics of the population, procedures and approaches of data analysis (Taherdoost, 2017).
According to Taherdoost (2016), when conducting sampling, a researcher undertakes specific sequential stages which are: clearly defining the target population, selecting sample frame, choose sampling techniques and determining sample size to use as the sample for the study. Christensen et al., (2015) add that sample size should be balanced with the skills and resources of the researcher to avoid cases of diminishing returns setting in due to a very large sample size. Subsequently, in this study, sampling procedures were guided by availability of financial resources, time and how suitable they were to the research objectives and convenient in terms of skills to the researcher (Taylor et al., 2016).
The research approach of the study necessitated the use of different sampling techniques in each of the phases. In phase 1, stratified random sampling technique was used to arrive at the study sample of schools, Heads of Departments and the teachers because they occur inform of strata in the target population (Anol, 2012). Stratified random sampling is a form of probability sampling technique where the heterogeneous population is divided into homogeneous sub-populations called strata (Christensen, et al., 2015). A random sample is drawn from each stratum which then constitutes the sample size for the study when sample sizes from all the strata (sub-populations) are added. In this study, strata membership was determined by the school type of the individuals and the use of proportionate stratified random sampling to select cases to be included in the sample as per the size of each stratum in the target population (Anol, 2012).
During Phase 2 of the study for qualitative data collection, the sample was derived from the same participants in Phase 1 to allow for follow-up of the quantitative results to explore the results and explain the interactions between the variables (Creswell and Creswell, 2018). The researcher purposively identified and selected participants in the Quantitative phase (Creswell, 2014), through Maximum Variation Sampling technique (M.V.S.) to participate in Qualitative phase. Creswell (2014) indicates that Maximum Variation Sampling is a purposive sampling strategy whereby cases or individuals who differ on some aspects are sampled to provide expertise and rich opinions about the study phenomenon. According to Etikan (2016), Maximum Variation Sampling technique requires studying a subject from all the available perspectives to realise a better understanding of the phenomenon. It involves selecting participants across a broad range relating to the phenomenon under investigation. Correspondingly, Daniel (2019) suggests that while recruiting participants using Maximum Variation Sampling technique, the researcher should recruit those individuals who can provide different perspectives and settings about the phenomenon under investigation by first performing an initial assessment of the profiles of the potential participants, thus enhance data adequacy. Therefore, the researcher used Maximum Variation Sampling (M.V.S.) technique to select 18 Principals because they are knowledgeable and have rich information about the phenomenon under investigation (Creswell, 2014), to participate in the study based on the K.C.S.E average performance of their schools during the 2018 to 2022 period as indicated by the results of quantitative data. That is, Six Principals in each of these categories of mean scores 8.00 to 10.00, 5.00 to 7.99 and 1.00 to 4.99- being high, average and low performing schools respectively, resulting to six participants per category which gave a total of 18 participants to form the sample size for the Phase 2 thereby enhancing multiple perspectives of individuals to be captured (Omona, 2013).
3.3.1 Sample of the Schools
Mugenda and Mugenda (2008) recommends that 10% to 30% of the target population is adequate for a sample. Based on this guideline, 25% of the target population of the schools was selected for the study because their number is comparatively smaller (Cohen, 2011). Thus 85 schools were sampled for the study. The schools were proportionately sampled according to their types in the County. However, since National schools are only two and Special school being one, these two categories of schools were sampled through Census sampling technique. Therefore, to determine the samples of schools, Heads of Departments and teachers from the Sub-Counties, the following formula and procedure was used to arrive at the sample size for each stratum which eventually constituted the sample size for the study:
n = S (M/N)
Where:
n = number of units sampled from a given stratum
S = sample size
M= size of stratum of a given strata
N= size of population
(Adapted from Kothari, 2004).
Hence, the samples of schools for each type of schools are as follows:
82(27)/337=6.569=Sample size of Extra-County schools.
82(43)/337=10.462=Sample size of County schools.
82(267)/337=64.967=Sample size of Sub-County schools.
The total is 81.998 schools. Therefore, the sample size for the other schools for the study was 82, combined with two national schools and one Special school, the total number of schools in the sample was 85 schools.
In order to accord each potential school from the target population of schools equal chance of inclusion in the sample, the researcher assigned code numbers to each school in the stratum on a piece of paper, folded them and put all of them in a container. Schools were coded as per their category. For example: Extra-county schools were coded- EXT/KYYA/1, EXT/KYYA/2 and EXT/KYYA/3, being the Extra-county schools in Kenyenya Sub-county. The same procedure and process was applied for all the Sub-counties to get the required number of schools to represent each category of schools in the study sample by putting all the codes for all the sub-Counties in one container and picking them at random. Table 6 shows the sample of schools selected for the study.
Table 6: Sample size of schools by School Category
| School category | Population | Sample size | Sampling techniques | Percentage |
| National | 2 | 2 | Census | 100 |
| Special | 1 | 1 | Census | 100 |
| Extra-county | 27 | 6.569 | Simple random | 24.33 |
| County | 43 | 10.462 | Simple random | 24.33 |
| Sub-county | 267 | 64.967 | Simple random | 24.33 |
| TOTAL | 340 | 85 | 25.00 |
Source: Researcher, (2023)
3.3.2 Sample of the Principals
All the principals of the 85 sampled schools being the lead administrators of their schools and possess vital information for the study were purposively sampled to participate in the study.
3.3.3 Sample of the Heads of Departments
The sample sizes for heads of department and teachers were determined using Slovene’s sample size determination formula because their number is known.
n = N / (1 + Ne2)
Where, n = Sample size,
N = Total population and,
e = Error tolerance (Yamane, 1967).
In this study, the population of heads of departments and teachers (N) is 4,351, and e = 0.05, hence sample size n is determined at 366. Proportionate stratified simple random sampling technique was used to select the head of departments and teachers sample as per their spread in the categories of schools (Creswell and Creswell, 2018).
There are a total of 1360 Heads of Departments in Kisii County and 2,991 teachers. The 1360 Heads of departments is equivalent to 31.25% of the 4,351 people in the target population of teachers and heads of department, while 2,991 teachers is representing 68.74 % of the 4,351people. Therefore, in the remaining 366 sample (after subtracting the 85 sample of the principals), sample of heads of departments and teachers, were sampled proportionately through stratified random sampling technique. Thus;
366(1360)/4351=114.401=Sample size of Heads of Departments for the study.
366(2991)/4351=251.598=Sample size of teachers for National schools.
Hence 114 heads of departments and 252 teachers was sampled. Together the sample size of heads of departments and teachers is 366 respondents.
The actual samples of heads of department from each school category was calculated proportionately to ensure that the sample size represented the target populations as shown:
114(8)/1360=0.670= Sample size of Heads of Departments for National schools.
114(4)/1360=0.335= Sample size of Heads of Departments for Special school.
114(108)/1360=9.052= Sample size of Heads of Departments for Extra- County schools.
114(172)/1360=14.417=Heads of Department for County Schools.
114(1068)/1360=89.523=Heads of Departments for Sub-county schools.
The sample totals to 113.997 participants which approximately is 114 respondents for the study. In order to accord each potential member of the population equal chance of inclusion in the sample, the researcher assigned code numbers of each category in the stratum on a piece of paper, folded them and put all of them in a container. Schools were coded as per their Category, their Sub-Counties and the numbers of Head of Department on duty. For example: An Extra-county school from Kenyenya sub-county was coded- EXT/KYY/HD/K/1…, until the last Head of Department in a given school had been coded. This was done in all the schools in Kenyenya Sub-county and the same approach was applied to all the sub-counties in Kisii County. The researcher then put them in a container and picked them randomly. The first 114 individuals selected formed the Ho Ds’ sample for the study.
3.3.4 Sample of the Teachers
There are 2,991 teachers in public secondary schools in Kisii County. The sample of teachers was determined proportionately based on their school category during stratified random sampling to arrive at sample size of 252 teachers which were selected randomly to be representative of the target population of 2,991 teachers.
The proportionate samples for the teachers was:
252(164)/2,991=13.817= Sample size of Teachers for National schools.
252(6)/2,991=0.505= Sample size of Teachers for Special schools.
252(649)/2,991=54.680=Sample size of Teachers for Extra-County schools
252(582)/2,991=49.035=Sample size of Teachers for County schools.
252(1590)/2,991=133.961=Sample size of Teachers for Sub-County schools.
Finally the entire sample size of teachers for the proposed study was 250.998 which was equivalent to 251 teachers to be proportionately sampled. Table 7 shows sample size and sampling technique for every category of the respondents.
Table 7: Sample size and sampling techniques of respondents
| Principals | Ho Ds | Teachers | |
| Study population | 340 | 1360 | 2,991 |
| Sample size | 85 | 114 | 252 |
| Percentage (%) | 25 | 8.382 | 8.425 |
| Sampling technique | Purposive | Stratified random sampling | Stratified random sampling |
Source: Researcher, (2023).
As table 7 indicates purposive sampling technique was applied to sample 85 principals while stratified random sampling technique to sample 114 HoDs and 252 teachers for the study
3.4 Data collection instruments
Quantitative data were collected by use of Questionnaires while in-depth interview schedule was applied to collect qualitative data. This aided in testing the agreement of findings obtained from different sources and to enhance clarity and consistency of the findings (Creswell and Creswell, 2018).
3.5 Validity of research instruments
To ensure content, construct, criterion and face validities of instruments of this study, expert validation was applied (Taherhoost, 2016; Sangoseni, et al., 2012; Olson, 2010).
3.6 Reliability of research instruments
While reliability was achieved through Cronbach’s Coefficient Alpha for the Questionnaires which averaged at .781.
3.7 Data collection procedure
The researcher obtained introductory letter from the Board of Postgraduate Studies of Jaramogi Oginga Odinga University of Science and Technology to allow him get permit and licence from the National Commission for Science, Technology and Innovation and authority letter from JOOUST Ethics Review Committee. The above documents assisted the researcher to be permitted to conduct the pilot study and the main study by the County Commissioner-Kisii, County Director of Education-Kisii, and principals of the sampled schools, Heads of Departments and teachers. The Principals who were sampled for the study were consulted in readiness for the study and assisted the researcher to seek consent of HoDs and teachers to participate in the study.
FINDINGS AND DISCUSSION
4.1 Phase 1- Quantitative research findings
To realize this objective, the respondents were first asked to express their opinions on the frequency of teachers’ transfer from their schools. The results are presented in Figure 1.
Figure 1: Frequency of teacher transfers.
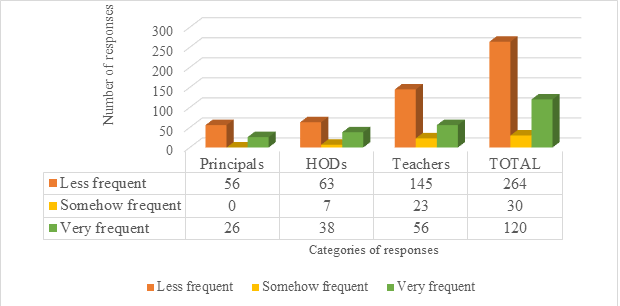
Source: Field Data, (2023)
Figure 1 shows that 145(35.02%) of the respondents indicated that teachers are transferred less frequently, 23(5.56%) somehow frequent, 56(13.52%) very frequently. Collectively, respondents were in agreement that the rate at which teachers get transferred was not so high to impact on instructional delivery. Research studies have established that frequent teacher turn-over in a school lowers academic performance especially when high performing principals or teachers are transferred from a school without equal replacement (Bleustein and Goldschmidt, 2021). This research finding suggest that there is staffing stability in schools in the study locale and that the period teachers spend in a particular school, may provide them with a chance to be accustomed with the established school climate to be able to perform well(Wanjala, 2019).
During the interviews, the respondents were in agreement with the quantitative findings. For example one of them said:
Teachers’ transfers have not been so frequent in my school. A similar trend is experienced in many of our schools. Most transfers are usually done at the end of the year so that curriculum delivery is not affected (P11).
4.2 Duration it takes to replace a teacher who has been transferred
Respondents were further asked to indicate the duration it takes for a transferred teacher to be replaced. Their responses are in figure 2.
Figure 2: Duration taken before a transferred teacher is replaced
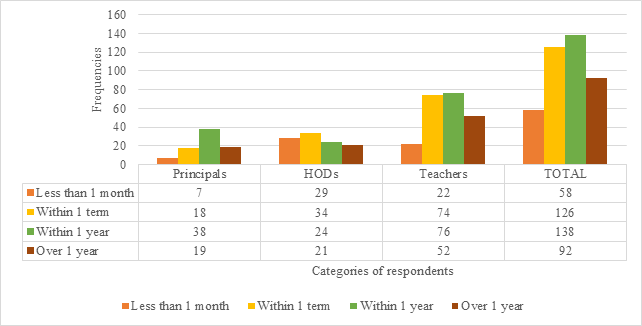
Source: Field Data, (2023)
Figure 1 show that 58(14%) of respondents indicated that replacing a transferred teacher would take less than one month, 126(30.43%) within one term, 138(33.33%), noted that it would be done within one year and 92(22.22%) noted that it would take over one year to replace a transferred. The finding of this study is concurrence with those of (Adika and Sika, 2019 and Ireri et al., 2023), which found out that when there is adequate staff there would timely syllabus coverage to result in good academic performance. This research findings suggest that the T.S.C. ensures that teachers who are transferred from schools are replaced as soon as possible so that the quality of teaching is not compromised due to teacher shortage because research findings have discovered that increasing teachers’ workload leads to a decrease in academic performance (Adika and Sika, 2019). Similarly, the study of Wanjala (2019) discovered that unclear transfer policies of the T.S.C. reduced academic performance in Primary schools of Merti Sub-County.
During the interviews, the respondents highlighted that teachers being the first school related factor that influence academic performance, they ensure that the schools are well staffed by the T.S.C and in case of delays in replacing transferred teachers, the school employs Board of Management (B.O.M) teachers. For instance, an Extra-County school principal said:
I make sure my school is well staffed by either the T.S.C. or the B.O.M to enhance the quality of classroom instructions for without teachers, there will be no teaching and learning (P8).
4.3 Responses on the influence of Principals’ allocation of teaching and learning resources on learners’ academic performance in K.C.S.E. in Kisii County.
The study also sought the opinion of the respondents on the influence of principals’ allocation of teaching and learning resources on learners’ academic performance in K.C.S.E in Kisii County. Their responses are in Table 3.
Table 3: Descriptive statistics on ways by which principals’ allocation of resources influences learners’ academic performance in K.C.S.E.
| N | Minimum | Maximum | Mean | Std. Deviation | |
| Ensure every department is well staffed with competent teachers to allow for good quality instructional delivery | 414 | 1 | 5 | 4.38 | .755 |
| Avail all the teaching and learning resources to realize effective instructional delivery | 414 | 1 | 5 | 4.14 | .862 |
| Have availed the laboratories for all the technical subjects to enable good quality teaching to improve on learning outcomes | 414 | 1 | 5 | 3.79 | 1.100 |
| Have installed the ICT devices and facilities in the school | 414 | 1 | 5 | 3.39 | 1.266 |
| Have ensured that teachers have the necessary capacity to use the ICT devices in instructional programs | 414 | 1 | 5 | 3.33 | 1.192 |
| Have adequate power supply for ICT use in the school | 414 | 1 | 5 | 3.45 | 1.255 |
| Have adequate internet connectivity for use to integration ICT in the lessons | 414 | 1 | 5 | 3.08 | 1.336 |
| .Do remind teachers to use ICT in lesson delivery to make teaching and learning to be interactive to promote learning | 414 | 1 | 5 | 3.36 | 1.184 |
| Ensure teachers use laboratories to offer practical lessons | 414 | 1 | 5 | 4.02 | .991 |
| Encourage teachers to engage learners in practical lessons to allow them acquire the 21st Century skills | 414 | 1 | 5 | 4.15 | .911 |
| Comply with school’s teaching and learning resources needs when making financial decisions | 414 | 1 | 5 | 4.12 | .946 |
| Continuously involve other stakeholders in the teaching and learning of learners | 414 | 1 | 5 | 4.19 | .902 |
| Valid N (List wise) | 414 | 1 | 5 | 3.78 | 1.06 |
Source: Field Data, (2023).
According to table 6, the influence of principals’ allocation of teaching and learning resources on learners’ academic performance in K.C.S.E. is high (M= 3.78; SD= 1.06). Likewise the respondents agree that; Principals ensure every department is well staffed with competent teachers to allow for good quality instructional delivery(M=4.38 SD= 0.75), Avail all the teaching and learning resources to realize effective instructional delivery(M= 4.14 SD= 0.862), Have availed the laboratories for all the technical subjects to enable good quality teaching to improve on learning outcomes(M=3.79 SD=1.100), Have installed the ICT devices and facilities in the school (M= 3.39 SD =1.266), Have ensured that teachers have the necessary capacity to use the ICT devices in instructional programs(M=3.33 SD =1.192), Have adequate power supply for ICT use in the school(M= 3.45 SD = 1.255), Have adequate internet connectivity for use to integration ICT in the lessons(M= 3.08 SD =1.336), Do remind teachers to use ICT in lesson delivery to make teaching and learning to be interactive to promote learning(M= 3.36 SD =1.184), Ensure teachers use laboratories to offer practical lessons(M=4.02 SD = 0.991), Encourage teachers to engage learners in practical lessons to allow them acquire the 21st Century skills(M=4.15 SD = 0.911), Comply with school’s teaching and learning resources needs when making financial decisions(M= 4.12 SD =0.946), Continuously involve other stakeholders in the teaching and learning of learners(M= 4.19 SD = 0.902). These findings are in agreement with those of Kipkoech and Mbungua (2019), which reported that availability and skilful use of teaching and learning resources influence learning outcomes. The research findings that the (M= 3.78; SD=1.06) suggest that with proper training of teachers and willingness to use the available teaching and learning resources, academic performance would improve ( Abdurrauf et al., 2019). Similarly, Konyango et al. (2018) study had concluded that inadequate qualified physics teachers and laboratory equipment had contributed to poor academic performance in Physics in Ugenya Sub-County.
During the interviews the respondents indicated that they avail the teaching and learning resources to support instructional programmes. For example one of them said;
My school prioritizes procurement and utilization of teaching and learning resources by both teachers and learners to ensure that curriculum is properly implemented (P16).
However, other respondents expressed that they face financial constrains when they want ot avail the teaching and learning resources in the schools. For example one reported that:
In adequate funding hinders teaching and learning resources acquisition in our schools. So we find ourselves in situations whereby a school cannot purchase resources required for teaching the learners so teachers end up improvising or forego the practical lessons and handle theoretical (P14).
4.4 Correlation between principals’ allocation of teaching and learning resources and learners’ academic performance in K.C.S.E.
The study also sought to find out on whether allocation of teaching and learning resources influence academic performance in K.C.S.E by application of Pearson’s Product Moment Correlation test and a simple coefficient of correlation was computed and results are shown in Table 4.
Table 4: Pearson correlation analysis to establish the influence of principals’ allocation of teaching and learning resources on learners’ academic performance in K.C.S.E.
| Allocation of teaching and learning resources | KCSE MEAN SCORE | ||
| Allocation of teaching and learning resources | Pearson Correlation | 1 | .072 |
| Sig. (2-tailed) | .143 | ||
| KCSE MEAN SCORE | Pearson Correlation | .072 | 1 |
| Sig. (2-tailed) | .143 | ||
Source: Field Data, (2023).
According to table 4, there is a moderate positive but insignificant relationships found between principals’ allocation of teaching and learning resources and learners’ academic performance in K.C.S.E. (.072, p>0.05; 2-tailed). These results concur with the findings of Park and Weng (2020) among the OECD countries which found out that resources use by students leads to positive change in performance. The finding imply that the principals’ allocation of teaching and learning resources may contribute to better academic performance as it has been confirmed by other studies (Othoo et al., 2019). Similarly, Asiago (2018) study discovered that physical facilities have a positive significant relationship with academic performance in K.C.S.E.
The interviews held with the respondents further shed light on this phenomenon and indicated that school face challenges of resources acquisition due to lack of funds to the extent that the few resources available do not serve in all instructional programmes. One of them said:
Lack of finances hinders principals from ensuring that the schools have adequate teaching and learning resources and this affects effective curriculum delivery (P3).
4.5 Hypothesis testing.
This study aimed at determining the influence of principals’ allocation of teaching and learning resources on learners’ academic performance in K.C.S.E. in Kisii County. Based on this objective, the following hypothesis was tested.
Ho1 Principals’ allocation of teaching and learning resources does not influence learners’ academic performance in K.C.S.E. in Kisii County.
The influence of Principals’ allocation of teaching and learning resources on learners’ academic performance in K.C.S.E. shown in Table 8 was determined using Pearson’s Correlation Coefficient method. The results computed by SPSS version 29 computer programme were r = .072, p>.05. These results show that principals’ allocation of teaching and learning resources was not significantly correlated to academic performance in K.C.S.E. Therefore it does not influence learners’ academic performance in K.C.S.E in Kisii County since p>.05 at 95% confidence level. It might suggest that the allocation of teaching and learning resources done in the Secondary schools are not effective in resulting to a positive change in teachers’ classroom practices to contribute in high quality learning outcomes because they are not adequately supplied to schools due to high enrolment in most of the schools (Bos et al., 2022). Angote et al. (2023) indicates that forced transfer of teachers render schools to be understaffed resulting to poor academic results. This suggests that schools with less number of teachers do not perform well in examinations.
The linear regression model is expressed as:
Y = β0+β1X1+ϵ
Where,
Y = Learners’ academic performance in K.C.S.E.
β0 = Constant term, that is the predicted value of learners’ academic performance if allocation of teaching and learning resources is zero.
β4 = Beta coefficient (contribution of allocation of teaching and learning resources on learners’ academic performance.
X4 = Principals’ allocation of teaching and learning resources.
ϵ = Standard error (other variables that may influence learners’ academic performance but are not included in the model and are assumed not to interfere with allocation of teaching and learning resources for example, principals’ self-efficacy.
4.6 Regression Analysis and Hypothesis Testing
The direction of the relationship between Principals’ allocation teaching and learning resources on learners’ performance in K.C.S.E was also analysed. Table 5 presents the coefficients and model summary.
Table 5: Regression results of influence of allocation of teaching and learning resources on learners’ academic performance in K.C.S.E.
Model Fitness
| Model | R | R Square | Adjusted R Square | Std. Error of the Estimate | Change Statistics | ||||
| R Square Change | F Change | df1 | df2 | Sig. F Change | |||||
| 1 | .072a | .005 | .003 | 25.17060 | .005 | 2.152 | 1 | 412 | .143 |
| a. Predictors: (Constant), Principal’s allocation of teaching and learning resources | |||||||||
| b. Dependent Variable: KCSE MEAN SCORE | |||||||||
Source: Field data, (2023).
From Table 5, it can be observed that allocation of teaching and learning resources had a moderate positive influence on academic performance in K.C.S.E. but was insignificant, (r =.072, N =412, p>.05). Therefore the null hypothesis that principals’ allocation of teaching and learning resources do not influence learners’ academic performance in K.C.S.E. was upheld and the alternative hypothesis allocation of teaching and learning resources influence earners’ academic performance in K.C.S.E. was rejected. Correspondingly, Okemwa et al., (2020) study in Nyamira County identified that inadequate infrastructural facilities negatively affects academic performance. The research finding suggest that other factors including Principals’ leadership style and school context (Bos et al., 2022) may influence academic performance as indicated by the standard error of estimate (ε) which is 25.17060, suggesting that there were other factors of the magnitude of 25.17060that might influence learners’ academic performance in K.C.S.E. that were not observed by this study. Furthermore, the findings suggest that adequacy and proper use of teaching and learning resources may result in improvement in learning outcomes as indicated by the studies of (Othoo et al., 2019). With provision of incentives, principals would be in a position to attract and retain teachers in the schools (Ajani et al., 2023).
During the interviews, the respondents indicated that academic performance depended on resources in the schools. For example, one principal emphasized that;
Schools which have adequate teaching and learning resources including teachers, laboratories and I.C.T technologies perform better than those which do not have the resources (P12).
The study also investigated whether principals’ allocation of teaching and learning resources predicts learning outcomes in K.C.S.E. The results are shown in table 6.
Table 6: Analysis of Variance of principals’ allocation of teaching and learning resources and learners’ academic performance in K.C.S.E
| Model | Sum of Squares | df | Mean Square | F | Sig. | |
| 1 | Regression | 1363.403 | 1 | 1363.403 | 2.152 | .143b |
| Residual | 261026.343 | 412 | 633.559 | |||
| Total | 262389.746 | 413 | ||||
| a. Dependent Variable: KCSE MEAN SCORE | ||||||
| b. Predictors: (Constant), Allocation of teaching and learning resources | ||||||
Source: Field Data, (2023).
Table 6 indicates that principals’ allocation of teaching and learning resources was not a significant predictor of learners’ academic performance in K.C.S.E. [F (1, 412) = 2.152, p>0.05]. This finding agree with Okemwa et al., (2020) which discovered that inadequate teaching and learning resources negatively affects academic performance. Contrastingly, the study of Ondieki et al., (2020) in Kenya confirms that allocation instructional resources lead to positive improvement in mastery of number activities among the pre-primary learners. The result of the current study may imply that teaching and learning resources are either inadequate or are not adequately used by the teachers and learners during the lessons as it has been established by research studies of (Kamau et al., 2018) that the absence of use of instructional resources results in low academic performance. This assertion is supported by Okemwa and Mudulia (2019) study which found out that employment of untrained teachers due to under staffing contributes to poor academic performance in K.C.S.E. in Masaba South Sub-County.
During the interviews, the respondents revealed that teaching and learning resources maybe available in the school but may not be adequately used in the classrooms due to lack of proper training of the teachers. For example, one Sub-County school principal noted;
Due to inadequate pedagogical content knowledge, some teachers either do not use I.C.T. technologies or teach practical subjects practically leaving learners to struggle during exams and eventually perform poorly because of being unprepared(P5).
The study also investigated the contribution of principals’ allocation of teaching and learning resources on academic performance in K.C.S.E. The results are presented in table 7.
Table 7: Linear regression analysis to establish the contribution of principals’ allocation of teaching and learning resources on learners’ academic performance in K.C.S.E.
| Model | Unstandardized Coefficients | Standardized Coefficients | t | Sig. | 95.0% Confidence Interval for B | |||
| B | Std. Error | Beta | Lower Bound | Upper Bound | ||||
| 1 | (Constant) | -3.988 | 6.228 | -.640 | .522 | -16.231 | 8.254 | |
| Influence of principals’ allocation of teaching and learning resources on learners’ academic performance in K.C.S.E. | 2.367 | 1.613 | .072 | 1.467 | .143 | -.805 | 5.538 | |
| a. Dependent Variable: KCSE MEAN SCORE | ||||||||
Source: Field Data, (2023).
Table 7 indicates that allocation of teaching and learning resources which is Y = -3.988+ 2.367 X1, means that for every one unit increase in allocation of teaching and learning resources, there was an increase in academic performance in K.C.S.E by 2.367 units. The findings of this study are in concurrence with Mosotho (2017) study in Lesotho and Chepkonga (2017) in Kenya which separately discovered that availability of Laboratories for Science subject and teaching and learning resources in E.C.D.E. centres do not significantly contribute to learning outcomes respectively because teachers are reluctant to use them or they are inadequate. This research findings suggest that availability of teaching and learning resources alone may not produce good academic results if supervision of instruction by the principal to inform how they are used, teachers’ skills and whether they are adequate (Kamau et al., 2018). Likewise Kimuya et al. (2021) study found out that enhancement of use of ICT in teaching and learning by the principals contributes to positive academic performance in K.C.S.E in Nairobi County.
During the interviews, the respondents disclosed that in some cases the teaching and learning resources such as I.C.T. technologies are not adequate for the instructional programmes while in other cases, it is lack of teacher commitment to implement the curriculum as required due to poor attitude. For example one respondent said:
We lack I.C.T. technologies for the teachers to integrate lessons. However, some of our teachers are not fully committed to teach (P8).
4.7 Phase 2: Qualitative research findings
The objective of this study was to establish the influence of Principals’ allocation of teachers and learning resources on learners’ academic performance. This objective had two research questions. The first question sought information on what influences Principals’ allocation of teaching and learning resources while the second research question was; how does the allocation of the resources link with learners’ academic performance in K.C.S.E.
On the first research question, the respondents reported that what mostly influence their allocation of learning resources such as classrooms, laboratories and teachers were; the school need for the resource and availability of finance. One of the respondents reported:
At my school we always do stock taking at the end of the year to find out the status of our teaching and learning resources in terms of quantity and state in the case of physical facilities and learning materials such as books. On the other hand we determine Curriculum based establishment (C.B.E) per subject area (P6).
Similarly, another respondent noted that:
Availability of finance controls what we need to buy. Many at times we have a lot to be bought and allocate to the teachers and learners but inadequate finance hinders our plans to buy very critical items including ICT devices, laboratory materials and hiring new teaching staff in under staffed subjects and departments (P13).
The reports of the respondents suggest that whereas the Principals are guided by school needs when they allocate teaching and learning resources, inadequate finances hinders them from acquiring them and allocating to the teachers and learners. This findings concurs with that of Othoo et al., (2019) which found out that inadequate financial base of a school impacts negatively on allocation of teaching and learning resources.
On the link between allocation of teaching and learning resources with learners’ academic performance in K.C.S.E, the respondents noted that when the resources are allocated in time and prudently used by the teachers and learners, improvement in learning outcomes is realized. One of the respondents said:
Adequate and equitable allocation of teaching and learning resources accompanied by good use during teaching and learning improves academic performance (P5).
Another respondent added that:
The change in teacher –student ratio from 1:76 to 1:52 and availability of laboratories in my school contributed to improved performance in K.C.S.E. from a mean of 3.961 in 2017 to a mean of 4.275 in 2018 (P8).
These findings are in concurrence with the findings of quantitative study which revealed that allocation of teaching and learning resources has a positive correlation with learners’ academic performance in K.C.S.E. It is also in agreement with the findings of Okey (2020) study which reported that resources are a critical components of quality education. Similarly Mogaka (2019) study revealed that availability and utilization of physics laboratory equipment had a relationship with students’ academic achievement.
4.8 Quantitative and qualitative results triangulation matrix
The results of integration at interpretation stage are presented in table 8 in form of a matrix.
Table 8: Quantitative and Qualitative results integration matrix
| No | Objective and Hypotheses | Quantitative results | Qualitative results | Inferences |
| 1 | To establish the influence of principals’ allocation of teaching and learning resources on learners’ academic performance in K.C.S.E. in Kisii County.
Ho4 Principals’ allocation of teaching and learning resources does not influence learners’ academic performance in K.C.S.E. in Kisii County. |
-That allocation of teaching and learning resources –It had a moderate positive influence on academic performance in K.C.S.E but was insignificant, (r =.072, N =412, p>.05). Therefore the null hypothesis was upheld.
These results concur with the findings of Dianz et al., (2019) study in the Canary Islands and Park and Weng (2020) among the OECD and with that of Ondieki et al., (2020) in Kenya which confirms that allocation instructional resources lead to positive improvement in mastery of number activities among the pre-primary learners. |
-Adequate and equitable allocation of teaching and learning resources accompanied by good use during teaching and learning improves academic performance.(P5).
-The change in teacher –student ratio from 1:76 to 1:52 and availability of laboratories in my school contributed to improved performance in K.C.S.E. from a mean of 3.461 in 2017 to a mean of 4.725 in 2018. (P8). |
The findings are also in agreement with the findings of Okey (2020) study which reported that resources are a critical components of quality education. Similarly Mogaka (2019) study revealed that availability and utilization of physics laboratory equipment had a relationship with students’ academic achievement. |
Source: Field Data, (2023).
According to table 8, the inferential statistics obtained in the first phase of the study shows that Principals’ allocation of teaching and learning resources had a weak positive correlation with learners’ academic performance but was not significant in contributing to academic performance in K.C.S.E. Qualitative findings also confirmed that only if the resources are strategically and equitably allocated would they contribute significantly to a positive change performance.
CONCLUSION
The objectiveof this study was to determine the influence of Principals’ allocation of teaching and learning resources on learners’ academic performance in K.C.S.E. The Quantitative results indicates that allocation of teaching and learning resources has a weak positive insignificant relationships with learners’ academic performance in K.C.S.E. (.072, p>0.05; 2-tailed). Additionally, it was found out that it had a moderate positive and insignificant influence on academic performance in K.C.S.E., (r =.072, N =412, p>.05). Therefore, results further indicate that it was not a significant predictor of learners’ academic performance in K.C.S.E. [F (1, 412) = 2.152, p>0.05]. Furthermore, result indicates that allocation of teaching and learning resources which is Y = -3.988+ 2.367X1, means that for every one unit increase in allocation of teaching and learning resources, there was an increase in academic performance in K.C.S.E. by 2.367 units. Inadequate quantity of teaching and learning resources and teachers’ failure to use them due to unpreparedness was revealed by the qualitative results to be hampering efforts for improvement in academic performance in K.C.S.E. Hence, both the quantitative and qualitative findings concur that allocation of teaching and learning resources had a weak positive association with learners’ academic performance in K.C.S.E. but it is a significant predict learners’ academic performance. Therefore, Principals’ allocation of teaching and learning resources was found to have a weak positive association with learners’ academic performance in K.C.S.E. This study concluded that if the resources are strategically allocated and properly used, they may have a significant contribution to academic performance in the study locale. In view of the research findings, it is evident that the principals and other stakeholders of the school must established a collaborative approach in managing learning programmes because the school exist in form of system whose components should be connected promote improvements in learning outcomes.
RECOMMENDATIONS
Adequate funds to be allocated in learning institutions for construction of more teaching and learning resources such as classrooms, laboratories and employment of more teachers. Furthermore, procurement, allocation and utilization of teaching and learning resources should be done considering school curriculum needs to be able to contribute to a positive change in learners’ academic performance. Similarly, the empirical results reported herein should be considered in light of the following limitation: The first, the research process was affected by time constrains because permission that was granted to the researcher by the employer was short and this forced for arrangements to be made with respondents to be contacted even during the week ends. Secondly, self-reported data from the respondents might have been affected by attribution occurrences, this phenomenon was addressed by cross checking the information between different sources. This study suggests that future studies should be accorded long periods of time and varieties of research instruments.
REFERENCE
- Abdurrauf, I. R., Alhassan, N., and Jibril, J. (2019). Availability and utilization of Biology laboratory equipment in Senior Secondary Schools in Zaira Educational Zone, Kaduna State, Nigeria. Journal of Science Technology and Education, 7(3), 213-219.
- Adika, B. R., and Sika, J. O. (2019). Determining influence of teachers’ workload on academic performance in secondary schools in Suba Sub-County, Kenya. Advances in Social Sciences Research Journal, 6(3), 287-296.
- Angote, A. O., Yambo, J. M.O., and Sika, J. O. (2023). Perception of teachers towards their transfer on students’ academic achievement in public secondary schools in Kakamega County. Journal of Education, Society and Behavioural Science, 36(2), 25-38.
- Anol, B. (2012). Social science research: Principals, Methods and Practices. ISBN 13:978-1475146127, University of South Florida, Tampa, Florida, U.S.A.
- Ajani, A.O., Muremela, M.G., Kutame, A.P, and Kapueja I. S.(2023). Can school principal manage recruitment and retention of Maths and Science teachers in rural secondary school? A Case study in the Vhembe district, South Africa. International Journal of Social Science Research and Review, 6(9), 42-60. http://dx.doi.org/10.47814/ijssrr.v6i9.1592
- Ayeni, A. J., and Akinfolarin, C. A. (2014). Assessing principals’ coordinating and controlling strategies for effective teaching and quality learning outcomes in secondary schools, Ondo state, Nigeria. International Journal of Learning, Teaching and Educational Research. 7(1), 180-200.
- Bluestein, S.B., and Goldschmidt, P. (2021). Principals’ effects on academic progress over time and the potential effects of school context and principals’ leadership practices. Journal of School Administration Research and Development, 6(1), 12-23.
- Bos, W., Ning, B., and Chen, D. (2022). Relationship between principals’ leadership style and student achievement: A comparative study between German and China. Sage Open (2022), 1-18.
- Chepkonga, M. C. (2017). Influence of learning facilities on provision of quality education in Early Centres of Development (E.C.D.) in Kenya. International Journal of Education and Research, 5(6), 15-27.
- Christensen, L. B., Johnson, R.K., and Turner, L. A. (2015). Research methods, design and analysis. (Aypay Translation Ed.) Ankara, Ani. Publishing.
- Cohen, L., Manion, L., and Morrison, K. (2011). Research methods in education. (7th ed.). New York, NY: Routledge.
- Creswell, J.W. (2014). Research design: Qualitative, quantitative and mixed methods approaches (4th Ed). Thousand Oaks, California: Sage Publications.
- Creswell, J. W., and Creswell, J. D. (2018). Research design: qualitative, quantitative and mixed methods approaches (5thed.). Thousand Oaks, CA Sage Publications.
- Daniel, B. K. (2019). Student experiences of the maximum variation framework for determining sample size in qualitative research. In A. Stacy (Ed.), Proceedings of the 18th European conference on research methodology for business and management studies 20th -21st June 2019 (92-100). University of the Witwatersrand, Wits Business School, Johannesburg, South Africa. Academic conferences and publishing international limited. doi.10.34190/ RM.19.075.
- Descombe, M. (2017). The good research guide: For small-scale social research projects. 6th Ed. London: Open University Press.
- Etikan, I. (2016). Comparison of Convenience Sampling and Purposive Sampling. American Journal of Theoretical and Applied Statistics, 5 (1), 1. https://doi.org/10.11648/ j.ajtas. 20160501.11
- Feng, L., and Sass, T. R. (2018). The impact of incentives to recruit and retain teachers in hard-to staff subjects. Journal of Policy Analysis and Management, 37(1), 112-135. Doi: 10.1002/pam.22037.
- Fetters, M. D., Curry, L. A., and Creswell, J. W. (2013). Achieving integration in mixed methods designs principles and practices. Health Services Research, 48, 2134-2156.
- Glykeria, S., Andrew, K., Christine, C., and Charlotte, W. (2024). The concept of integration in mixed methods research: A step-by-step guide using an example study in physiotherapy, Physiotherapy Theory and Practice, 40(2), 197-204, DOI: 10.1080/09593985.2022.2120375 https://doi.org/10.1080/09593985.2022.2120375
- Greatbatch, D., and Tate, S. (2018). Evidence on school leadership in an international context. Government social research, Department of Education, U.K . ISBN: 978-1-78105-903-6
- Grissom, J. A., Anna J. E., and Constance A. L. (2021). How Principals Affect Students and Schools: A Systematic Synthesis of Two Decades of Research. New York: The Wallace Foundation. http://www.wallacefoundation.org/principalsynthesis.
- Guetterman, T. C., Fetters, M. D., and Creswell, J. W. (2015). Integrating quantitative and qualitative results in health science mixed methods research through joint displays. Annals of Family Medicine, 13, 554-561.
- Hanushek, E. A. (2011). The economic value of higher teacher quality: Economics of Education Review, doi:10.1016/j.econedurev.2010.12.006
- Ireri, E. M., Mukirae, N. and Otieno, M. (2022). Influence of Infrastructural Facilities and Staffing on Students’ Academic Performance in National Secondary Schools in Kenya. East African Journal of Education Studies, 5(2), 175-185.https://doi.org/ 10.37284 /eajes. 5.2.708.
- Kamau, L. M., Mwama, J., Njue, A. K.(2018). Technological resources for teaching secondary Mathematics: Lessons from early and late adopters of technology in Kenya. Asian Journal of Contemporary Education, 2(1), 43-52.
- Kasujja, P. J., and Baluku, E. (2020). Information communication technologies usage in teaching and its influence on students’ academic performance in Uganda Certificate of Education (UCE) in Kasese district. International Journal of Education and Research, 8(2), 1-40, https://www.ijem.com
- Kimuya, C. M., Kimani, G., and Mwaura, J. (2021). Relationship between teachers’ perception of principals’ enhancement of ICT in teaching and learning strategy and students’ academic performance in public secondary schools in Nairobi County, Kenya. European Journal of Education Studies, 8(6), 166-182.
- Kipkoech, K. C., and Mbugua, J. (2019). Influence of information communication technology (ICT) project implementation on academic performance in public secondary schools in Taita-Taveta County, Kenya. Journal of Entrepreneurship and Project Management, 3(6), 51-71.
- Kothari, C. R. (2013). Research methodology, methods and techniques, (2nd Revised Edition). New Delhi: New Age International Publishers, New Delhi.
- Likoko, S., Maiyo, J., and Bulowa, J. (2023). Influence of staffing status on academic performance in public secondary schools in Trans-Nzoia County in Kenya. International Journal of Trends in Scientific Research and Development, 7(4), 1426-1434.
- Michelmore, K., and Dynarski, S. (2016). The gap within the gap: Using longitudinal data to understand income differences in student achievement, NBER Working Paper No.22474.
- Mogaka, M. M. (2019). Availability and utilization of Physical laboratory equipment on academic achievement of students in public day secondary schools. International Journal of Research and Innovation in Social Sciences, 3(8), 438-41.
- Mosotho, J. G. (2017). Assessing the level of Laboratory resources for teaching and learning of Chemistry at Advanced Level in Lesotho Secondary schools. South African Journal of Chemistry, 70, 154-162.
- Mugenda, O., and Mugenda, A. (2008). Research methods: Quantitative and Qualitative Approaches. Nairobi, African centre for technology studies (Acts) Press.
- Mugizi, W., and Amwine, C. M. (2020). Information Communication Technology use and job performance of teachers at a private international school in Uganda. Creative Education, 2020(11), 166-181.
- Murphy, J., Elliot, S., Goldring, E., Porter, A., (2007). Leadership for learning: A research-based model taxonomy of behaviours. School leadership and Management, 27(2), 179-201.
- Okemwa, M., and Mudulia, M. (2019). Assessment of the principals’ administrative strategies on adequate staffing and its influence on students’ performance in K.C.S.E in Masaba South Sub-County, Kisii County, Kenya. European Journal of Education Studies, 6(4), 399-414.
- Okemwa, K. O., Momanyi, M., Ntabo, A. (2020). Influence of B.O.Ms infrastructural development practices on students’ academic performance in public secondary schools in Nyamira County, Kenya. African Educational Research Journal, 8(3), 575-585.
- Okey, S.M. (2020). Instructional leadership practices of school principal and management of quality academic performance of students in public secondary schools, Cross River State, Nigeria. Journal of Research and Method in Education 10(2), 15-19.
- Olson, K. (2010). An examination of questionnaire evaluation by experts. Field methods, 22(4), 503-529.
- Omona, J. (2013). Sampling in qualitative research: Improving the quality of research outcomes in high education. Makerere Journal of Higher Education, 4(2), 169-185. Doi.http:// dx.doi.org/10. 4314/majohe.v4i2.4
- Ondieki, L. G., Odongo, B., and Onditi, M. A. (2020). Influence of classroom instructional resources on mastery of number activity concepts among pre-primary learners in Embakasi Sub-County, Nairobi County. African Journal of Education and Social Sciences, 7(2), 153-169.
- Othoo, H. A., Olel, M. A., and Gogo, J. (2019). Teaching and learning resources as determinants of academic performance in public secondary school in Kuria East and Kuria West Sub-counties. American Journal of Social Sciences and Humanities, 4(3), 448-460.
- Park, S., and Weng, W. (2020). The relationship between ICT-related factors and student academic achievement and the moderating effect of country economic indexes across 39 countries: Using multilevel structural equation modelling. Educational Technology and Society, 23 (3), 1–15.
- Plano Clark, V. L., and Sanders, K. (2015). The use of visual displays in mixed methods research: Strategies for effectively integrating the quantitative and qualitative components of a study. In M. T. McCrudden, G. Schraw, and C. Buckendahl (Eds.), Use of visual displays in research and testing: Coding, interpreting, and reporting data (pp. 177-206). Charlotte, NC: Information Age.
- Republic of Kenya (2019). National Education Sector Strategic Plan 2018-2022: Kenya Vision 2030, Nairobi.
- Republic of Kenya (2018). Teachers Service Commission Career Progression Guideline, Nairobi, Kenya.
- Roth, S. (2019). The open theory and its enemy: Implicit moralization as epistemological obstacles for general systems theory. Systems Research and Behavioural Science, 2019(3), 1-8. Doi.10. 1002/sres.2590.
- Sangoseni, O., Hellman, M., and Hill, C. (2012). Development and validation of a questionnaire to assess the effect of online learning on behaviours, attitudes and clinical practices of physical therapists in United States regarding evidence based practice. Journal of Allied Health Science Practice, 11, 1-12.
- Smith, E. M., Stein, M. M., Cole, W., and Holmes, N. G. (2020). Direct measurement of the impact of teaching experimentation in Physics Laboratories. Physical Review, 9(10), 011029. Doi: 10.1103/PhysRevX.10.011029
- Stosich, E. L., and Bristol, T. J. (2018). Advancing a New Focus on Teaching Quality: A Critical Synthesis. Stanford, CA: Stanford Centre for Opportunity Policy in Education.
- Taherdoost, H. (2016). Validity and reliability of the research instruments. How to test the validation of a questionnaire or survey in a research. International Journal of Academic Research in Management, 5(3), 28-36.
- Taherdoost, H. (2017). Determining sample size: How to calculate survey sample size. International Journal of Economics and Management Systems, 2(2017), pp 237-239. http://www.iaras.org/iaras/journal/ijems
- Taylor, S. L., Bogdan, R., and DeVault, M. L. (2016). Introduction to qualitative research methods: A guidebook and resource (4th Ed.). Hoboken, NJ: John Wiley & Sons.
- United Nations Educational, Scientific and Cultural Organization (2015). Education 2030: Incheon Declaration and Framework for Action: Towards inclusive and equitable quality education and lifelong learning for all. Incheon, Republic of Korea.
- United Nations Educational, Scientific and Cultural Organization (2017). A guide for ensuring inclusion and equity in education, Paris, France.
- Vanblaere, B., and Devos, G. (2017). The role of departmental leadership for professional learning communities. Educational Administration Quarterly, 54(1), pp 85-114.
- Wallace Foundation (2013). The school principal as leader: Guiding schools to better teaching and learning. Retrieved fromhttp://www.wallacefoundation. org/knowledge center /school-leadership/effective-principal-leadership/Pages/The-School-Principal-as Leader-GuidingSchools-to-Better-Teaching-and-Learning.aspx
- Wanjala, G. (2019). Staffing practices of the Teachers’ Service Commission and academic performance in public primary schools in Merti Sub-County, Kenya, East Africa Schools Journal of Education, Humanities and Literature, 2(11), 683-692.
- Wright, R. E., and Reeves, J. L. (2019). Open education resource (OER) adoption in higher education: Examining institutional perspectives. FDLA Journal, 4(9). https:// Insworks.nova.edu/fdla-journal/4/issl/9
- Yozgatligil, C. T., and Ayhan, H. O. (2018). Univariate sample size determination by alternative components: Issues on design efficiency for complex samples. Statistics in Transition, 19 (2), 201-208. Doi. 10.21307/stattrans-2018-012