
Influence Of Principals’ Reward System on Academic Performance in Kisii County, Kenya
- Thomas Odongo Ololo
- Dr. Mary Anyango Onditi
- Dr. Benard Mwebi
- 1011-1031
- Jun 7, 2024
- Education
Influence of Principals’ Reward System on Academic Performance in Kisii County, Kenya
Thomas Odongo Ololo1, Dr. Mary Anyango Onditi2, Dr. Benard Mwebi3
1PhD Candidate, Department of Curriculum and Educational Management, Jaramogi Oginga Odinga University of Science and Technology-JOOUST
2Senior Lecturer and Chairperson Department of Curriculum and Educational Management, Jaramogi Oginga Odinga University of Science and Technology-JOOUST,
3Senior Lecturer, Jaramogi Oginga Odinga University of Science and Technology-JOOUST.
DOI: https://dx.doi.org/10.47772/IJRISS.2024.805070
Received: 24 April 2024; Revised: 01 May 2024; Accepted: 06 May 2024; Published: 05 June 2024
ABSTRACT
This study investigated the influence of Principals’ reward system on learners’ academic performance in Kenya Certificate of Secondary Education in Kisii County. Mixed method research design of explanatory sequential type was applied in the study. From a target population of 4,691 subjects, a sample of 366 participants derived proportionately through stratified random sampling technique which included 114 H.O.Ds and 252 teachers was sampled. Census sampling was applied to select the two national schools and one special school while the 82 other schools were sampled through proportionate stratified random sampling technique. The 85 Principals of the selected schools were purposefully sampled. The total sample for the study was 451 participants. Questionnaires and interview guides were used to collect data. Validity of the research instruments was ensured through expert evaluation while reliability was estimated by use of Cronbach’s alpha coefficient formula. Quantitative data were analysed using Statistical Package of Social Sciences (SPSS) Version 29 while qualitative data were analysed thematically. The study found out a weak positive insignificant influence between reward system of teachers and learners (r=.021, p≤.05; 2 tailed) and academic performance. This was supported by Principals’ interviews which indicated that lack of financial support make hard to reward teachers and learners and unclear promotion policy by the Teachers’ Service Commission demoralizes teachers. The findings of this study would be a base for corrective measures against low academic performance in the study locale. The study recommended that further research should be done on influence of principals’ leadership skills development on academic performance in K.C.S.E.
Key words: Reward system, Mixed Method, Explanatory Sequential, Principals, Secondary Education
INTRODUCTION
In order to improve on academic performance in schools, Mendel (2012) suggests a five dimensions leadership practices model. These are: shaping and communicating school vision; creating a positive and hospitable environment; cultivating leadership in others; improving instruction; and managing people. Hallinger and Murphy (2012) Leadership for Learning model illustrates that school leadership through various school conditions has indirect and mediated influence on students’ learning outcomes. Effective principals create an academic capacity by inculcating of high expectations for the school to identify with those who work for improving the quality of teaching and students’ academic achievement (Greatbatch & Tate, 2018). The key role of the principals is to provide direction, resources and support to teachers and students in order to enhance high quality teaching and learning outcomes (Stosich & Bristol, 2018). Therefore, leadership practices should focus on individual components of the instructional programs and other elements in the school that may influence classroom instruction and how such programs may also influence other factors in the school (Wallace Foundation, 2013) to result in the intended learning outcomes.
In U.S.A. Mintrop and Ordenes (2017) investigated why implementation of extrinsic incentives and organizational goal setting could not meet the intended outcomes as envisaged by the designers. The results of the study revealed that, the implementation of test based accountability measure and introduction of pay-for-performance scheme did not have a significant contribution on improved learning outcomes. On the contrary, teachers were more influenced to serve the disadvantaged students due to their self-determination and self-identity and pro-social commitment to teach those who might not have gotten an opportunity to learn if at all they were not exposed to the teachers. Similarly, the study of Berry et al. (2019) in a low educational achievement and inadequate teaching and learning context of Malawi that investigated the impact of two incentives schemes: a Standard Scholarship Program that provide scholarships for students whose test scores were within the top 15 per cent of the baseline and a Relative Scholarship Scheme that provided scholarships for top students within smaller groups with smaller baseline scores. The study revealed that standardized scholarship significantly decreased test scores compared to control group with the largest decrease realized among those students who least expected to win scholarship. The decreases in test scores correspond with decreases in motivation among the least expecting to win scholarship.
In Kenya, the Teachers’ Service Commission has put in place policies for rewarding teachers so that they get motivated to improve on academic performance (Republic of Kenya, 2015). However, there has been a low academic performances during 2018 to 2022 with the national average K.C.S.E performance within the five-year period standing at 4.313 which is a mean grade of D+. The low performance would not enable the exiting learners to compete favourably in nationally and internationally in both education and employment arena where high quality academic grades are demanded for employment and continued education (UNESCO, 2017). On the other hand, an improvement in academic performance may lead to increased future income to individuals and to the nation (Hanushek, 2011). Similarly, performance in Kisii County is a mean of 4.072 (D+) and far much lower than the national average of 4.313 (D+). It may also suggest that a large number of the candidates obtained grades D+ and below, which almost disqualifies them from pursuing any professional course (Republic of Kenya, 2018).
1.1 Statement of the problem
The Teachers’ Service Commission substantively appoints Principals to provide satisfactory quality leadership in public secondary schools in Kenya alongside introduction of performance contracting (P.C) for the principals and teacher performance appraisal and development for all teachers (RoK, 2015) to improve on the quality of learning outcomes. Despite this arrangement, there has been persistent low academic performance in K.C.S.E. in Kenya and the study locale. The low educational achievement suggests a lasting negative impact on individual lives and represents lost output for the national economy as a whole (Michelmore and Dynarski, 2016) due to a reduced technical skilled human capital and increased low level of productivity. It may suggest that learners exiting secondary school education might not be competitively absorbed in training institutions to acquire relevant knowledge and skills for their individual and national development (Hanushek, 2011). The government has prevailed upon education stakeholders to address the worrying trend of low academic performance (Republic of Kenya, 2019). Therefore, the researcher investigated the influence of principals’ leadership practices on academic performance in K.C.S.E in public schools in Kisii County to shed light on the persistent low average academic performance.
1.2 Purpose of the study
The purpose of this study was to investigate the influence of principals’ rewarding system on learners’ academic performance in Kenya Certificate of Secondary Education (K.C.S.E.) in public schools in Kisii County. Specifically, the study aimed at determining the influence of principals’ rewarding system on learners’ academic performance in K.C.S.E. in Kisii County.
The study was guided by the following research hypothesis;
Ho1 Principals’ rewarding system does not influence learners’ academic performance in K.C.S.E in Kisii County.
1.3 Theoretical framework
This study was anchored on Karl Ludwig von Bertalanffy (1968) General Systems Theory viewed from the perspective of Murphy et al., (2007) leadership for learning model. A system is a cohesive combination of interrelated and interdependent parts which can be natural or human-made and is composed of its subsystems, environment where it exists and the supra-system in a hierarchical dimension (Roth, 2019). General Systems Theory could be suitable in the management of public secondary schools in Kenya due to their being semi-autonomous institutions with various components such as the Board of Management. Externally, they relate with other agencies such as the Ministry of Education and the Teachers’ Service Commission in school management. The relevance of Bertalanffy (1968) General System’s theory when looked at through the lens of Murphy (2007) leadership for learning model emanates from the fact that principals’ reward system can influence learners’ academic performance in K.C.S.E. in Kisii County.
LITERATURE REVIEW
Reward systems have been established by research to promote increase of effort when teachers and learners expect to meet both personal and institutional goals (Mintrop & Ordenes, 2017). Both bonus and performance evaluation have also been noted in the literature to improve job performance in the initial stages of implementation and after sometime, dissonance crop in among the recipients (Mintrop et al., 2018).
2.1 Financial incentives and learners’ academic performance in K.C.S.E.
The literature on the contribution of financial incentives on teachers’ performance reveals a wide variety of results. For instance, Elacqua et al. (2019) study in Chile found out that application of bonus pay to attract and retain talented teachers in disadvantaged schools succeeded on one hand but on the other hand, talented teachers in non-disadvantaged schools used the reward to stay or transfer to high performing schools. Similarly, Schwab and Somerville (2022) study in the U.K discovered that monetary incentives can drive cognitive effort and subsequent learning in an online learning context, when participants can directly compare the incentivized context against a context with no external incentive. Likewise, the level of teachers’ motivation depended upon their individual needs and did not influence academic performance (Comighud & Alvero (2020) in the Philippines. On the other hand, Assibi (2019) study in Ghana revealed a weak significant positive relationship between compensation packages and students’ examination performance. This finding confirms revelation of an earlier study of Adebajo (2018) in Nigeria which discovered that monetary incentives do not increase teachers’ effort. In contrast, Ogola (2017) study in Kenya, indicated that monetary incentives accounted for increase in students’ academic performance in K.C.S.E. The mixed results and paucity of research on the influence of reward system on academic performance in Kisii County call for more research in this topic to contribute to better understanding of the phenomenon.
2.2 Promotion of teachers and learners’ academic performance in K.C.S.E.
Amir et al. (2019) study in Pakistan that investigated the impact of pay and promotion on teachers’ job satisfaction revealed insignificant effect on teachers’ job satisfaction. Similarly, Arogundade (2019) in Nigeria, discovered a statistically significant positive relationship between promotion of teachers and teachers’ job satisfaction. Similarly, Imasuen (2020) study in Kenya identified that teacher promotion contributes to academic performance. However, the study of Oguta (2021) on the influence of teacher motivation methods on students’ academic performance in Migori County discovered that promotion on merit did not impact on academic performance. The studies of Amir et al. (2019) dwelt on categories of schools and together with Arogundade (2019) study, the two studied influence of promotion of teachers while the current study immersed itself on studying the influence of reward systems on academic performance with application of mixed methods research strategies to fill the gap. In the same vain the studies of Imasuen (2020) and Oguta (2021) used small sample sizes that might have caused their findings to lack external validity. The current study used a larger sample to fill the gap.
METHODOLOGY
3.1 Research design
This study applied Mixed Method Research design of explanatory sequential approach which involved prioritising quantitative phase over qualitative phase with data integration (Creswell & Creswell, 2018). Explanatory sequential approach was meant to identify potential predictive power of principals’ leadership variants on students’ academic performance in K.C.S.E and to allow use of the results for purposefully selecting informants for the second phase (Creswell & Creswell, 2018) and construction of semi-structured interview schedule. The rationale for mixing in the current study was that neither quantitative nor qualitative methods were independently sufficient to capture the trends and details of the situation, such as a complex issue of Principals’ leadership practices on learners’ academic performance in K.C.S.E. in the study locale. Subsequently, mixed method research approach was applied in this study for two reasons: convergence of data to enhance the research finding validity, thereby strengthened and enriched the study’s conclusions. Also as a complementary mechanism to allow the researcher gain deeper and complete understanding of the research problem and provide clarification of results found in the quantitative phase during qualitative phase and results integration (Creswell & Creswell, 2018).
Glykeria et al. (2024) asserts that researchers should always transparently answer research questions by using rigorous approaches they find suitable for their study design to support the exploration of the facts between variables and participants to be able to arrive at valid results. Therefore, in the first phase, the quantitative- numeric data was collected, using questionnaires and the data was subjected to descriptive and inferential statistics analysis while in the second phase, a qualitative approach which depended on the purposively identified quantitative results (Creswell, 2014) that needed more information gathering for better understanding, was used to collect text data through individual semi-structured interviews, to help explain and contextualize quantitative results such as why certain external and internal factors, tested in the first phase, might be significant predictors of the students’ academic performance in K.C.S.E. in Kisii County. The visual model of the procedures for the explanatory sequential approach is presented in Figure 1.
Figure 1: Steps of Explanatory Sequential Approach
Phase 1- Quantitative Phase 2- Qualitative
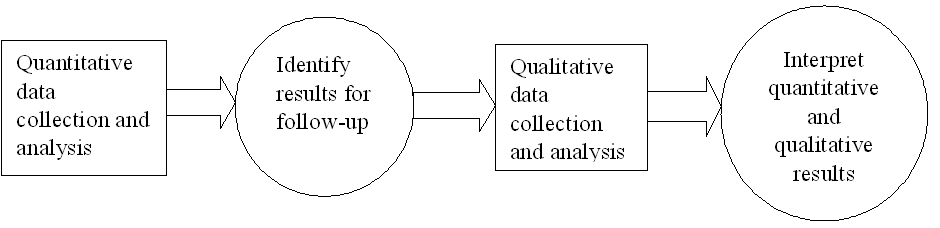
Source: Creswell and Creswell (2018).
Figure 1 shows how the explanatory sequential approach was implemented step by step. Priority in this design was given to the quantitative method, because it represents the major aspect of data collection and analysis in the study that will determine the relationship between the predictor variables and the outcome variable. A follow-up study was done during the second phase of data collection using qualitative approaches which focussed on explanations and contextualization of quantitative results by exploring in-depth about the text data concerning the four study objectives (Creswell, 2014).
In this study, first, integration was done at methods level by connecting whereby, the researcher first analysed the quantitative data, then used its findings to develop sampling criteria for the follow-up qualitative phase (Fetters et al., 2013). Specifically, Maximum Variation Sampling technique (M.V.S) was used to identify and purposively sample individuals who demonstrated higher, average and lower levels of academic performances in K.C.S.E. which enabled the researcher to juxtapose the reasoning patterns between the three groups of Principal respondents (Creswell, 2014). Secondly, integration was done at the interpretation and reporting level through the use of narratives and joint displays whereby the researcher described the findings in single report of quantitative and qualitative on one hand and on the other hand organised the findings in an integrated results matrix that was used to juxtapose both quantitative and qualitative findings to allow side-by-side comparisons and to provide evidence to support the researcher’s process of drawing meta-inferences and new insights about the research topic through contiguous approaches (Guetterman et al., 2015; Plano Clark and Sanders, 2015).
3.2 Study participants
Mugenda and Mugenda (2008) recommends that 10% to 30% of the target population is adequate for a sample. Based on this guideline, 25% of the target population of the schools was selected for the study because their number is comparatively smaller (Cohen, 2011). Thus 85 schools were sampled for the study. On the other hand, the Principals of the participating schools were purposively sampled. The 1360 Heads of Departments and 2,991 teachers who together constitute 4,351 of the remaining respondents were sampled proportionately to arrive at 114 HoDs and 251 teachers in the sample. The Principals participated in this study because they directly preside over instructional programs from subject allocation, monitoring classroom instruction and testing of learners and evaluation of test results in the schools. While Heads of departments participated because they assist the principals in supervising teachers in the departments and implement the curriculum in the classrooms. And teachers participated because they directly implement instructional programs such as classroom instruction and testing of learners and evaluation of test results in the respective subjects. The three groups of participants were in a position to respond to the items in the research instruments so as to fulfill the research purpose. Table 1 shows the size of the target population.
Table 1: Summary of Target Population of Secondary schools
| Sub-county | Categories of schools | |||||
| National | Special | Extra County | County | Sub-county | TOTAL | |
| Kenyenya | 1 | 10 | 33 | 44 | ||
| Kitutu Central | 1 | 1 | 2 | 16 | 20 | |
| Kisii Central | 1 | 1 | 4 | 4 | 29 | 39 |
| Nyamache | 2 | 5 | 42 | 49 | ||
| Masaba South | 2 | 2 | 40 | 44 | ||
| Gucha | 1 | 2 | 18 | 21 | ||
| Gucha South | 4 | 3 | 14 | 21 | ||
| Kisii South | 6 | 9 | 18 | 33 | ||
| Etago | 1 | 2 | 14 | 17 | ||
| Sameta | 2 | 2 | 17 | 21 | ||
| Marani | 2 | 2 | 27 | 31 | ||
| TOTAL | 2 | 1 | 27 | 43 | 267 | 340 |
Source: Kisii County T.S.C. Office (2021)
From table 1, the varieties of schools in the study locale suggest that they have contextual differences that education stakeholders should consider when implementing educational programmes to realize quality learning outcomes(Mendel, 2012).
3.2.1 Respondents
According to the Kisii County Teachers’ Commission Office (2021), the County has 340 public secondary schools and 4,691 teachers which includes 340 principals, 1360 Heads of Departments (HoDs) and 2,991 are teachers. Therefore the target population where the respondents were derived from is 4,691 people. Table 2 shows their distribution in Kisii County.
Table 2: Target Study Populations
| Sub-counties | Schools | All Teachers on duty | Principals | HoDs | Teachers |
| Kenyenya | 44 | 534 | 44 | 176 | 314 |
| Kitutu Central | 20 | 378 | 20 | 80 | 278 |
| Kisii Central | 39 | 707 | 39 | 156 | 512 |
| Nyamache | 49 | 583 | 49 | 196 | 338 |
| Masaba South | 44 | 585 | 44 | 176 | 365 |
| Gucha | 21 | 251 | 21 | 84 | 146 |
| Gucha South | 21 | 312 | 21 | 84 | 207 |
| Kisii South | 33 | 488 | 33 | 132 | 323 |
| Etago | 17 | 182 | 17 | 68 | 97 |
| Semeta | 21 | 301 | 21 | 84 | 196 |
| Marani | 31 | 370 | 31 | 124 | 215 |
| TOTAL | 340 | 4691 | 340 | 1360 | 2,991 |
Table 2 illustrates the distribution of schools and teachers in Kisii County. It has a total of 4,691 teachers. This includes school administrators and the assistant teachers. In terms of heads of Departments, there are four per school who are in charge of: Languages, Sciences and Mathematics, Humanities and Technical and Applied subjects (Republic of Kenya, 2018). Furthermore, the distribution of all teachers across the sub-counties and categories of schools in Kisii County is as indicated in table 3.
Table 3: Distribution of teachers per school category in the Sub-Counties
| Sub-County | Category of schools | |||||
|
National |
Special | Extra-County | County | Sub-County | TOTAL | |
| Etago | – | – | 18 | 28 | 136 | 182 |
| Gucha | – | – | 24 | 32 | 195 | 251 |
| Gucha South | – | – | 102 | 52 | 158 | 312 |
| Kenyenya | – | – | 43 | 180 | 311 | 534 |
| Kisii Central | 88 | 11 | 148 | 110 | 350 | 707 |
| Kisii South | – | – | 158 | 131 | 199 | 488 |
| Kitutu Central | 86 | – | 9 | 49 | 234 | 378 |
| Marani | – | – | 37 | 23 | 310 | 370 |
| Masaba South | – | – | 101 | 32 | 452 | 585 |
| Nyamache | – | – | 37 | 106 | 440 | 583 |
| Sameta | – | – | 107 | 54 | 140 | 301 |
| TOTAL | 174 | 11 | 784 | 797 | 2,925 | 4,691 |
Table 3 indicates that there is a total of 4,691 teachers. These are spread out in the Sub-Counties in terms of 174 teachers in the National schools, 11 teachers in the Special school, 784 teachers in the Extra-County schools, 797 teachers in the County schools and 2, 925 teachers in the Sub-County schools. It further shows that Sub-County schools have more than half the total number of teachers, suggesting that there are more Sub-County schools in Kisii County than any other type of school.
3.3 Sampling Techniques and Sample Size
Sampling is a statistical process of selecting a sub-set of participants from a target population of interest for the purpose of doing a scientific study to allow for making statistical inferences about the target population (Descombe, 2017). A sample is a sub-set of the target population selected by a researcher for the study whose findings should reflect the entire population characteristics (Kothari, 2013). Sample determination for any sample survey is based on objectives of the study, level of confidence of the desired estimates, size of the population and cost of enumeration (Yozgatligil & Ayhan, 2018) and characteristics of the population, procedures and approaches of data analysis (Taherdoost, 2017).
According to Taherdoost (2016), when conducting sampling, a researcher undertakes specific sequential stages which are: clearly defining the target population, selecting sample frame, choose sampling techniques and determining sample size to use as the sample for the study. Christensen et al. (2015) add that sample size should be balanced with the skills and resources of the researcher to avoid cases of diminishing returns setting in due to a very large sample size. Subsequently, in this study, sampling procedures were guided by availability of financial resources, time and how suitable they were to the research objectives and convenient in terms of skills to the researcher (Taylor et al., 2016).
The research approach of the study necessitated the use of different sampling techniques in each of the phases. In phase 1, stratified random sampling technique was used to arrive at the study sample of schools, Heads of Departments and the teachers because they occur inform of strata in the target population (Anol, 2012). Stratified random sampling is a form of probability sampling technique where the heterogeneous population is divided into homogeneous sub-populations called strata (Christensen, et al., 2015). A random sample is drawn from each stratum which then constitutes the sample size for the study when sample sizes from all the strata (sub-populations) are added. In this study, strata membership was determined by the school type of the individuals and the use of proportionate stratified random sampling to select cases to be included in the sample as per the size of each stratum in the target population (Anol, 2012).
During Phase 2 of the study for qualitative data collection, the sample was derived from the same participants in Phase 1 to allow for follow-up of the quantitative results to explore the results and explain the interactions between the variables (Creswell and Creswell, 2018). The researcher purposively identified and selected participants in the Quantitative phase (Creswell, 2014), through Maximum Variation Sampling technique (M.V.S.) to participate in Qualitative phase. Creswell (2014) indicates that Maximum Variation Sampling is a purposive sampling strategy whereby cases or individuals who differ on some aspects are sampled to provide expertise and rich opinions about the study phenomenon. According to Etikan (2016), Maximum Variation Sampling technique requires studying a subject from all the available perspectives to realise a better understanding of the phenomenon. It involves selecting participants across a broad range relating to the phenomenon under investigation. Correspondingly, Daniel (2019) suggests that while recruiting participants using Maximum Variation Sampling technique, the researcher should recruit those individuals who can provide different perspectives and settings about the phenomenon under investigation by first performing an initial assessment of the profiles of the potential participants, thus enhance data adequacy. Therefore, the researcher used Maximum Variation Sampling (M.V.S.) technique to select 18 Principals because they are knowledgeable and have rich information about the phenomenon under investigation (Creswell, 2014), to participate in the study based on the K.C.S.E average performance of their schools during the 2018 to 2022 period as indicated by the results of quantitative data. That is, Six Principals in each of these categories of mean scores 8.00 to 10.00, 5.00 to 7.99 and 1.00 to 4.99- being high, average and low performing schools respectively, resulting to six participants per category which gave a total of 18 participants to form the sample size for the Phase 2 thereby enhancing multiple perspectives of individuals to be captured (Omona, 2013).
3.3.1 Sample of the Schools
Mugenda and Mugenda (2008) recommends that 10% to 30% of the target population is adequate for a sample. Based on this guideline, 25% of the target population of the schools was selected for the study because their number is comparatively smaller (Cohen, 2011). Thus 85 schools were sampled for the study. The schools were proportionately sampled according to their types in the County. However, since National schools are only two and Special school being one, these two categories of schools were sampled through Census sampling technique. Therefore, to determine the samples of schools, Heads of Departments and teachers from the Sub-Counties, the following formula and procedure was used to arrive at the sample size for each stratum which eventually constituted the sample size for the study:
n = S (M/N)
Where:
n = number of units sampled from a given stratum
S = sample size
M= size of stratum of a given strata
N= size of population
(Adapted from Kothari, 2004).
Hence, the samples of schools for each type of schools are as follows:
82(27)/337=6.569=Sample size of Extra-County schools.
82(43)/337=10.462=Sample size of County schools.
82(267)/337=64.967=Sample size of Sub-County schools
The total is 81.998 schools. Therefore, the sample size for the other schools for the study was 82, combined with two national schools and one Special school, the total number of schools in the sample was 85 schools.
In order to accord each potential school from the target population of schools equal chance of inclusion in the sample, the researcher assigned code numbers to each school in the stratum on a piece of paper, folded them and put all of them in a container. Schools were coded as per their category. For example: Extra-county schools were coded- EXT/KYYA/1, EXT/KYYA/2 and EXT/KYYA/3, being the Extra-county schools in Kenyenya Sub-county. The same procedure and process was applied for all the Sub-counties to get the required number of schools to represent each category of schools in the study sample by putting all the codes for all the sub-Counties in one container and picking them at random. Table 4 shows the sample of schools selected for the study.
Table 4: Sample size of schools by School Category
| School category | Population | Sample size | Sampling techniques | Percentage |
| National | 2 | 2 | Census | 100 |
| Special | 1 | 1 | Census | 100 |
| Extra-county | 27 | 6.569 | Simple random | 24.33 |
| County | 43 | 10.462 | Simple random | 24.33 |
| Sub-county | 267 | 64.967 | Simple random | 24.33 |
| TOTAL | 340 | 85 | 25.00 |
3.3.2 Sample of the Principals
All the principals of the 85 sampled schools being the lead administrators of their schools and possess vital information for the study were purposively sampled to participate in the study.
3.3.3 Sample of the Heads of Departments
The sample sizes for heads of department and teachers were determined using Slovene’s sample size determination formula because their number is known.
n = N / (1 + Ne2)
Where, n = Sample size,
N = Total population and,
e = Error tolerance (Yamane, 1967).
In this study, the population of heads of departments and teachers (N) is 4,351, and e = 0.05, hence sample size n is determined at 366. Proportionate stratified simple random sampling technique was used to select the head of departments and teachers sample as per their spread in the categories of schools (Creswell and Creswell, 2018).
There are a total of 1360 Heads of Departments in Kisii County and 2,991 teachers. The 1360 Heads of departments is equivalent to 31.25% of the 4,351 people in the target population of teachers and heads of department, while 2,991 teachers is representing 68.74 % of the 4,351 people. Therefore, in the remaining 366 sample (after subtracting the 85 sample of the principals), sample of heads of departments and teachers, were sampled proportionately through stratified random sampling technique. Thus;
366(1360)/4351=114.401= Sample size of Heads of Departments for the study.
366(2991)/4351=251.598= Sample size of teachers for National schools.
Hence 114 heads of departments and 252 teachers was sampled. Together the sample size of heads of departments and teachers is 366 respondents.
The actual samples of heads of department from each school category was calculated proportionately to ensure that the sample size represented the target populations as shown:
114(8)/1360=0.670= Sample size of Heads of Departments for National schools.
114(4)/1360=0.335= Sample size of Heads of Departments for Special school.
114(108)/1360=9.052= Sample size of Heads of Departments for Extra- County schools.
114(172)/1360=14.417=Heads of Department for County Schools.
114(1068)/1360=89.523= Heads of Departments for Sub-county schools.
The sample totals to 113.997 participants which approximately is 114 respondents for the study. In order to accord each potential member of the population equal chance of inclusion in the sample, the researcher assigned code numbers of each category in the stratum on a piece of paper, folded them and put all of them in a container. Schools were coded as per their Category, their Sub-Counties and the numbers of Head of Department on duty. For example: An Extra-county school from Kenyenya sub-county was coded- EXT/KYY/HD/K/1…, until the last Head of Department in a given school had been coded. This was done in all the schools in Kenyenya Sub-county and the same approach was applied to all the sub-counties in Kisii County. The researcher then put them in a container and picked them randomly. The first 114 individuals selected formed the HoDs’ sample for the study.
3.3.4 Sample of the Teachers
There are 2,991 teachers in public secondary schools in Kisii County. The sample of teachers was determined proportionately based on their school category during stratified random sampling to arrive at sample size of 252 teachers which were selected randomly to be representative of the target population of 2,991 teachers.
The proportionate samples for the teachers was:
252(164)/2,991=13.817= Sample size of Teachers for National schools.
252(6)/2,991=0.505= Sample size of Teachers for Special schools.
252(649)/2,991=54.680=Sample size of Teachers for Extra-County schools
252(582)/2,991=49.035=Sample size of Teachers for County schools.
252(1590)/2,991=133.961=Sample size of Teachers for Sub-County schools.
Finally the entire sample size of teachers for the proposed study was 250.998 which was equivalent to 251 teachers to be proportionately sampled. Table 5 shows sample size and sampling technique for every category of the respondents.
Table 5: Sample size and sampling techniques of respondents
| Principals | HoDs | Teachers | |
| Study population | 340 | 1360 | 2,991 |
| Sample size | 85 | 114 | 252 |
| Percentage (%) | 25 | 8.382 | 8.425 |
| Sampling technique | Purposive | Stratified random sampling | Stratified random sampling |
As table 5 indicates purposive sampling technique was applied to sample 85 principals while stratified random sampling technique to sample 114 HoDs and 252 teachers for the study
3.4 Data collection instruments
Quantitative data were collected by use of Questionnaires for the principals, heads of department and teachers while in-depth interview schedule was applied on the principals to collect qualitative data. This aided in testing the agreement of findings obtained from different sources and to enhance clarity and consistency of the findings (Creswell and Creswell, 2018). The validity of research instruments were ensured through expert evaluation (Taherhoost, 2016; Sangoseni et al., 2012; Olson, 2010) while reliability was done by the use of Cronbach’s Coefficient Alpha for the Questionnaires and it averaged at .781.
3.5 Data collection procedure
The researcher obtained introductory letter from the Board of Postgraduate Studies of Jaramogi Oginga Odinga University of Science and Technology to allow him get permit and licence from the National Commission for Science, Technology and Innovation and authority letter from JOOUST Ethics Review Committee. The above documents assisted the researcher to be permitted to conduct the pilot study and the main study by the County Commissioner-Kisii, County Director of Education-Kisii, and principals of the sampled schools, Heads of Departments and teachers. The Principals who were sampled for the study were consulted in readiness for the study and assisted the researcher to seek consent of HoDs and teachers to participate in the study.
3.6 Data Analysis
With regard to quantitative data analysis, Pearson Correlation was conducted as a preliminary analysis to test the hypotheses and determine the relationships among all the variables as per the research objectives. Descriptive statistics were presented in tables of measures of central tendency such as frequencies, percentages, means and standard deviation while inferential statistics were inform of coefficients and beta weights (Creswell & Creswell, 2018). Qualitative data based on transcripts of the in-depth interviews were analysed thematically according to the research objective and reported in themes, narratives and direct quotations of the interviewees (Braun & Clarke (2012). The two data sets were then triangulated to provide clear explanations of the relationships between the study variables (Yeasmin & Rahman (2012), since it is a process of verification from several view points and methods that increases the validity of research findings.
FINDINGS AND DISCUSSION
4.1 Phase 1- Quantitative research findings
This study aimed at exploring the influence of Principals’ reward system on learners’ academic performance in K.C.S.E. in Kisii County. The respondents were first asked to indicate whether teachers and learners get rewarded in the schools they teach. Their responses are shown in Table 6.
Table 6: Whether teachers and learners get rewarded.
| Teachers cadres | ||||||||
| Principal | HOD | Teacher | Total | |||||
| Freq (n) | (%) | Freq(n) | (%) | Freq (n) | (%) | Freq (n) | (%) | |
| YES | 73 | 17.63 | 83 | 20.05 | 187 | 45.17 | 343 | 82.85 |
| NO | 9 | 2.17 | 25 | 6.04 | 37 | 8.94 | 71 | 17.15 |
| TOTAL | 82 | 19.81 | 108 | 26.09 | 224 | 54.11 | 414 | 100.00 |
Table 6 indicates that 343(82.85%) of the respondents noted that teachers and learners get rewarded after showing good performance while 71(17.15%) responded to the contrary. This finding strongly support early research findings which reveal that motivation of teacher and learners helps in promoting academic performance (Gyansah, 2020). This suggests that the presence of a motivated workforce and learners would be ready to work hard to produce good results in K.C.S.E. (Wagner et al., 2018). Results from the interviews confirmed that there are a number of reward systems put place in schools depending on their financial ability. One principal said:
My school has established performance based reward system where teachers and learners who do well are rewarded for example with cash or internal promotions in the case of teachers (P7).
Another principal responded that:
The school has team based reward system whereby teachers in a department are rewarded whenever a subject has posted good results. On the other hand, learners are rewarded as a class when it has done well. Though, individual learners also may get rewarded depending the funds available (P5).
4.2 Response on the influence of principals’ reward system on learners’ academic performance in K.C.S.E. in Kisi County.
Descriptive statistics on the responses about principals’ reward system are shown in table 7.
Table 7: Descriptive statistics on the responses about principals’ reward system
| N | Minimum | Maximum | Mean | Std. Deviation | |
| Encourage teachers to respond to career growth opportunities to motivate them to add effort at work | 414 | 1 | 5 | 4.32 | .856 |
| Use internal leadership structures to promote teachers who excel in various academic disciplines | 414 | 1 | 5 | 4.13 | .942 |
| Recognize teachers and learners with superior work performance in school meetings to show that they are valued. | 414 | 1 | 5 | 4.13 | .947 |
| Coordinate promotion of teachers to make the school instructional teams work hard. | 414 | 1 | 5 | 4.02 | .990 |
| Q5…Expose teachers on professional trips to build their job satisfaction and morale. | 414 | 1 | 5 | 3.71 | 1.254 |
| Ensure that individual interests are considered while teachers and learners are rewarded to enhance cohesion in the school | 414 | 1 | 5 | 3.95 | 1.052 |
| Consider group effort while rewarding teachers to entrench collective responsibility in realizing school instructional goals | 414 | 1 | 5 | 4.02 | 1.015 |
| Use financial rewards to promote job satisfaction and improved learners’ academic performance | 414 | 1 | 5 | 3.82 | 1.158 |
| Valid N (listwise) | 414 | 1 | 5 | 4.013 | .886 |
Table 7 indicates that the influence of principals’ reward system of teachers and learners on learners’ academic performance in K.C.S.E. is high (M=4.013; SD=.886). The respondents concurred that Principals encourage teachers to respond to career growth opportunities to motivate them to add effort at work (M=4.32 SD=0.856), Use internal leadership structures to promote teachers who excel in various academic disciplines (M=4.13 SD=0.942), Recognize teachers and learners with superior work performance in school meetings to show that they are valued (M= 4.13 SD= 0.947), Coordinate promotion of teachers to make the school instructional teams work hard (M=4.02 SD= 0.990), Expose teachers on professional trips to build their job satisfaction and morale (M=3.71 SD= 1.254), Ensure that individual interests are considered while teachers and learners are rewarded to enhance cohesion in the school (M= 3.96 SD =1.052), Consider group effort while rewarding teachers to entrench collective responsibility in realizing school instructional goals (M= 4.02 SD = 1.015) and Use financial rewards to promote job satisfaction and improved learners’ academic performance (M=3.82 SD= 1.158). The indication that the influence of principals’ reward system of teachers and learners on learners’ academic performance in K.C.S.E. is high at a mean of (M=4.013; SD=.886) made it necessary to engage the principals in interviews. Their responses included:
These findings are in agreement with the findings of Leone (2020) which indicated that the incentive packages for the teachers improves on students’ academic performance. The results suggest that respondents are satisfied that motivation programmes in the study area help in improving academic performance. During the interviews, the principals expressed why they have put motivation in the schools’ strategic plans. One of the respondents said;
Schools need to motivate the teachers and learners and get results from them. To realize this, a school has to solicit for financial support from the parents and other stakeholders (P1).
4.3 Correlation between principals’ reward system of teachers and learners and learners’ academic performance in K.C.S.E.
Pearson’s Product Moment Correlation test was run to establish the influence of principals’ reward system of teachers and learners on learners’ academic performance in K.C.S.E. To obtain it, a simple coefficient of correlation was computed and results are shown in Table 8.
Table 8: Pearson correlation analysis to determine the influence of principals’ reward system on learners’ academic performance in K.C.S.E.
| Reward system | KCSE MEAN SCORE | ||
| Reward system | Pearson Correlation | 1 | -.021 |
| Sig. (2-tailed) | .675 | ||
| KCSE MEAN SCORE | Pearson Correlation | -.021 | 1 |
| Sig. (2-tailed) | .675 | ||
According to table 8, there is a weak negative insignificant relationships between principals’ reward system and learners’ academic performance in K.C.S.E (-.021, p>0.05; 2-tailed). These results concur with the findings of Oguta (2021) study in Kenya and Comighud and Arevalo (2020) study in the Philippine which found out that the relationship between teachers’ motivation and job performance was insignificant. However, it is contrary to the findings of Schwah and Somerville (2022) which found out that rewarding students improves academic performance. The findings imply that the principals should connect reward system of teachers and learners to improvement in academic performance by ensuring that all rewards are performance based and consider individual needs of the recipients to result in improvement of academic performance.
When asked to shed light on why there is low academic performance despite reward systems being in place, one of the principals responded by saying:
School face financial constrains when implementing motivation programmes, thus are unable to fulfill individual needs of every teacher. This leaves some of them dissatisfied with such exercise (P5).
Another principal respondent indicated the stagnation on one job group as being discouraging to teachers. He said;
The absence of clear promotion from the T.S.C. usually discourages teachers to work, even though at school level, a teacher maybe identified to a head of a department for example guidance and counselling but such arrangement do not attract cash payment to the teacher (P13).
4.4 Hypothesis testing.
The study aimed at determining the influence of principals’ reward system of teachers and learners on learners’ academic performance in K.C.S.E in Kisii County. Based on this objective, the following hypothesis was tested.
Ho1 Principals’ reward system of teachers and learners does not influence learners’ academic performance in K.C.S.E. in Kisii County.
A simple linear regression model used to find out the influence of the predictor variable on the outcome variable is expressed as:
Y = β0+β1X1+ϵ
4.5 Regression Analysis and Hypothesis Testing
The influence of principals’ reward system of teachers and learners’ on learners’ performance in K.C.S.E was also analysed. Table 9 presents the coefficients and model summary.
Table 9: Regression results of influence of reward system of teachers and learners on learners’ academic performance in K.C.S.E.
Model Fitness
| Model | R | R Square | Adjusted R Square | Std. Error of the Estimate | Change Statistics | ||||
| R Square Change | F Change | df1 | df2 | Sig. F Change | |||||
| 1 | .021a | .000 | -.002 | .77048 | .000 | .176 | 1 | 412 | .675 |
| a. Predictors: (Constant), KCSE MEAN SCORE | |||||||||
From Table 9, it can be observed that reward system had a weak positive insignificant influence on academic performance in K.C.S.E. (r =.021, N =412, p>.05). Therefore the null hypothesis that principals’ reward system do not influence learners’ academic performance in K.C.S.E was upheld and the alternative hypothesis was rejected. The finding of this study concurs with Berry, et al. (2019) study in Malawi which revealed that reward system based on standardized scholarship programme decreased performance especially among the learners who felt they have little chances of winning scholarship. On the other hand, Ukandu (2022) study in the U.S.A found out that rewarding performance increases employee’s work performance. The study results suggest that teachers and learners are unsatisfied with rewards they receive from the schools for dissatisfaction with a reward system has been reported by research to lower performance (Wagner et al., 2018). Furthermore, the results suggest that instructional reward system parameters have not embraced and connected to learners’ K.C.S.E. scores (Comighud & Arevalo, 2020). Therefore other factors that were not subject of this study might have been contributing to academic performance in the study locale given that learning achievement is a function of many factors including Principals’ leadership style and school context (Grissom et al., 2021).
When asked on the influence of reward system on academic performance in K.C.S.E., during the qualitative phase of this study, one of the respondents said;
Lack of school’s ability to motivate teachers has they would wish in many occasions make them feel their efforts are not recognized and the little they receive do not contribute so much in motivating them to result in improvement on learning outcomes in K.C.S.E.(P13).
The study also investigated whether reward systems of teachers and learners predict learners’ academic performance in K.C.S.E. The results are shown in table 10.
Table 10: Analysis of Variance of principals’ reward system of teachers and learners and learners’ academic performance in K.C.S.E
| Model | Sum of Squares | df | Mean Square | F | Sig. | |
| 1 | Regression | 112.110 | 1 | 112.110 | .176 | .675b |
| Residual | 262277.636 | 412 | 636.596 | |||
| Total | 262389.746 | 413 | ||||
| a. Dependent Variable: KCSE MEAN SCORE | ||||||
| b. Predictors: (Constant), Principal’s reward system | ||||||
Table 10 indicates that principals’ reward system of teachers and learners was not a significant predictor of learners’ academic performance in K.C.S.E. [F (1, 412) = .176, p>0.05]. The findings of this study agree with the studies of Mintrop and Ordenes (2017) and Comighud and Arevalo, (2020) which indicate that motivational programmes do not have a significant contribution on learning outcomes. Contrastingly, other studies have confirmed that rewarding employees increases their job performance (Rukumba, 2022). The results of this study suggest that there are other factors that might strongly influence academic performance in the study area but not reward system (Berry et al., 2019).
During the interviews, the respondents were asked whether they consider reward system to be a major factor on academic performance. One of the respondents said;
Reward systems alone in schools may not be impactful because not all schools have adequate finance to support motivation programmes. Above all, it depends on teachers’ attitude towards their schools and work in general. For those who do not to produce good results, rewarding them may still not be effective (P4).
The study also investigated the contribution of reward system of teachers and learners on learners’ academic performance in K.C.S.E. The results are shown in table 11.
Table 11: Linear regression to determine the contribution of principals’ reward system on learners’ academic performance in K.C.S.E.
| Model | Unstandardized Coefficients | Standardized Coefficients | t | Sig. | 95.0% Confidence Interval for B | |||
| B | Std. Error | Beta | Lower Bound | Upper Bound | ||||
| (Constant) | 7.681 | 6.588 | 1.166 | .244 | -5.269 | 20.631 | ||
| Influence of principals’ reward system on learners’ academic performance in K.C.S.E. | -.677 | 1.613 | -.021 | -.420 | .675 | -3.848 | 2.494 | |
Dependent Variable: KCSE MEAN SCORE
Table 11 indicates that reward system which is Y = 7.681+ -0.677X1, means that for every one unit increase in reward system of teachers and learners, there was a decrease in academic performance in K.C.S.E. by -0.677 units. The findings of this study are in concurrence with Oguta (2021) study which asserts that reward system do not impact on students’ academic performance in Migori County whereas the studies of Sadoff et al. (2021) in England found out that rewarding performance impacts positively on future performance. Thus it indicates that reward system should strategically be applied to depict the principals’ caring ability of the teachers and learners to result in a positive change in academic performance in K.C.S.E (Grissom et al., 2021).
During the interviews, the respondents indicated that:
Avenues of rewarding teachers and learners in the schools are few thus in terms of contribution to learning outcomes, their role may not be very significant as there are factors such as teachers’ attitude, over enrolment and inadequate teaching and learning resources that negatively affect instructions(P10).
4.6 Phase 2. Qualitative research findings
The objective of this study was to establish the influence of Principals’ reward system of teachers and learners’ on learners’ academic performance. This objective had two research questions. The first research question was; which was the Principals’ reward system while the second research question was; how teachers and learners benefit from such rewards.
On the question of Principals’ reward system, respondents indicated that teachers and learners are rewarded as per their production and their academic achievement respectively depending on availability of funds and vacancies in the school. One Principal noted that:
The type of reward system in my school for the teachers includes financial rewards, appointment in positions of responsibility such as Head of Subject, Director of Studies, academic tours while the learners could be given financial and material rewards such as hard cash and personal effects. All these are pegged on dedication and performance of the individual (P12).
Similar observation was noted from another principals who responded that:
Rewarding teachers and learners are always put in place to motivate them to work hard to attract better performance from everybody in the school. Therefore, in my school the type of reward given depends on the level of production. For a subject teacher who has excelled can be recommended to be a HoD (P2).
The inputs from the respondents supports the assertions of Arwa et al.(2019) which indicated that rewards systems adopted in an organization positively and significantly influence the performance employees. However, it is in contrast to the findings of Comighud and Arevalo (2020) who found out that motivation of teachers was insignificant on their job performance.
On how teachers and learners benefit from such rewards, the respondents were of the view that the recipients of the rewards realize that their efforts are recognized and appreciated by the leadership of the school and that they are valued by the institutional players. One of the respondents said:
Teachers really feel motivated when they realize that whatever they do for the benefit of the learners and the school is recognized. This means they are valued. The rewards builds the spirit of competition among the teachers and learners which results to improvement of result (P15).
However, majority of the respondents noted that inadequate support from the stakeholders results in lack of adequate funds to reward teachers and learners in most schools and coupled with isolated cases of promotion by the T.S.C, many teachers feel that the terms and conditions of employment do not support them to work. The respondents therefore mentioned that these have contributed to teachers being demoralized to extent that academic performance is lowered. One respondent said:
Lack of stakeholder support to finance rewards’ programmes and few changes of promotion of hard working teachers have resulted to loss of hope among them to work hard. The learners are thus left to struggle on their own. Such occurrence definitely results to poor academic results in many schools (P5).
The sentiments expressed by interviewees suggests that while they acknowledge that they have a variety of rewards to use and the significance of reward system on learning achievement, other circumstances beyond their control such as lack of stakeholder support impact negatively on their motivation resulting to poor academic performance in K.C.S.E. These findings confirms the quantitative findings that reward system put in place in schools do not contribute to academic performance. The responses made by interviewees suggest that lack of a clear and strong reward system in schools and from the T.S.C. lowers academic performance as had been reported by the study of Ogolla (2017).
4.7 Quantitative and qualitative results triangulation matrix
The results of integration at interpretation stage are presented in table 12 in form of a matrix.
Table 12: Quantitative and Qualitative results integration matrix
| No | Objective and Hypotheses | Quantitative results | Qualitative results | Meta-Inferences |
| 1 | To determine the influence of principals’ rewarding system on learners’ academic performance in K.C.S.E. in Kisii County.
Ho3 Principals’ rewarding system does not influence learners’ academic performance in K.C.S.E in Kisii County. |
-that reward system had a weak positive influence on academic performance in K.C.S.E but was insignificant. The influence was positive and insignificant (r =.021, N =412, p>.05). Therefore the null hypothesis was upheld.
These results concur with the findings of Oguta (2021) study in Kenya and Comighud and Arevalo (2020) study in the Philippine which found out that the relationship between teachers’ motivation and job performance was insignificant. However, it is contrary to the findings of Schwah and Somerville (2022) which found out that rewarding students improves academic performance. |
Lack of stakeholder support to finance rewards’ programmes and few changes of promotion of hard working teachers as resulted to lose of hope amongst them to work hard. The learners are thus left to struggle on their own. Such occurrence definitely results to poor academic results in many schools. (P5) | These findings confirms the quantitative phase findings that found out that reward system put in place in schools do not contribute to academic performance. The responses made by interviewees suggest that lack of a strong reward system in schools lowers academic performance as had been reported by the study of Ogolla (2017). |
Mixed method discussion
According to table 12, it is indicative that quantitative results show that reward system put in place by the principals in the study locale did not significantly predict learning outcomes and is in agreement with qualitative findings which suggest that due to inadequate funding and unclear promotion policies, the teachers do not get satisfactory and timely rewards. Thus, it fails to positively contribute to learners’ academic performance. These findings are in line with the studies of (Comighud & Arevalo, 2020; Ukandu 2022; Oguta (2021) which together found that teacher motivation programmes do not influence learning outcomes. However, they contrast with the findings of Rukumba (2022) which found out that reward systems put in place contribute in improving performance. The funding suggest that there are other factors that go alongside rewards in resulting to better academic performance (Berry et al., 2019) which includes individual personal needs (Mintrop et al., 2018).
CONCLUSION
The insignificant influence of reward system on learning outcomes suggests that other strategies including determining exact teachers’ and learners’ needs in designing specific rewards may help in realizing their positive impact on teaching and academic performance.
RECOMMENDATIONS
Since improvement on teachers’ commitment and performance depends on good social status because it impact on their morale, school systems should reward teachers to contribute to their morale and commitment. Similarly, the Teachers Service Commission should improve morale and motivation by enhancing that career progression is based on recognition of a teacher’s performance. Similarly, the empirical results reported herein should be considered in light of the following limitation: The first, the research process was affected by time constrains because permission that was granted to the researcher by the employer was short and this forced for arrangements to be made with respondents to be contacted even during the week ends. Secondly, self-reported data from the respondents might have been affected by attribution occurrences, this phenomenon was addressed by cross checking the information between different sources. This study suggests that future studies should be accorded long periods of time and varieties of research instruments.
REFERENCE
- Adebajo, S. (2018). Incentives and teacher effort: Evidence from Lagos, Nigeria. Msc. Thesis, University of San Francisco.
- Amir, S., Jared, T., Nauman, M. M., and Iqra, T. (2019). Does a human resource effect of Job satisfaction of teachers? A case study of education institutions in Punjab, Pakistan. International Journal of Contemporary Education, 2(2), 122-129. Doi: 10.1114/ ijce.v 2i2.4515. URL: https://doi.org/10.11114/ijce.v2i2.4515
- Anol, B. (2012). Social science research: Principals, Methods and Practices. ISBN 13:978-1475146127, University of South Florida, Tampa, Florida, U.S.A.
- Arogundade, B. B. (2019). Staff development and promotion as correlates of teachers’ job satisfaction in secondary schools in Ekiti State, Nigeria. Contemporary Research in Education and English Language Teaching, 1, 41-44. https://doi.org/10.33094/2641023.2019.13.41.44
- Arwa, M. R., Nyakundi, W. A., and Abuga, V. M. (2019). Effects of reward systems on performance of health organizations in Kenya: A case of Aga Khan Hospital- Kisumu. International Journal of Social Science and Information Technology, 5(5), 130-146.
- Assibi, J. K. (2019). Teacher motivation and school performance: Evaluation from three selected senior high schools in Prampram district, Ghana. Unpublished M.Ed. Thesis, University of Cape Town.
- Berry, J., Kim, H. B., and Son, H. (2019).When students’ incentives don’t work: Evidence from a field experiment in Malawi. JEL Classification: 121:015
- Braun, V. and Clarke, V. (2012). Thematic analysis. In H. Cooper, P. M. Camic, D. L. Long, A. T. Panter, D. Rindskopf, and K. J. Sher (Eds), APA handbook of research methods in psychology, . 2: Research designs: Quantitative, qualitative, neuropsychological, and biological, (57-71), Washington, D.C: American Psychological Association.
- Cohen, L., Manion, L., and Morrison, K. (2011). Research methods in education. (7th ed.). New York, NY: Routledge.
- Comighud, S. M. T., and Arevalo, J. M. (2020). Motivation in relation to teachers’ performance. Journal of Scientific and Research Publication. 10(4), 641-653. DOI: 10.29322/IJSRP.10.04.2020.p10071 https://knowledgecenter.ubt-uni.net/conference/ 2020/all_ events/196
- Creswell, J.W. (2014). Research design: Qualitative, quantitative and mixed methods approaches (4th Ed). Thousand Oaks, California: Sage Publications.
- Creswell, J. W., and Creswell, J. D. (2018). Research design: qualitative, quantitative and mixed methods approaches (5thed.). Thousand Oaks, CA Sage Publications.
- Christensen, L. B., Johnson, R.K., and Turner, L. A. (2015). Research methods, design and analysis. (Aypay Translation Ed.) Ankara, Ani. Publishing.
- Daniel, B. K. (2019). Student experiences of the maximum variation framework for determining sample size in qualitative research. In A. Stacy (Ed.), Proceedings of the 18th European conference on research methodology for business and management studies 20th -21st June 2019 (92-100). University of the Witwatersrand, Wits Business School, Johannesburg, South Africa. Academic conferences and publishing international limited. doi.10.34190/ RM.19.075.
- Descombe, M. (2017). The good research guide: For small-scale social research projects. 6th Ed. London: Open University Press.
- Elacqua, G., Hincapie, D., Isabel. H., and Montalva, V.(2019).Can financial incentives help disadvantaged schools to attract and retain high performing teachers? Evidence from Chile, International American Development Bank-IDB Working Paper No. IDB-WP-1080.
- Etikan, I. (2016). Comparison of Convenience Sampling and Purposive Sampling. American Journal of Theoretical and Applied Statistics, 5 (1), 1. https://doi.org/10.11648/ j.ajtas. 20160501.11
- Fetters, M. D., Curry, L. A., and Creswell, J. W. (2013). Achieving integration in mixed methods designs principles and practices. Health Services Research, 48, 2134-2156
- Glykeria, S., Andrew, K., Christine, C., and Charlotte, W. (2024). The concept of integration in mixed methods research: A step-by-step guide using an example study in physiotherapy, Physiotherapy Theory and Practice, 40(2), 197-204, DOI: 10.1080/09593985.2022.2120375 https://doi.org/10.1080/09593985.2022.2120375
- Greatbatch, D., and Tate, S. (2018). Evidence on school leadership in an international context. Government Social Research, Department of Education, U.K. ISBN: 978-1-78105-903-6
- Grissom, J. A., Anna J. E., and Constance A. L. (2021). How Principals Affect Students and Schools: A Systematic Synthesis of Two Decades of Research. New York: The Wallace Foundation. http://www.wallacefoundation.org/principalsynthesis.
- Guetterman, T. C., Fetters, M. D., and Creswell, J. W. (2015). Integrating quantitative and qualitative results in health science mixed methods research through joint displays. Annals of Family Medicine, 13, 554-561.
- Gyansah, S. M. (2020). Effect of school heads transformational leadership practices on students’ academic achievement in Senior high schools in Kumasi Metropolitan, Ghana. Unpublished PhD Thesis, Kenyatta University.
- Hallinger, P., and Murphy, J. (2012). Running on empty? Finding the time and capacity to lead learning: Asia Pacific Centre for Leadership and Change (APCLC) Monograph Series, Number 5, Tai Po, N.T, Hong Kong. DOI: 10.1177/0192636512469288
- Hanushek, E. A. (2011). The economic value of higher teacher quality: Economics of Education Review, doi:10.1016/j.econedurev.2010.12.006
- Kothari, C. R. (2013). Research methodology, methods and techniques, (2nd Revised Edition). New Delhi: New Age International Publishers, New Delhi.
- Leone, T. (2020). Does productivity bonus pay off? The effects of teacher incentive pay on students’ achievement in Brazilian schools, 1-29.
- Mendel, P. (2012). The effective principal: Five pivotal practices that shape instructional leadership. Journal of Staff Development, 33(1),54-58.www.learningforward .org/docs/february-2012/mendels331.pdf.
- Michelmore, K., and Dynarski, S. (2016). The gap within the gap: Using longitudinal data to understand income differences in student achievement, NBER Working Paper No.22474.
- Mintrop, R., and Ordenes, M. (2017). Teachers’ work motivation in the era of extrinsic incentives: Performance goals and pro-social commitments in the service of equity. Educational Policy Analysis Archives, 25(44), http://dx.doi.org/ 10.14507/epaa. 25.2482
- Mintrop, R., Ordenes, M., Coghlan, M., Pryor, L., Madero, C. (2018). Teacher evaluation, pay for performance and learning around instructions: Between dissonant incentives and resonant procedures. Educational Administration Quarterly, 54(1), 3-46, Doi: 10.1177/ 0013161 X17 69558
- Mugenda, O., and Mugenda, A. (2008). Research methods: Quantitative and Qualitative Approaches. Nairobi, African centre for technology studies (Acts) Press.
- Murphy, J., Elliot, S., Goldring, E., Porter, A., (2007). Leadership for learning: A research-based model taxonomy of behaviours. School leadership and Management, 27(2), 179-201.
- Ogola, C. A. (2017). Influence of school Board of Management strategies on students’ performance at K.C.S.E. in Suna West, Migori County, M. Ed., Research Project, University of Nairobi.
- Oguta, P. A. (2021). Teacher motivation methods and their impact on students’ academic performance. International Journal of Novel Research in Education and Learning, 8(5), 1-7. www.noveltyjournals.com
- Omona, J. (2013). Sampling in qualitative research: Improving the quality of research outcomes in high education. Makerere Journal of Higher Education, 4(2), 169-185. Doi.http:// dx.doi.org/10. 4314/majohe.v4i2.4
- Olson, K. (2010). An examination of questionnaire evaluation by experts. Field methods, 22(4),503-529doi:10.1177/1525822X10379795, https://digitalcommons.unl.edu/ sociologyfacpub/136
- Plano Clark, V. L., and Sanders, K. (2015). The use of visual displays in mixed methods research: Strategies for effectively integrating the quantitative and qualitative components of a study. In M. T. McCrudden, G. Schraw, and C. Buckendahl (Eds.), Use of visual displays in research and testing: Coding, interpreting, and reporting data (pp. 177-206). Charlotte, NC: Information Age.
- Republic of Kenya (2015). Teachers Service Commission Code of Regulation for teachers, Nairobi, Kenya.
- Republic of Kenya (2019). National Education Sector Strategic Plan 2018-2022: Kenya Vision 2030, Nairobi.
- Republic of Kenya (2018). Teachers Service Commission Career Progression Guideline, Nairobi, Kenya.
- Roth, S. (2019). The open theory and its enemy: Implicit moralization as epistemological obstacles for general systems theory. Systems Research and Behavioural Science, 2019(3), 1-8. Doi.10. 1002/sres.2590, https://orcid.org/0000-0002-8502-601X
- Rukumba, S. (2022). Effect of reward system on telecommunication industry performance in Kenya. Journal of Human Resource and Leadership, 2(2), 19-26.
- Sadoff, S., Metcalfe, R., and Bugess, S. (2021). Understanding the response to financial and non-financial incentives in education: Field experiment evidence using high –stakes assessments. Economics of Education Review, 85, Article 102195. https://doi.org/10.1016/j.econedurev.2021.102195 http://www.bristol.ac.uk/red/ research -policy/pure/user-guides/ebr-terms/
- Sangoseni, O., Hellman, M., and Hill, C. (2012). Development and validation of a questionnaire to assess the effect of online learning on behaviours, attitudes and clinical practices of physical therapists in United States regarding evidence based practice. Journal of Allied Health Science Practice, 11, 1-12. DOI: 10.46743/1540-580X/2013.1439
- Schwab, J., and Somerville, L. H. (2022), Raising stakes for online learning: Monetary incentives increase performance in a computer-based leaning task under certain conditions. Frontiers in Psychology, 13(780301), 1-12. DOI: 10.3389/fpsyg.2022.780301
- Stosich, E. L., and Bristol, T. J. (2018). Advancing a New Focus on Teaching Quality: A Critical Synthesis. Stanford, CA: Stanford Centre for Opportunity Policy in Education. http://edpolicy.stanford.edu
- Taherdoost, H. (2016). Validity and reliability of the research instruments. How to test the validation of a questionnaire or survey in a research. International Journal of Academic Research in Management, 5(3), 28-36. hal-02546799
- Taherdoost, H. (2017). Determining sample size: How to calculate survey sample size. International Journal of Economics and Management Systems, 2(2017), 237-239. http://www.iaras .org/iaras/journal/ijems
- Taylor, S. L., Bogdan, R., and DeVault, M. L. (2016). Introduction to qualitative research methods: A guidebook and resource (4th Ed.). Hoboken, NJ: John Wiley & Sons.
- Ukandu, V.O. (2022). Employee experiences of reward systems and work performance in undesirable locations. Unpublished PhD dissertation, Walden University
- Wagner, V., Schildberg-Horisch, H. (2018). Monetary and non-monetary incentives for educational attainment: Design and effectiveness. Gutenberg school of Management and Economic and Research Unit. Interdisciplinary Public Policy. Discussion Paper Series No.1821.
- Wallace Foundation (2013). The school principal as leader: Guiding schools to better teaching and learning. http://www.wallacefoundation.org/knowledgecenter/school-leadership/effective-principal-leadership/Pages/The-School-Principal-as Leader-Guiding Schools-to-Better-Teaching-and-Learning.aspx
- Yeasmin, S., and Rahman, K.F. (2012). Triangulation research methods as the tool of social science research. Bup Journal, 1(1).
- Yozgatligil, C. T., and Ayhan, H. O. (2018). Univariate sample size determination by alternative components: Issues on design efficiency for complex samples. Statistics in Transition, 19 (2), 201-208. Doi. 10.21307/stattrans-2018-012.