
Infographics in Geography Education: Fostering Students’ Creativity and Understanding
- Nik Norliati Fitri Md Nor
- Nurul Amalin Fatihah Kamarul Zaman
- Siti Masayu Rosliah Abdul Rashid
- 1295-1302
- Apr 2, 2025
- Education
Infographics in Geography Education: Fostering Students’ Creativity and Understanding
Nik Norliati Fitri Md Nor, Nurul Amalin Fatihah Kamarul Zaman*, Siti Masayu Rosliah Abdul Rashid
School of Distance Education, Universiti Sains Malaysia, 11800 USM, Pulau Pinang
*Corresponding author
DOI: https://dx.doi.org/10.47772/IJRISS.2025.90300102
Received: 27 February 2025; Accepted: 04 March 2025; Published: 02 April 2025
ABSTRACT
This article discusses the use of infographics in geography education to foster creativity and understanding among students. In the digital era, infographics have become an increasingly relevant and effective medium for conveying information. The objective of this study is to assess students’ perceptions regarding the production of infographics as an assessment tool in teaching. The study involves 309 students enrolled in geography courses, comprising both major and minor students in the field at the School of Distance Education, University Sains Malaysia. The methodology employed is quantitative, with data collected through a questionnaire distributed to students using Google Forms. The findings indicate that most students provided positive feedback regarding the production of infographics. Most students believe that infographics make the learning experience more engaging and enjoyable, and they express that it helps them understand information better. Consequently, the use of infographics not only enhances students’ creativity but also serves as an innovative and effective assessment tool in geography education. The results of this study suggest that educational institutions should integrate the use of infographics into the geography curriculum to enhance student engagement and interest. Utilizing infographics as an alternative assessment can provide a more interactive and effective learning experience, thereby preparing students with essential skills in today’s digital world. By leveraging creative and appealing infographic technology, students can demonstrate their ability to translate relevant information and present it effectively, ultimately increasing their motivation and interest in the learning process.
Keywords: infographic, Geography, teaching assessment; creativity, students
INTRODUCTION
Infographics are an emerging method that is gaining popularity in education. Nowadays, they have become widely used across various sectors (Jaleniauskiene & Kasperiuniene, 2023). Infographics combine text and visual components to provide information in a concise and engaging approach (Burgio & Moretti, 2017). In geography education, infographics are a useful tool to assist students understand complex concepts while stimulating their creativity. Geography is a subject that studies natural phenomena, human-environment interactions, and socioeconomic issues. As a result, effective teaching practices are required in geography education to ensure that students grasp and utilize what they have learned. Infographics offer an appealing method for delivering information via visuals, charts, and illustrations. Utilizing infographics enables students to visualize the interconnections among geographical subjects more clearly consequently enhancing their understanding of the subject. Moreover, the incorporation of infographics in education provides students with an opportunity to develop both technical and creative skills. The creation of infographics necessitates the utilization of digital resources, including graphic design software and web applications. This facilitates students’ excellent data analysis and fosters innovative expression of their thoughts. These skills are especially useful in the current highly competitive employment environment. One of the principal advantages of infographics is the ability to present information in an attractive and easily comprehensible manner. Infographics improve knowledge retention, engagement, and critical thinking in students by integrating visual and verbal components. The incorporation of infographics in geography education constitutes a contemporary and efficient instructional approach that fosters cognitive advancement and digital literacy.
In geography education, infographics is an effective way of portraying topics such as climate change, human migration patterns, and the distribution of natural resources. Utilizing attractive data visualizations helps students to easily learn complex concepts and relate them to real-world scenarios. This study aims to assess students’ perceptions of infographic-based assessments in geography education. A total of 309 students enrolled in a Geography course at the School of Distance Education, University Sains Malaysia, participated in this study. A quantitative research methodology was employed, with data collected through a structured questionnaire distributed to students. The findings are expected to provide valuable insights into the effectiveness of infographics in enhancing students’ learning experiences and engagement. Ultimately, incorporating infographics in geography education not only enriches students’ learning experiences but also prepares them to navigate an increasingly complex world with a well-grounded understanding of geographical phenomena.
LITERATURE REVIEW
In the digital era, the use of infographics in geography education has become even more important since knowledge is shared quickly and in several media. An efficient technique for information distribution is infographics, which combine text and graphic components (Burgio & Moretti, 2017; Dunlap & Lowenthal, 2016; Siricharoen & Siricharoen, 2015). The ability of infographics to convey facts in an interesting and understandable format renders it especially effective for depicting geographical phenomena. By utilizing infographics, students can more clearly perceive the relationships between various geographical elements, ultimately improving their understanding of the subject.
Infographics facilitate the concise and structured delivery of information, making them particularly suitable for students who may struggle with comprehending lengthy or complex texts (Jaleniauskiene & Kasperiuniene, 2023). Creativity plays a crucial role in the learning process, as it enhances students’ motivation and academic performance (Goulet-Pelletier et al., 2023). The creation of infographics provides students with opportunities to explore new ideas and apply critical thinking skills (Jaleniauskiene & Kasperiuniene, 2023; Toth, 2013). This process goes beyond data collection; it involves analysis and the innovative presentation of information. A study by Li (2023) found that students engaged in creative activities demonstrated significant improvements in academic achievement. With advancements in information technology, the development of infographics has become more accessible through digital tools such as Canva, Adobe and Venngage (Traboco et al., 2022). These platforms enable students to design visually appealing and informative infographics without requiring advanced design skills.
The use of technology in infographic creation enhances student engagement and facilitates broader access to information. In this context, infographics serve not only as a learning tool but also as a medium for creative expression. Despite their numerous advantages, the use of infographics in education presents certain challenges. Primarily not all students have the technical skills required to produce high-quality infographics, potentially leading to disparities in academic achievement. Additionally, the creation process can be time-consuming, particularly for students who are unfamiliar with infographic design. The pressure to meet high expectations in producing visually appealing final products may lead to stress. Students may also struggle with selecting relevant information and organizing it in a logical and engaging manner, which can result in inaccurate or incomplete content delivery. Darcy (2019) emphasizes the importance of providing students with clear expectations and examples of past student work. By offering multiple student exemplars, educators help set realistic standards and guide students in creating quality infographics within their skill level. Integrating infographics into the geography curriculum can not only enhance student engagement and interest in the subject but also equip them with essential skills for the future. Active student participation in infographic creation fosters a more meaningful and effective learning experience. This approach aims to empower future generations to develop a deeper understanding of their surroundings through a geographical perspective while effectively utilizing digital skills in their daily lives. Beyond enriching the learning experience, infographics provide a platform for students to express their perspectives on contemporary geographical issues in a creative and innovative manner. It is crucial to recognize that education is not limited to the traditional transmission of knowledge but also involves active
student engagement in the learning process. By leveraging tools such as infographics, educators can create a more dynamic and interactive learning environment. This approach not only enhances students’ understanding
of geography but also equips them with broad knowledge and creative thinking skills for the future. By adopting this method, geography education is expected to become more relevant and engaging for the younger generation, ultimately fostering a society that is more aware of both global and local issues and capable of making informed decisions based on a deep understanding of the world around them.
METHODOLOGY
This study employed a quantitative approach to assess students’ perspectives on the use of infographics as an assessment tool in geography education. The quantitative approach allowed for the collection of measurable data that was statistically analyzed, providing an objective insight into students’ perceptions of infographics. The study population consisted of students enrolled in geography courses at the School of Distance Education, University Sains Malaysia, with a total of 309 participants, including both major and minor geography students. A random sampling method was employed to ensure a balanced representation of both groups in the data collection process.
The primary instrument used in this study was a specially designed questionnaire tailored to the research objectives. The questionnaire consisted of several sections, including respondent demographic information, questions related to the use of infographics in teaching, and students’ experiences in creating infographics. Data collection was conducted online via Google Forms to facilitate accessibility and allow respondents to complete the survey at their convenience. Prior to distribution, a pilot test was conducted with a small group of students to ensure the clarity and appropriateness of the questions. The data collection period spanned two weeks to ensure that all respondents had sufficient opportunity to provide feedback. The collected data were analyzed using statistical software such as SPSS (Statistical Package for the Social Sciences), employing descriptive analysis to provide an overview of respondents’ demographic backgrounds and their perceptions of infographic use. Overall, this study adopted a carefully designed methodology to ensure accurate and relevant data collection, yielding reliable insights into students’ perspectives on the use of infographics in geography education. The findings aim to assist educators in developing more effective teaching strategies.
RESULT AND DISCUSSION
This study involved a total of 309 students majoring or minoring in Geography. Among the respondents, 60.2% (186 students) were male, while 39.8% (123 students) were female. Further analysis revealed that the highest proportion of participants were second-year students, accounting for 51.5% (159 students). This relatively high number may be attributed to the larger enrollment of students minoring in Geography in the second year compared to other years. Conversely, the lowest participation was recorded among fifth-year students, representing only 3.9% (12 students) (see Table 1).
Table 1. Profile of Students Involved in This Study
| Demographic Profile | Frequency (n) | Percentage (%) |
| 1. Gender | ||
| Male | 186 | 60.2 |
| Female | 123 | 39.8 |
| 2. Year of study | ||
| Year 1 | 61 | 19.7 |
| Year 2 | 159 | 51.5 |
| Year 3 | 30 | 9.7 |
| Year 4 | 47 | 15.2 |
| Year 5 | 12 | 3.9 |
| Total | 309 | 100% |
The findings of this study indicated that, when addressing the question of infographic creation, most students believed that it significantly enhanced their understanding of specific information delivery. A total of 97.1% of respondents reported that creating infographics had a positive impact on their comprehension. These findings
highlight the critical role of infographics as a learning tool, particularly in the context of geography education. Infographics serve as visual representations that systematically and engagingly organize information. By integrating text, graphics, and illustrations, infographics facilitated students’ understanding of complex concepts. In this study, students were required to create infographics as part of their coursework assessment, and the results demonstrated that this approach not only improved comprehension but also fostered active engagement in the learning process. The use of infographics in educational settings enabled students to perceive connections between data and information more clearly. This was attributed to the fact that visualization aids the human brain in processing information more rapidly and efficiently. Previous studies have shown that the brain can process visual data up to 60,000 times faster than text, making infographics a highly effective tool for information dissemination. Consequently, students were able to grasp key information more effectively and retain it for a longer period. Heimbürger & Isomöttönen (2019) and Basak et al. (2017) found that students who utilized infographics retained information more effectively than those who relied solely on text-based graphics.
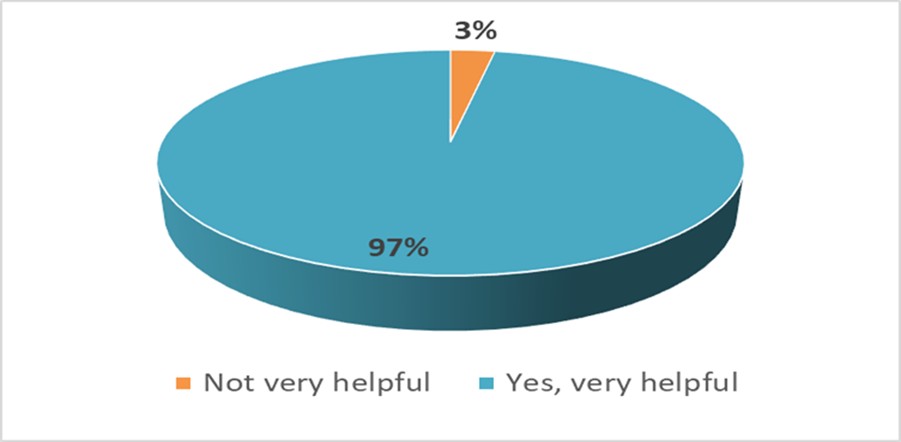
Figure 1. Students’ perspectives on the development of infographics as a tool to enhance their understanding in conveying specific information.
Furthermore, the creation of infographics provided students with an opportunity to express their creativity. The process of designing infographics required critical thinking and design skills, which indirectly enhanced student engagement in learning. Students were not merely passive recipients of information but also active contributors capable of presenting their ideas in innovative and visually appealing ways. This process fostered a sense of accomplishment, as students could see the tangible results of their work and feel that they had achieved something meaningful. From a pedagogical perspective, the use of infographics increased students’ motivation to learn. By equipping them with tools to visually express their understanding, students became more engaged and interested in the learning process. This, in turn, contributed to improved academic performance, as they were not only learning to pass exams but also to comprehend and apply knowledge in real-world contexts. Overall, the findings of this study indicated that incorporating infographics as an instructional assessment tool was an effective approach to enhancing students’ understanding of specific information. With 97.1% of respondents agreeing that infographics were highly beneficial, it is recommended that educational institutions integrate infographic-based learning into their curricula. The findings of this study align with Çifçi (2016), who found that the use of infographics in geography education enhanced students’ academic achievement and fostered positive attitudes. This approach not only enriched the learning experience but also equipped students with essential skills required in the digital era. The use of infographics as an interactive and engaging learning strategy had a positive impact on students’ motivation and interest, ultimately improving the overall effectiveness of the learning process.
Besides that, the findings of this study revealed highly positive perceptions among students regarding the use of infographics. Specifically, 99% of students reported that well-designed infographics enhanced their ability to convey information more quickly and efficiently. This result highlights the effectiveness of infographics as a communication tool in education, particularly when students are required to create infographics as part of their coursework assessment. Infographics serve as a visual representation that systematically organizes information, making it more accessible and comprehensible. By incorporating graphic elements, colors, and concise text, infographics effectively capture readers’ attention and facilitate a quicker understanding of key information. These findings demonstrate that the visualization of learning materials in geography can significantly enhance students’ comprehension and engagement with the subject matter (Akhmad et al., 2018).
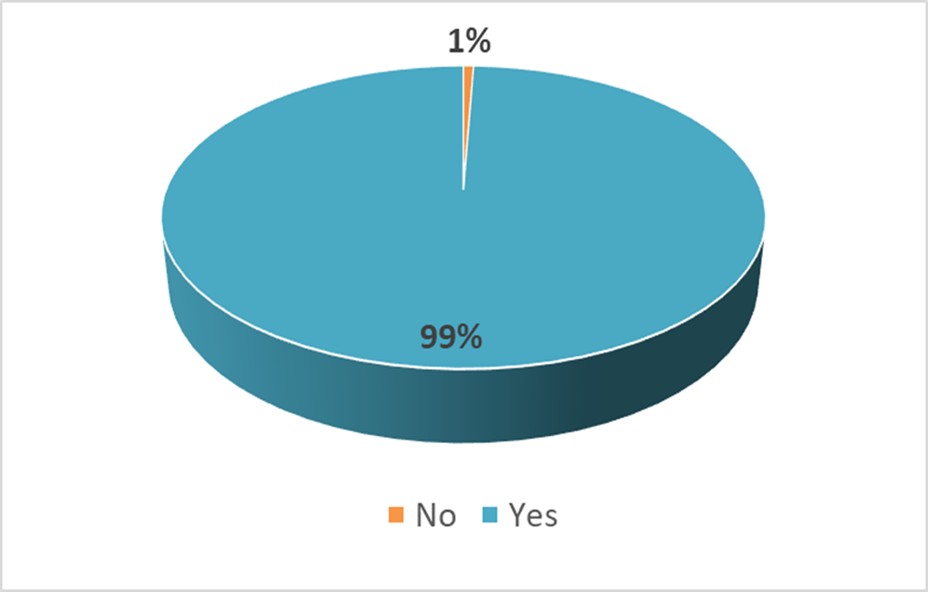
Figure 2. Students’ perspectives on the role of engaging infographics in enhancing the efficiency of information distribution.
The visual nature of infographics enables students to communicate ideas and data more clearly, reducing the need for lengthy and potentially tedious text. Through infographic creation, students utilize symbols and graphics to illustrate concepts that are difficult to explain through words alone. This not only accelerated information delivery but also enhanced audience comprehension. The process of designing infographics encouraged students to think critically and creatively. They had to analyze the information they intended to present and determine the most effective way to represent it visually. This involved selecting appropriate design elements, organizing content strategically, and utilizing appealing colors and fonts. In doing so, students not only improved their ability to convey information but also honed their design skills and critical thinking abilities. From a pedagogical perspective, integrating infographics into assessment strategies increased students’ motivation to engage in the learning process. When students had tools to visually express their understanding, they were more likely to show interest and participate actively. This, in turn, contributed to their academic achievement, as they were not merely preparing for exams but also developing a deeper understanding of knowledge and its real-world applications.
Overall, the findings of this study demonstrated that utilizing infographics as a teaching assessment tool was highly effective in enhancing information delivery. With 99% of respondents agreeing that engaging infographics helped them communicate information more quickly and efficiently, it is imperative for educational institutions to continue integrating infographics into their curricula. This approach not only enriched the learning experience but also equipped students with essential skills necessary for the digital age. The use of infographics as an interactive and engaging learning tool had a positive impact on student motivation and interest, ultimately enhancing the overall effectiveness of the learning process.
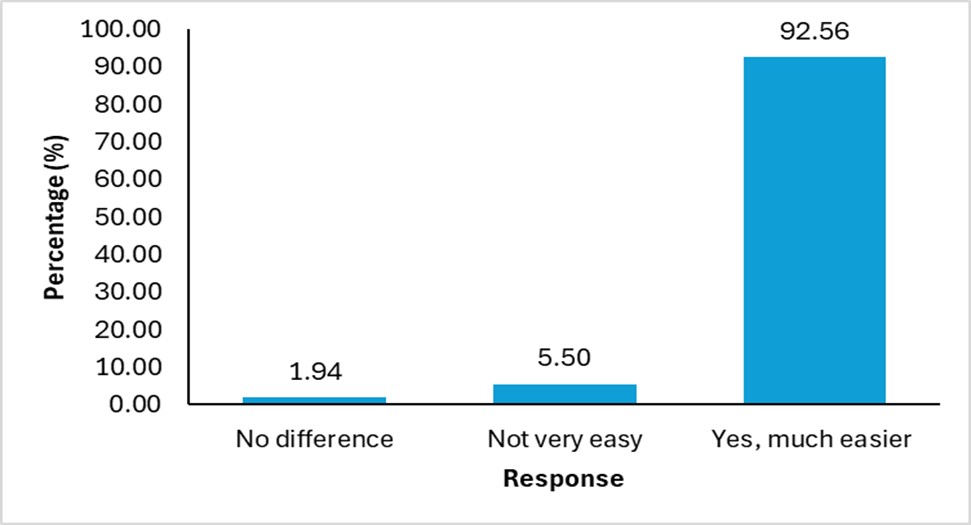
Figure 3. Percentage of student responses regarding their understanding of infographics compared to written reports.
Figure 3 indicated that majority of respondents (92.56%) agreed that well-designed infographics were easier to understand compared to lengthy written reports. A small proportion of respondents (5.50%) perceived infographics as less comprehensible, while 1.94% stated that both formats provided the same level of understanding. These findings highlight the effectiveness of visual elements in enhancing comprehension, as infographics help simplify complex concepts, thereby improving students’ understanding. Additionally, the results suggest the potential of infographics as an alternative learning tool, particularly for students who prefer visual learning. This is further supported by the study conducted by Akhmad et al. (2018), which demonstrated that humans tend to focus more on images than text. Their study found that 90% of the information conveyed was visual, whereas only 20% of the information read in text form was retained. This is because the human brain is more inclined to process and store information visually. However, a small number of respondents disagreed with the notion that infographics were easier to understand. This may be attributed to factors such as individual learning styles, familiarity with using infographics, or the quality of infographic design itself.
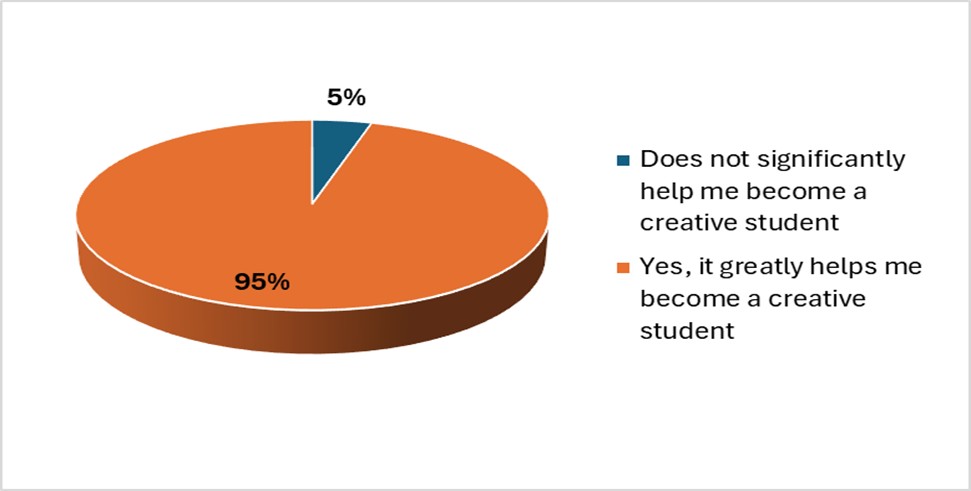
Figure 4. Percentage of students’ responses on the impact of infographics in enhancing creativity.
Infographics also had a positive impact on students’ creativity. As illustrated in Figure 4, majority of respondents (95%) agreed that creating infographics significantly enhanced their creativity, while only 5% stated that infographics were not particularly helpful in this aspect. This finding aligns with previous research, as Toth (2013) observed that the process of creating infographics encouraged learners to develop greater creativity. These findings indicated that the process of developing infographics not only required a thorough understanding of a given topic but also encouraged students to think innovatively in structuring and presenting information visually (Jaleniauskiene & Kasperiuniene, 2021). This activity involved elements of design, the selection of appropriate visual components, and the effective organization of data, all of which contributed to the development of creativity. However, the small percentage (5%) of respondents who perceived minimal benefits might have faced challenges due to a lack of technical skills in infographic creation. Therefore, guidance on producing effective infographics was necessary to ensure that all students could fully benefit from this activity. For instance, introducing applications such as Canva, which provided thousands of customizable templates and design options, could enhance students’ skills in creating high-quality infographics (Mubarok & Asri, 2020).
CONCLUSION
This study has demonstrated that the use of infographics in geography education not only serves as an effective tool for information delivery but also enhances student engagement and interest in learning. Through infographic creation, students not only gained a deeper understanding of complex concepts but also had the opportunity to express their creativity. With 92% of students reporting that infographics helped them understand information more effectively, it is evident that this visual approach plays a crucial role in education. Infographics have been shown to facilitate comprehension by presenting information in an engaging visual format, making it more digestible than lengthy textual explanations. These findings indicate that visual approaches in teaching can help overcome common challenges faced by students in understanding geographical concepts. In this context, infographics are not merely tools for data presentation but also serve as a bridge connecting theoretical knowledge with practical applications. By visualizing how geographical concepts apply to real-world situations, students found learning to be more relevant and meaningful.
Furthermore, active student participation in creating infographics provided them with a more enriching and enjoyable learning experience. This creative activity not only increased student motivation but also fostered essential social and technical skills for their future. The collaborative nature of infographic design allowed students to learn from one another, share perspectives and ideas, and develop communication skills necessary for their careers. In this way, infographics not only enhanced academic comprehension but also enriched students’ social learning experiences.
Overall, the findings of this study provide valuable insights for educators in designing more innovative and interactive teaching strategies. The use of infographics as an alternative assessment tool has demonstrated significant potential in improving the effectiveness of geography education, ultimately fostering students who are more proactive and competitive on a global scale. In higher education, the integration of infographics can help universities and other institutions meet the growing demand for interactive and engaging learning methods. Educators should take the initiative to train students in using digital tools effectively, as these skills are critical for their future success. In conclusion, the use of infographics in geography education not only enhanced students’ academic understanding but also equipped them with creative tools essential for their daily lives. With this approach, geography education can become more relevant and appealing to younger generations, fostering a society that is more aware of global and local issues and capable of making informed decisions based on a comprehensive understanding of the world around them. By adopting such teaching strategies, educators can cultivate individuals who are not only academically excellent but also capable of making meaningful contributions to society.
REFERENCES
- Akhmad, R., Sugandi, D., & Nandi, N. (2018). Infographic design as visualization of geography learning media. IOP Conference Series: Earth and Environmental Science, 145(1), 012011.
- Basak, B., Yucehan, Y., Huseyin, U., & Deniz, Ö. (2017). Can infographics facilitate the learning of individuals with mathematical learning difficulties? International Journal of Cognitive Research in Science, Engineering and Education, 5(2), 119–128.
- Burgio, V., & Moretti, M. (2017). Infographics as Images: Meaningfulness beyond Information. 891. https://doi.org/10.3390/proceedings1090891
- Çifçi, T. (2016). Effects of infographics on students’ achievement and attitude towards geography lessons. Journal of Education and Learning, 5(1), 154–166.
- Darcy, R. (2019). Infographics, assessment and digital literacy: innovating learning and teaching through developing ethically responsible digital competencies in public health. Annual Conference of the Australasian Society for Computers in Learning in Tertiary Education 2019, 112–120.
- Dunlap, J. C., & Lowenthal, P. R. (2016). Getting graphic about infographics: design lessons learned from popular infographics. Journal of Visual Literacy, 35(1), 42–59.
- Goulet-Pelletier, J.-C., Gaudreau, P., & Cousineau, D. (2023). Do students motivated to learn have better creative abilities? Learning and Individual Differences, 106, 102327.
- Heimbürger, A., & Isomöttönen, V. (2019). Infographics as a reflective assignment method in requirements engineering e-course? 2019 IEEE Frontiers in Education Conference (FIE), 1–5.
- Jaleniauskiene, E., & Kasperiuniene, J. (2021). Visual literacy development through infographics. European Conference on Information Literacy, 189–200.
- Jaleniauskiene, E., & Kasperiuniene, J. (2023). Infographics in higher education: A scoping review. E-Learning and Digital Media, 20(2), 191–206. https://doi.org/10.1177/20427530221107774
- Li, W. (2023). On the role of creativity in the application-oriented university students’ engagement and success. In Heliyon (Vol. 9, Issue 6). Elsevier Ltd. https://doi.org/10.1016/j.heliyon.2023.e17374
- Mubarok, F. U., & Asri, A. N. (2020). Infographics: Media for improving students’ writing abilities. KnE Social Sciences.
- Siricharoen, W. V., & Siricharoen, N. (2015). How infographic should be evaluated. Proceedings of the 7th International Conference on Information Technology (ICIT 2015), 558–564.
- Toth, C. (2013). Revisiting a genre: Teaching infographics in business and professional communication courses. Business Communication Quarterly, 76(4), 446–457.
- Traboco, L., Pandian, H., Nikiphorou, E., & Gupta, L. (2022). Designing infographics: visual representations for enhancing education, communication, and scientific research. Journal of Korean Medical Science, 37(27).