
Learners’ Conceptual Understanding on Force, Motion, and Energy: Its Relationship with Motivation
- Hayany Madca
- Cheva Balinton
- Christian Agustin
- Edna B. Nabua
- 486-499
- Mar 27, 2025
- Education
Learners’ Conceptual Understanding on Force, Motion, and Energy: Its Relationship with Motivation
Hayany Madca, Cheva Balinton, Christian Agustin and *Edna B. Nabua
Mindanao State University-Iligan Institute of Technology, Philippines
DOI: https://dx.doi.org/10.47772/IJRISS.2025.90300039
Received: 14 February 2025; Accepted: 24 February 2025; Published: 27 March 2025
ABSTRACT
Physics education plays a crucial role in developing critical thinking, problem-solving skills, and scientific literacy. However, Grade 7 learners frequently encounter difficulties in grasping fundamental physics concepts. This study investigated the level of conceptual understanding of learners and the relationships between level of motivation and the level of conceptual understanding of force, motion, and energy and five motivational factors (intrinsic, self-efficacy, self-determination, grade, and career) among Grade 7 learners in selected private schools in the Philippines. Employing a mixed-methods approach, a thirty (30) -item assessment tool, aligned with the MATATAG Curriculum, was developed and validated. A pilot test was administered to One Hundred Twenty (120) learners. The validated instrument was administered to forty (40) participants. Findings revealed significant learning gaps in conceptual understanding, with only one student (2.5%) achieving the passing standard. Distance-time graphs, followed by heat transfer, were identified as the most challenging topics. Spearman’s rank correlation analysis revealed moderately positive relationships between conceptual understanding and intrinsic motivation (ρ = .784, p < .001), grade motivation (ρ = .703, p < .001), and career motivation (ρ = .784, p < .001). A statistically significant, but weaker, positive relationship was found between conceptual understanding and self-determination (ρ = .422, p = .007). In contrast, the relationship between self-efficacy and conceptual understanding was not statistically significant (ρ = .299, p = .061). These results highlight the need for possible instructional interventions addressing specific conceptual difficulties and suggest that fostering intrinsic, grade, and career motivation may be beneficial. The study recommends incorporating strategies that enhance higher-order thinking skills, connect learning to real-world applications and career paths, and provide targeted support in challenging topics to improve both motivation and conceptual understanding in physics.
Keywords: Conceptual Understanding, Energy, Force, Motion, Motivation
INTRODUCTION
Physics education plays a crucial role in developing critical thinking, problem-solving skills, and scientific literacy, equipping individuals to understand the natural world around them. However, for many learners, physics can be a challenging subject due to its abstract concepts and reliance on mathematical reasoning. Studies have shown that Filipino learners completing junior high school under the K-to-12 program struggle with topics like mechanics (force, motion, and energy) [1]. These difficulties often stem from a perceived lack of real-world application, as learners fail to connect physics concepts to their daily lives [2]. This disconnect hinders not only academic performance in physics but also potentially discourages learners from pursuing careers in Science, Technology, Engineering, and Mathematics (STEM) fields [3].
While research suggests a positive connection between STEM education and real-world problem-solving skills [4], bridging the gap between theoretical understanding and practical application remains a challenge. Incorporating more real-world examples and applications into the physics curriculum may bridge. The Department of Education’s MATATAG Curriculum aims to address this by emphasizing foundational skills, reducing content overload, and promoting active learning experiences [5]. Specifically, for Grade 7 learners, the curriculum introduces fundamental physics concepts that are critical for future understanding.
However, research highlights a lack of tools specifically designed to assess learners’ needs in physics at the Grade 7 level [6]. This lack of information makes it difficult to design targeted interventions that bridge the gap between theory and application. While the MATATAG Curriculum strives to address student learning needs, evidence suggests that Grade 7 learners are still encountering difficulties with specific physics topics. This raises questions about the effectiveness of current teaching strategies and materials. Without a comprehensive understanding of learners’ needs, educators cannot target interventions effectively. Consequently, this study aims to develop and validate a comprehensive assessment tool tailored for Grade 7 physics. It assessed learners’ conceptual understanding of force, motion, and energy, as well as their level of motivation towards the subject.
Developing and validating a physics assessment tool for Grade 7 learners is geared to provide educators with valuable data to support possible intervention and strategies, ensuring learners acquire the knowledge and skills necessary for success in physics and related fields. Ultimately, this research aimed to benefit various stakeholders in science education in the Philippines, including learners, teachers, curriculum developers, and policymakers. By improving assessment practices and focusing on building a strong foundation in physics at an early stage, this study hopes to contribute to improved science literacy, increased interest in STEM fields, and better preparation for future STEM-related careers.
Several key research objectives are: First, this assesses the conceptual understanding of 7th-grade learners in the areas of force, motion, and energy. Second, it seeks to determine the levels of motivation among these learners in physics, specifically focusing on intrinsic motivation, self-determination, self-efficacy, grade motivation, and career motivation. Lastly, the study examines the relationship between the learners’ conceptual understanding and their motivation in the subject.
METHODS
To achieve the objectives, the developed instrument was administered to a sample of 7th graders (n=120 for pilot testing, n=40 for the final assessment) from a private school in the Philippines. This process did not only evaluate the efficacy of the assessment tool itself but also identify learners mastered and unmastered competencies, pinpointing areas that require the most attention in future learning experiences
This study employed a mixed-methods approach to investigate the relationship between conceptual understanding of force, motion, and energy and various motivational factors among Grade 7 learners. The research comprised two main phases: the instrument development and the data collection and analysis. The first phase focused on developing a valid and reliable multiple-choice assessment tool aligned with the DepEd MATATAG Curriculum for Grade 7 physics. This 30-item instrument was designed to assess conceptual understanding of force, motion, and energy and underwent rigorous expert validation. Experts evaluated each item based on language appropriateness, clarity, alignment with curriculum competencies, suitability of response options, real-world applicability, and relevance to identified learning gaps. Furthermore, items were mapped to Bloom’s Taxonomy levels to ensure cognitive rigor and international relevance.
In the second phase, the validated assessment tool was administered to forty (40) Grade 7 learners from a private school in the Philippines to evaluate their conceptual understanding. To measure motivation, the Physics Motivation Questionnaire II (PMQ-II) was adapted to capture dimensions of intrinsic motivation, self-efficacy, self-determination, grade motivation, and career motivation. The assessment results provided insights into specific physics competencies where learners demonstrated the lowest mastery, identifying key learning gaps. Spearman’s rank correlation analysis was then used to examine the relationships between the learners’ scores on the conceptual understanding assessment and their scores on each of the motivational dimensions from the adapted PMQ-II. This correlational analysis aimed to determine the extent to which different types of motivation are associated with conceptual understanding in force, motion, and energy, ultimately informing the development of targeted interventions to improve engagement and learning outcomes
The pilot test was conducted to evaluate the validity and reliability of the assessment tool, which involved One Hundred Twenty (120) learners. Systematic sampling was used to select participants from four Grade 7 classroom sections (A, B, C, and D). Specifically, every second student was selected from alphabetized class lists of Sections A (n = 20) and D (n = 20), with the remaining learners from these sections reserved for the main study. All learners from Sections B (n = 41) and C (n = 39) also participated in the pilot test. Six learners, initially approached, declined to participate, resulting in a final pilot test sample of 120.
The main study with the final 30-item needs assessment was conducted to forty (40) learners from Sections A and D. The inclusion criteria for both phases were Grade 7 learners aged 11 to 13 years old. The study aimed for a diverse representation of learners and did not employ specific sampling strategies based on cultural background, gender, or socioeconomic status.
The development and validation of the needs assessment tool followed a systematic, multi-stage process. Initially, Version 1 of the instrument was developed by researchers based on the content standards and learning competencies outlined in the DepEd MATATAG Curriculum. This focused on four key topics: balanced and unbalanced forces, displacement and velocity, distance-time graphs, and heat transfer. A Table of Specifications (TOS) guided item distribution across these topics and Bloom’s Revised Taxonomy cognitive levels, ensuring content validity [7]. Version 1 comprised of forty (40) items, including multiple-choice, essay, and illustration-based questions. This version underwent face validation by three experts in content and methods. A pilot test of Version 1 was then conducted with One Hundred Twenty (120) Grade 7 learners from a private school using systematic sampling across four classroom sections.
Data from the pilot test were analyzed using the DepEd Grading Scale (2015), item difficulty and discrimination indices, and distractor analysis, adhering to recommended time limits for multiple-choice items [9][10]. Based on the expert feedback and pilot test results, the instrument was revised, resulting in a thirty (30) -item final version. This final version, along with an adapted Physics Motivation Questionnaire (PMQ-II) [11], was administered to forty (40) Grade 7 learners from the same school to assess both conceptual understanding and motivation across five dimensions: intrinsic motivation, self-efficacy, self-determination, grade motivation, and career motivation. Student responses to the PMQ-II were collected using a four-point Likert scale.
The data analysis for this study was conducted in three stages. First, student academic performance on the needs assessment was evaluated using the DepEd Grading Scale. Mean Percentage Scores (MPS) were calculated to identify physics topics where learners demonstrated the least mastery [12]. These MPS values were then interpreted using descriptive equivalents, providing a standardized measure of student performance. This analysis aimed to pinpoint specific areas of conceptual difficulty within the force, motion, and energy topics.
The responses from the motivation questionnaire were analyzed using frequency counts. The frequency of each response option for every item on the questionnaire was calculated to identify prevalent patterns and trends in student responses. This analysis provided insights into the overall levels of motivation across the five dimensions measured: intrinsic motivation, self-efficacy, self-determination, grade motivation, and career motivation. By examining the distribution of responses on the Likert scale, the analysis aimed to understand learners’ perceptions and attitudes toward physics.
To investigate the relationship between conceptual understanding and motivation, Spearman’s rank correlation (Spearman’s ρ) was employed. This non-parametric statistical method was chosen due to the potential non-normal distribution of the assessment scores and the ordinal nature of the motivation data collected using the Likert scale. Spearman’s ρ allowed for an examination of the monotonic relationship between the ranked scores on the needs assessment (representing conceptual understanding) and the ranked scores on each of the five motivation dimensions. This analysis aimed to determine the strength and direction of any associations between these two key variables.
RESULTS AND DISCUSSION
Development. The development of the assessment tool began with the creation of Version 1, comprising 40 items designed to assess conceptual understanding of force, motion, and energy based on the DepEd MATATAG Curriculum. This initial version underwent rigorous face validation by three experts specializing in physics, test construction, and English. Using a Likert scale (1-4), the experts evaluated each item across several parameters: clarity, wordiness, appropriateness of responses, real-world application, and relevance to the research problem [13].
Table 1. Summary of Validators Rating
| No. | Parameters | No. | Parameters | ||||||||
| Clarity | Wordiness | Appropriateness of responses listed | Application to praxis | Relevance to the problem. | Clarity | Wordiness | Appropriateness of responses listed | Application to praxis | Relevance to the problem. | ||
| Q1 | 4 | 4 | 4 | 3.67 | 4 | Q21 | 4 | 4 | 4 | 3.67 | 4 |
| Q2 | 4 | 3.33 | 3.67 | 3.33 | 4 | Q22 | 4 | 4 | 4 | 4 | 4 |
| Q3 | 4 | 4 | 4 | 3.33 | 4 | Q23 | 4 | 4 | 4 | 3.67 | 4 |
| Q4 | 4 | 4 | 3.33 | 3.33 | 4 | Q24 | 4 | 4 | 4 | 4 | 4 |
| Q5 | 4 | 4 | 4 | 4 | 4 | Q25 | 4 | 4 | 4 | 3.67 | 4 |
| Q6 | 3.33 | 4 | 4 | 3.33 | 4 | Q26 | 4 | 4 | 4 | 4 | 4 |
| Q7 | 4 | 4 | 4 | 4 | 4 | Q27 | 4 | 4 | 4 | 4 | 4 |
| Q8 | 3.67 | 4 | 4 | 3.67 | 3.67 | Q28 | 4 | 4 | 4 | 4 | 4 |
| Q9 | 4 | 4 | 4 | 4 | 4 | Q29 | 4 | 4 | 4 | 3.67 | 4 |
| Q10 | 4 | 4 | 4 | 4 | 4 | Q30 | 4 | 4 | 4 | 4 | 4 |
| Q11 | 4 | 4 | 4 | 3.67 | 4 | Q31 | 4 | 4 | 4 | 3.67 | 4 |
| Q12 | 4 | 4 | 4 | 3.67 | 4 | Q32 | 4 | 4 | 4 | 3.67 | 4 |
| Q13 | 4 | 3.67 | 4 | 3.67 | 4 | Q33 | 4 | 4 | 4 | 4 | 4 |
| Q14 | 4 | 4 | 4 | 4 | 4 | Q34 | 4 | 4 | 4 | 4 | 4 |
| Q15 | 4 | 4 | 4 | 3.67 | 4 | Q35 | 3.67 | 3.67 | 3.67 | 3.67 | 3.67 |
| Q16 | 4 | 4 | 4 | 4 | 4 | Q36 | 4 | 4 | 4 | 3.67 | 4 |
| Q17 | 4 | 4 | 4 | 3.67 | 4 | Q37 | 4 | 3.67 | 3.67 | 4 | 4 |
| Q18 | 4 | 4 | 4 | 3.67 | 4 | Q38 | 3.67 | 3.67 | 3.67 | 3.67 | 3.67 |
| Q19 | 4 | 4 | 4 | 3.67 | 4 | Q39 | 3.67 | 3.67 | 3.67 | 4 | 4 |
| Q20 | 4 | 4 | 4 | 3.67 | 4 | Q40 | 4 | 3.67 | 3.67 | 4 | 4 |
Legend: 1.00–1.74: Not Acceptable, 1.75–2.49: Below Expectations, 2.50–3.24: Meets Expectations, 3.25–4.00: Exceeds Expectations
Validation and revision. Table 2 summarized the feedback from the experts through thematic analysis. This provided valuable insights for revising the instrument. Key themes emerged from their comments and suggestions.
Table 2. Thematic Analysis of Validators’ Comments/Suggestions
| Theme | Description | Sample Comments |
| Clarity and Conciseness | Emphasis on simplifying language, avoiding redundancy, and improving clarity in the phrasing of questions. | Validator 1 suggested redacting redundant wording in Question #2.
Validator 3 recommended adjusting phrasing for clarity in Questions #6 and #8. |
| Contextualization and Relatability | Focus on making questions relatable to learners by using real-life scenarios, local settings, and daily-life activities. | Validator 2 suggested contextualizing questions with local or daily-life scenarios.
Validator 3 recommended adding relatable examples, like “A car accelerating on a highway.” |
| Question Structure and Response Types | Standardizing question formats and focusing on clearer, more specific answer options, with fewer open-ended questions. | Validator 2 recommended moving to multiple-choice formats like PISA tests.
Validator 3 suggested more specific response options (e.g., specifying “initially at rest“). |
| Scientific Accuracy and Terminology | Ensuring accuracy in scientific terminology and definitions to avoid confusion and understanding. | Validator 1 suggested rephrasing Question #32 about thermoelectric generators for clarity.
Validator 3 proposed changes to Question #14 Theme |
| Readability and Language Appropriateness | Making sure the language is suitable for Grade 7 learners and checking for readability.
|
Validator 2 recommended checking readability.
Validator 1 suggested replacing “insulating” with more familiar terms. |
| Feedback on Specific Questions
|
Providing detailed revisions for individual questions to improve their clarity, scientific alignment, and accuracy. | Validator 3 suggested changes to Questions #1, #2, and #4 for better clarity.
Validator 1 recommended changes to various questions for precision and better phrasing. |
A primary concern was the need for greater clarity and conciseness in question phrasing to minimize ambiguity and ensure student comprehension. Experts recommended simplifying complex sentences, refining response options, and avoiding overly technical language. Contextualization and relatability were also emphasized, with suggestions to incorporate real-life scenarios and localized examples to enhance student engagement and understanding. Regarding question structure, the experts recommended primarily using multiple-choice formats for consistency and ease of scoring, advising against open-ended questions unless necessary. Ensuring scientific accuracy and precise terminology was another crucial theme, with recommendations to carefully review definitions, concepts, and examples for alignment with physics principles. Finally, readability and appropriateness of language for Grade 7 learners were highlighted, with experts emphasizing the need for age-appropriate vocabulary and sentence structure.
Pilot Test. Based on this comprehensive feedback from both the quantitative ratings and the qualitative comments, Version 1 of the assessment tool was revised, resulting in Version 2. Key revisions included converting essay and illustration-type items (items 34-40) to multiple-choice format, rewording unclear items, adjusting item difficulty, and ensuring better alignment with cognitive levels and curriculum competencies. The revised version was then administered for a pilot test to 120 Grade 7 learners.
Analysis of the pilot test (n = 120) revealed a mean score of 17.19 (out of 30) with a standard deviation of 6.14, indicating moderate test difficulty and variability in student understanding. The average item difficulty index (0.4598) suggested that most items were appropriately challenging, although four items were identified as difficult and potentially requiring revision. The average discrimination index (0.368) fell within the average range, indicating that most items differentiated between high- and low-performing learners, but four items were non-discriminating and required revision. Distractor analysis revealed that 22 items had ineffective or misleading distractors, necessitating careful review and revision. Based on these analyses, 19 discriminating items (47.5%) were retained, and 11 items were revised for clarity and improved distractors.
Table 3. Item Analysis from Pilot Test
| Central Tendency of Scores | Average Difficulty Index | ||
| Range
Mean Standard Deviation |
8-32
17.1916667 6.14 |
Average
Easy item Average items Hard items |
0.4598
1 35 4 |
| Multiple Choice Distractor Analysis | Average Discrimination Index | ||
| Items with Okay Distractors
Items with either Rejected or Defected distracters |
18
22 |
Average
Discriminating items Average Discrimination Not Discriminating |
0.3680
19 17 4 |
Following revisions based on expert feedback and initial item analysis, a pilot test was administered to Grade 7 to evaluate the assessment tool’s validity and reliability. Subsequently, the same respondents were used for the administration of the motivation questionnaire.
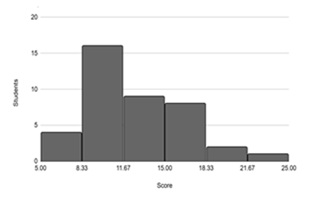
Figure 1. Score Distribution in Frequency of Raw Scores
The score distribution exhibited positive skewness, with most scores concentrated in the lower range. Over 15 learners scored between 8.33 and 11.67, representing the highest frequency. Scores above 18.33 showed a noticeable drop in frequency, and only a few learners scored above 21.67, forming the tail of the distribution. This skewness suggests that most learners demonstrated a limited understanding of force, motion, and energy.
Table 4. Mastery Level of Grade 7 Learners in Physics Learning Competencies
| Competency
|
Item
|
No. of Correct Responses | MPS% | Frequency of Error | Error% | Mastery Level |
| 1. identify that forces act between objects and can be measured. | #1 | 28 | 70 | 12 | 30 | Moving Towards Mastery |
| 2. identify and describe everyday situations that demonstrate:
a. balanced forces such as a box resting on an inclined plane, a man standing still, or an object moving with constant velocity; b. unbalanced forces, such as freely falling fruit or an accelerating car; |
#2 | 25 | 62.5 | 15 | 37.5 | Moving Towards Mastery |
| #3 | 24 | 60 | 16 | 32.5 | Average | |
| #4 | 27 | 67.5 | 13 | 32.5 | Moving Towards Mastery | |
| #8 | 13 | 32.5 | 27 | 67.5 | Low | |
| 3. draw a free-body diagram to represent the relative magnitude and direction of the forces involving balanced and unbalanced forces; | #6
|
18 | 45 | 22 | 55 | Average |
| #7 | 13 | 32.5 | 27 | 67.5 | Low | |
| 4. identify that when forces are not balanced, they can cause changes in the object’s speed or direction of motion; | #5 | 18 | 45 | 22 | 55 | Average |
| 5. explain the difference between distance and displacement in everyday situations in relation to a reference point; | #9 | 17 | 42.5 | 23 | 57.5 | Average |
| #10 | 11 | 27.5 | 29 | 72.5 | Low | |
| #26 | 24 | 60 | 26 | 65 | Average | |
| 6. distinguish between speed and velocity using the concept of vectors;
|
#11 | 14 | 35 | 26 | 65 | Average |
| #12 | 19 | 47.5 | 21 | 52.5 | Average | |
| #13 | 10 | 25 | 30 | 75 | Low | |
| #29 | 18 | 45 | 22 | 55 | Average | |
| 7. describe uniform velocity and represent it using distance-time graphs
|
#14 | 13 | 32.5 | 27 | 67.5 | Low |
| #15 | 10 | 25 | 30 | 75 | Low | |
| #16 | 9 | 22.5 | 31 | 77.5 | Low | |
| #17 | 10 | 25 | 30 | 75 | Low | |
| #18 | 17 | 42.5 | 23 | 57.5 | Average | |
| #27 | 17 | 42.5 | 23 | 57.5 | Average | |
| #30 | 17 | 42.5 | 23 | 57.5 | Average | |
| 8. explain the difference between heat and temperature; | #19 | 20 | 50 | 20 | 75 | Average |
| 9. identify advantageous and disadvantageous examples of conduction, convection, and radiation; | #20 | 27 | 67.5 | 13 | 57.5 | Moving Towards Mastery |
| #21 | 19 | 47.5 | 21 | 52.5 | Average | |
| 10. explain in terms of the particle model the processes underlying convection and conduction of heat energy | #22 | 15 | 37.5 | 25 | 62.5 | Average |
| #23 | 15 | 37.5 | 25 | 62.5 | Average | |
| #24 | 11 | 27.5 | 29 | 72.5 | Low | |
| 11. gather information from secondary sources to identify and describe examples of innovative devices that can be used to transform heat energy into electrical energy | #25 | 13 | 32.5 | 27 | 67.5 | Low |
| #28
|
19 | 47.5 | 21 | 52.5 | Average |
Analysis of the 30-item needs assessment administered to forty 7th graders revealed significant learning gaps. This framework categorizes performance from “Mastered” (96-100%) to “Absolutely No Mastery” (0-4%). None of the items were classified as “Mastered,” and only two (6.7%) reached the “Nearly Mastered” level (75-79%). A substantial portion of items (36.7%) were categorized as “Moving Towards Mastery” (50-74%), while the majority (56.7%) fell into the “Not Mastered” category. Learners struggle most with items requiring higher-order thinking, such as distinguishing speed and velocity, analyzing distance-time graphs, and explaining heat transfer processes. Items involving the identification of balanced and unbalanced forces showed relatively better performance (up to 67.5% “Moving Towards Mastery”), whereas application-based items (e.g., drawing free-body diagrams, interpreting complex scenarios) had the lowest mastery levels (as low as 25%). To pinpoint the most challenging topics, the average frequency of errors was calculated for each of the four content areas.
Table 5. Mastery Level of Seventh Graders in Grade 7 Physics Topics
| Content | ||||
| Balanced and unbalanced forces | Motion: displacement and velocity | Distance-Time graphs, Identifying and controlling variables | Heat transfer | |
| Total frequency of error | 154 | 177 | 187 | 181 |
| Average | 81 | 92 | 97 | 94.5 |
| Rank | 4 | 3 | 1 | 2 |
Analysis of content -specific performance (Table 5) revealed significant variations in mastery among Grade 7 learners based on the MATATAG Curriculum. Distance-Time Graphs emerged as the most challenging topic (187 total errors, average 97), followed by Heat Transfer (181 total errors, average 94.5). Motion: Displacement and Velocity ranked third (177 total errors, average 92), while Balanced and Unbalanced Forces was the least challenging (154 total errors, average 81). These findings align with existing research: difficulties with graphical representations like distance-time graphs [14] and persistent misconceptions surrounding heat transfer [15] are well-documented. The overall high frequency of errors across topics, particularly in the “Low Mastery” category, underscores the need for targeted interventions, including remedial instruction, differentiated learning, and innovative tools, to address these foundational learning gaps and enhance student engagement with core physics concepts related to motion, forces, and energy.
Sample of Learners’ Responses to Motivation in Physics Learning

Figure 2. Responses on Intrinsic Motivation with Statement1

Figure 3. Responses on Intrinsic Motivation with Statement 3
Figure 2 showed that a vast majority (92.5%) perceive physics as either always or often relevant to their daily lives. This implies that almost all learners see value in physics and its connection to real-life applications. Similarly, Figure 3 revealed that learners generally find the subject engaging. However, only 12.5% of learners admitted that they rarely find physics interesting.
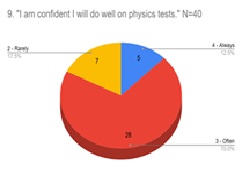
Figure 4. Responses on Self-Efficacy with Statement 9
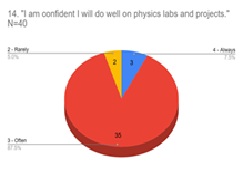
Figure 5. Responses on Self-Efficacy with Statement 14
Figure 4 revealed that most learners feel confident about their test performance, though some need support to increase their confidence. Likewise, Figure 5 sustained that there was a strong confidence among most learners in this area.
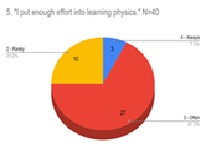
Figure 6. Responses on Self-Determination with Statement 5
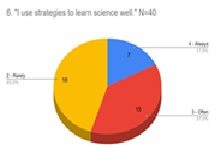
Figure 7. Responses on Self-Determination with Statement 6
Shown in Figure 6 were the responses for the self-determination among Grade 7 learners. This suggested that while most learners make consistent efforts, some feel they could improve their commitment. Moreover, Figure 7 showed that that while some learners use strategies effectively, a significant proportion may need guidance in adopting effective learning techniques.
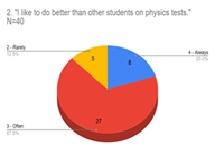
Figure 8. Responses on Grade Motivation with Statement 2
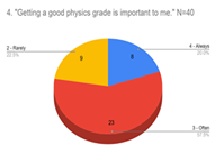
Figure 9. Responses on Grade Motivation with Statement 4
Figure 8 maintained that the majority, 67.5%, perceived that they want to do better in physics tests. Getting good grades for the learners is an issue, hence, the 77.5% value achieving good grades in physics as revealed in Figure 9. This implies that learners prioritize grades, though some may place less emphasis on this.
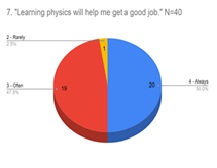
Figure 10. Responses on Career Motivation with Statement 7
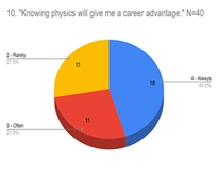
Figure 11. Responses on Career Motivation with Statement 10
As seen in Figure 10, the 50% of learners believed that they can get a good job with a stored physics knowledge. This indicates that most learners view physics as beneficial for their future careers. Having physics knowledge gives an edge in career mapping. This is revealed by the learner in Figure 11. These results suggest that while many learners see physics as an asset, a significant portion (27%) remain uncertain about its relevance to their careers.
Relationship between Conceptual Understanding and Motivation
Spearman’s rank correlation analysis was conducted to examine the relationships between conceptual understanding and five motivational factors: intrinsic motivation, self-efficacy, self-determination, grade motivation, and career motivation.
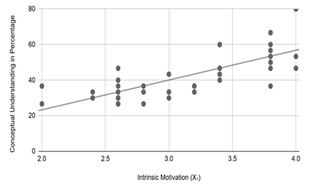
Figure 12. Scatterplot of Conceptual Understanding by Intrinsic Motivation
There appears to be a positive correlation between intrinsic motivation and conceptual understanding. This means that as intrinsic motivation increases, conceptual understanding tends to increase as well. However, the correlation seems to be moderately weak. While there’s a general upward trend, the data points are quite widespread. They don’t cluster tightly around a single line, indicating that intrinsic motivation is likely one factor among many that influences conceptual understanding.
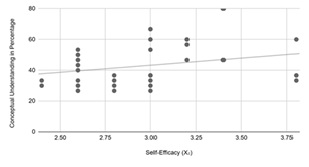
Figure 13. Scatterplot of Conceptual Understanding by Self-efficacy
This scattergram suggests a weak positive relationship between self-efficacy and conceptual understanding. While there’s a slight tendency for higher self-efficacy to be associated with higher conceptual understanding, the relationship is not strong. The spread of the data and the presence of some clustering suggest that other factors may be more influential in determining conceptual understanding. The one higher data point is not an extreme outlier but worth noting.
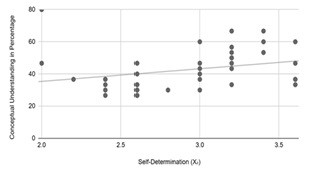
Figure 14. Scatterplot of Conceptual Understanding by Self-determination
This scattergram seems to indicate a moderate positive relationship between self-determination and conceptual understanding. The data is highly scattered, and the trend line is nearly flat, suggesting that self-determination as measured in this study is likely not a significant factor in predicting conceptual understanding. The vertical clustering suggests the presence of other, more influential variables at play.
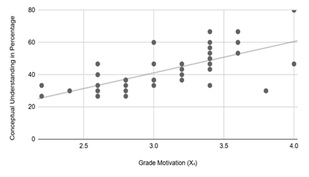
Figure 15. Scatterplot of Conceptual Understanding by Grade Motivation
Based on Figure 15, the scattergram also seems to suggest a moderate positive relationship between grade motivation and conceptual understanding. However, the upward trend is more evident than in the previous scattergrams, indicating that grade motivation is likely a more influential factor in predicting conceptual understanding than self-efficacy or self-determination. However, the spread of the data and the presence of some clustering still indicate that other factors also play a role. The one lower data point at highest grade motivation is worth further investigation.
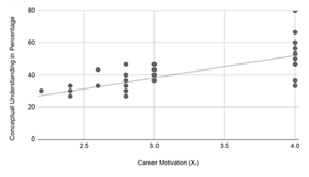
Figure 16. Scatterplot of Conceptual Understanding by Intrinsic Motivation
This scattergram suggests a moderate positive relationship between career motivation and conceptual understanding. The relationship appears to be of similar strength to the relationship observed with grade motivation. While higher career motivation tends to be associated with higher conceptual understanding, the clustering at the high end of career motivation suggests that other factors also contribute to conceptual understanding.
Table 6 Spearman Correlation Results
| Measure | Intrinsic Motivation | Self-Efficacy | Self-Determination | Grade Motivation | Career Motivation |
| Spearman’s Correlation | 0.78433 | 0.29851 | 0.42234 | 0.70253 | 0.744 |
| Covariance | 105.14 | 39.12 | 56.64 | 94.38 | 94.93 |
| P-value (2-tailed) | 0 | 0.06135 | 0.00663 | 0 | 0 |
| X Rank Mean | 20.5 | 20.5 | 20.5 | 20.5 | 20.5 |
| Y Rank Mean | 20.5 | 20.5 | 20.5 | 20.5 | 20.5 |
| X Rank Standard Deviation | 11.53 | 11.27 | 11.53 | 11.55 | 10.97 |
| Y Rank Standard Deviation | 11.63 | 11.63 | 11.63 | 11.63 | 11.63 |
The analysis revealed statistically significant positive relationships between conceptual understanding and intrinsic motivation (ρ = .784, p < .001), self-determination (ρ = .422, p = .007), grade motivation (ρ = .703, p < .001), and career motivation (ρ = .744, p < .001). These findings suggest that higher levels of these motivational factors are associated with higher levels of conceptual understanding in force, motion, and energy. Notably, intrinsic and career motivation exhibited the strongest positive correlations, indicating a substantial link with conceptual understanding. Grade motivation also demonstrated a moderately strong positive correlation. While self-determination showed a statistically significant positive relationship, the correlation was weaker in magnitude compared to the other significant motivational factors. In contrast, the analysis found no statistically significant relationship between self-efficacy and conceptual understanding (ρ = .299, p = .061).
CONCLUSION AND RECOMMENDATIONS
This study investigated Grade 7 learners’ conceptual understanding of force, motion, and energy, their motivation across five dimensions (intrinsic, self-efficacy, self-determination, grade, and career), and the relationships between these constructs. Results revealed significant learning gaps in conceptual understanding, with most learners failing to meet the passing criterion on the assessment. This was further supported by a positively skewed score distribution and item analysis, which highlighted difficulties with higher-order thinking and application-based tasks, particularly concerning distance-time graphs and heat transfer. While the study did not directly measure absolute motivation levels, correlational analysis revealed moderately positive relationships between conceptual understanding and intrinsic, grade, and career motivation, suggesting that these motivational factors are associated with better performance. A statistically significant, but weaker, positive relationship was found with self-determination. However, no significant relationship was found with self-efficacy. These findings suggest that while motivation plays a role, particularly intrinsic, grade, and career motivation, it is not the sole determinant of conceptual understanding. Other factors, such as prior knowledge, learning environment, instructional strategies, and individual learning styles perhaps and likely contribute. Therefore, a multi-faceted approach addressing both motivational and cognitive aspects is crucial for enhancing conceptual understanding in this domain. Future research should explore these additional factors and investigate the effectiveness of targeted interventions.
ACKNOWLEDGMENTS
The author is sincerely thankful to everyone who took part in this study, especially the principal, teachers, and learners of sample school, who generously spent their time and allowed the research to be conducted within their institution. Additionally, the author extends their gratitude to the Department of Science and Technology (DOST) for the support provided through the DOST-CBPSME Scholarship Program.
REFERENCES
- Nava, Fe Josefa & Camarao, Michael. (2017). HIGH SCHOOL LEARNERS’ DIFFICULTIES IN PHYSICS. Retrieved from: https://www.researchgate.net/publication/320980117 HIGH SCHOOL LEARNERS’ DIFFICULTIES IN PHYSICS
- Wangchuk, Damcho & Wangdi, Dumcho & Tshomo, Sonam & Zangmo, Jampel. (2023). Exploring Learners’ Perceived Difficulties of Learning Physics. Educational Innovation and Practice. 6. 10.17102/eip.6.2023.03.
- National Research Council (2013). Next Generation Science Standards: For States, By States. Washington, DC: The National Academies Press.
- Gülen, Salih. (2019). The effect of STEM education roles on the solution of daily life problems. Participatory Educational Research. 6. 37-50. 10.17275/per.19.11.6.2.
- Department of Education (2024). MATATAG Curriculum overview. Retrieved from: https://www.deped.gov.ph
- Orleans, A. V. (2020). Addressing challenges in Philippine science education through innovative teaching strategies. International Journal of Science Education, 42(5), 573–592. DOI: 10.48028/iiprds/ijirsssmt.v9.i1.10
- Anderson, L. W., & Krathwohl, D. R. (2001). A taxonomy for learning, teaching, and assessing: A revision of Bloom’s Taxonomy of educational objectives. Allyn & Bacon.
- Quiao, Maria Alma, Matutes, Kevin Client, Won, Maria Elma, & Edna, Nabua. (2024). Development and Validation of an Assessment Tool for Senior High School Physical Chemistry. 1. 225-195.
- Brothen, Thomas. (2012). Time Limits on Tests: Updating the 1-Minute Rule. Teaching of Psychology. 39. 288-292. 10.1177/0098628312456630.
- Richter, Robin & Tipold, Andrea & Schaper, Elisabeth. (2024). Identification of parameters for electronic distance examinations. Frontiers in Veterinary Science. 11. 10.3389/fvets.2024.1385681.
- Glynn, Shawn & Armstrong, Norris & Taasoobshirazi, Gita. (2011). Science Motivation Questionnaire II: Validation With Science Majors and Nonscience Majors. Journal of Research in Science Teaching. 48. 1159 – 1176. 10.1002/tea.20442.
- Department of Education Memorandum No. 160 s. 2012. Maximizing Utilization Of The National Achievement Test (Nat) Results To Raise The Achievement Levels In Low Performing Schools. Retrieved from: https://www.deped.gov.ph/wp-content/uploads/2012/09/DM_s2012_160.pdf
- National Research Council (2013). Next Generation Science Standards: For States, By States. Washington, DC: The National Academies Press.
- Mathai, Sindhu & Krishnan, Parvathi & Sreevalsan-Nair, Jaya. (2024). Understanding Graphical Literacy Using School Learners’ Comprehension Strategies. Contemporary Education Dialogue. 10.1177/09731849241242855.
- Fitzallen, N. et al. (2016) Year 3 learners’ conceptions of heat transfer., Australian Association for Research in Education. Available at: https://eric.ed.gov/?id=ED591867 (Accessed: 21 December 2024).