
Operational Services of Automated Teller Machines (ATMs) and Market Performance of Money Deposit Banks in River State
- Abuh Astor Idris
- Chiekezie Obianuju Mary Ph. D
- Madu Ikemefuna Ph. D
- 1667-1679
- Nov 15, 2023
- Banking
Operational Services of Automated Teller Machines (ATMs) and Market Performance of Money Deposit Banks in River State
Abuh Astor Idris1*, Chiekezie Obianuju Mary Ph. D2 & Madu Ikemefuna Ph. D3
1Department of Business Administration, McPherson University, Sariki Sotayo, Ogun State
2Department of Business Administration, Nnamdi Azikiwe University, Awka
3Department of Business Administration, Federal University Gashua, Yobe State
*Corresponding Author
DOI: https://dx.doi.org/10.47772/IJRISS.2023.701128
Received: 17 October 2023; Accepted: 03 November 2023; Published: 15 November 2023
ABSTRACT
Technologies affect the trend of an economy and its competence for sustainable development. Generally, this study examines the effect of service rate on market development in the money deposit banks in River State. Specifically, the study investigates how service charge affects the profitability of money deposit banks in River State. Data were collected from selected ATM users at high density urban centres of Obio/Akpor, Khana, Ogba-Egbema-Ndoni, Abua-Oduai, Etche, Degema, Okirika, Gokana, Khana and Ahoadain River State. The data generated relates to the Operational Services of Automated Teller Machines (ATMs) on Market Performance of Money Deposit Banks in River State, Nigerian through observation and administered questionnaires which were analyzed using SPSS (Statistical Package for Social Sciences) version 25.0. Descriptive and inferential statistics have been used to discuss the findings of the study which explains that service rate will increase market development of banks in River State and the result presented shows that service rate had a positive relationship with market development which its relationship was statistically significant at p = .000 [R = .277, p <.05]. This indicates that service rate and market development move in the same direction, that as service rate increases, market development also increases. The model R2 (coefficient of determination) was 0.071 indicates that service rate explained 7.2% of the variance observed in market development.
Key Words: Market development, Service rate and Sustainable development.
INTRODUCTION
Globalization entails that many organizations find themselves operating in a highly competitive international market and the use of highly advanced strategy and technologies have challenged the very basic principles and ideologies of business management and marketing Management (Brassington & Pettitt, 2006). In Nigeria, the contemporary payment systems began with paper-based (bank notes, payment orders and cheques), but it later changed to include card-based e-payment products in 1996, when the Central Bank of Nigeria (CBN) accepted All states Trust Bank approval to introduce a closed system electronic purse (Garuba & Otomewo, 2020). Pahwa & Saxena (2021), submitted that the development in financial sector started with cash, changed to paper and lately improved to plastic card economy. The banking sub-sector is a significant sub-sector upon which the future and development of any given economy of a nation depends on in which the Nigerian economy is no exception. The CBN and the Bankers’ Committee in 2003 launched the foremost scheme to renew the payment system, conceding approval to a number of banks to initiate global money transfer products, telephone banking and online banking by means of the internet on a restricted scale. The banking industry payments system in Nigeria has further transformed with the commencement of the payments system vision 2020 to enhance a larger variety of electronic payment methods like Point-of-Sale (PoS) terminals, enhanced by a larger collection of service providers (Nigeria Inter-Bank Settlement System Plc. PoS Survey, 2018).Chinedu, Chima & Emeka (2022), however, observed that in spite of the deployment of more than 900 ATMs by Nigerian banks, there are still a significant number of ATM users who are hesitant to utilize the ATM service. Furthermore, they asserted that, even in Port Harcourt environs that has the larger chunk of the earliest bank customers, less than 10% of customers of the population utilized the machines. Findings by Ovia (2016) & Nwaze (2018) indicated that even with the increase in the Nigerian ATMs usage, it is still insignificant when compared to other countries and budding economies of the world. Mobarek (2021), stated that the distribution of banking services can be regarded as the avenue or channel by which the bank services are given to customers. Zhu, Scheuermann & Babineauz (2017), postulated that distribution channels used by banks can be categorised into two: in the first group are channels involving personal contact with the customer called territorial units, and in the second group are those channels which either interact directly with the customer, by non-personal means, or operate through various intermediaries to conventional distribution methods (network of territorial units).
However, despite its immense advantages, so many factors still stand as its disadvantages with major linking to highest level of crime and fraud in the system which has being giving much consign to our I.T consultants on the next line of action. Many local marketers have always cried out laud to the danger caused by ATM cards via internet fraud stars which are common in our society today mostly with the invention of Point of Sale (POS) all around places so also the higher level of crime going around in the society.
Objectively, the study generally examines the effect of service rate on market development in the money deposit banks in River State. While it specifically investigates how service charge affects the profitability of money deposit banks in River State.
REVIEW OF RELATED LITERATURE
Automated Teller Machines (ATMs)
Global rivalry in the financial sector has informed management team to be aware of the need to reflect another way of ensuring effective financial transactions and administration. It was in light of this that all deposit money banks (foreign, local, private and public) in Bangladesh launched modern technologies in which ATM is one of them to offer best services to their customers (Islam, 2018). Similarly, the financial industry in Nigeria has been undergoing important transformations and growth in information and communication technology; which include the introduction of Automated Teller Machine (ATM) with the aim of decongesting banking halls (Adeniran & Junaidu, 2022). The introduction of ATM operations is one of the developments in technology, which has taken over part of the functions being done in the banking halls ranging from withdrawals to savings. However, in spite of this development, customers still experience a lengthy waiting time on the queue in both banking halls and ATM terminals to execute these operations, a situation which defeats the purpose of dipping traffic from the banking halls. To meet better market necessities in terms of speed and efficiency of services, banks have adopted an interactive electronic and automated system for customers: banking services through network of Automated Teller Machines (ATMs). A breakdown of e-payment methods showed that ATM remained the most utilized; resulting in88.1% while the web (internet) was the least patronized, accounting for 1.1% of the total. In terms of worth, ATM accounted for 84.5% while web (internet) had 1.2% (Central Bank of Nigeria Economic Report, 2013).
Service Charge
Service rate is the competence to stabilize request from consumers and the capability of the service delivery system to satisfy the request. This situates an emphasis on understanding the foremost nature of demand by predicting (Lovelock, 2020), and also the choices for running competence to meet the projected demand. Sasser (2017), recommended two fundamental strategies for running capacity in services of “level” and “chase”, the former appropriate where capacity is narrowed and so the focal point is on controlling demand to be in line with capacity, and the latter strategy being feasible when supply can be altered to suit demand. Thus, operations managers have to recognize the composition, the degree to which it can be altered, and the speed of reaction of their capacity (Slack, 2018), and the costs entailed (Heskett, Sasser & Hart, 2021). Similarly, service rate functions involves assessing activity for operations managers for the reason of service delivery and the concern of the customers in the practice, who confines the regular options available for managing the procedure to equal supply with demand; specifically, changing the service rate, holding and stock in advance of demand and necessitating customers to remain for the service (Armistead & Clark 2017). The objective of service rate is to guarantee that infrastructure offers the cost-justifiable resources required in achieving current and prospect business service conditions, though guaranteeing that Information Technology resources are stipulated, managed, utilized and attained in a cost-effective way (Kalm & Waschke, 2023). Conclusively, service rate can be defined as the maximum amount or number that can be received or contained by a system or an operation.
Marketing development
Marketing which encompasses a series of activities involved in moving the goods from the point of production to the point of consumption. It includes all activities involved in the creation of time, place, form and possession utility. Philip Kotler has defined marketing as a human activity directed at satisfying the needs and wants through exchange process. American Marketing Association defined marketing as the performance of business activities that directs the flow of goods and services from producers to users. Marketing identifies customer needs and market conditions and also manager market researches, product strategies, marketing campaigns, advertising, channels, and lead generation. Sales activities include prospecting, qualification of leads, problem identification, product demonstration, proposal development and presentation, negotiation, and contracting (Chan, 2007). Customer service has come out of a support function to become a strategically important differentiator for businesses as it can be an effective means for cross-selling and up-selling when additional needs for the customers are identified. Predictive analytics can help anticipate customer situations and provide timely and useful solutions (Chan, 2007). Marketing failures have been caused by the ignorance and underestimation of consumer motivation, perception, and behavior in the market place which makes marketers believed that consumers accept or buy anything they are offered in the market. This notion is absolutely a wrong one as a consumer has a personality whose behavior is governed by different and varied influences such as his social beliefs, attitudes, past learning, experience, perception, and expectations which forms his taste, choice, and product preference (Onwuka, et al., 2012).
Profitability
The word Profitability is the combination of two words ‘Profit’ and ‘Ability’. Profit which stands for the primary objective of any Business that measures not only the success of a product, but also consider the market development (Nimalathasan, 2009) it meaning differs but in most cases, it is according to its uses or purposes in accordance to the enterprises while ability is the given investment to earn a return from its uses. Evolutionary models suppose that profitability is the foremost factor of firm growth (Alchian, 2015; Nelson, 2014). Other researchers found that profitability has a positive impact on the growth rate, but growth rates have a negative effect on the existing year’s profitability (SooCheong & Kwangmin, 2021). Occasionally, profitability is even considered to be in an undesirable relationship with a firm’s growth, since profitability is concentrated on short-term results and postpones investments which belong to the sources of long-term growth (Milano, 2020). Hernaus, Bach & Vuksic (2012), asserted that profitability is measured using the following variables: return on assets, return on equity, return on investment, net profit margin, earnings per share and value per employee. Gruian (2011), mentioned that the result of every operational performance is profitability; which simply means that the existence of operational performance is as a result to profitability. Profitability of any business is to indicate the financial ability which is tends to enhance income earning capacity by this measures, profitability is the relative measure of earning capacity. Profitability ratio is also measures by firm’s ability to generate profits and central investment to security analysis, shareholders and investors. The primary measure of the overall success of any enterprise is called Profitability. The analysis of profitability ratio is important for the shareholders, creditors, prospective investors, bankers and government alike. Velnampy & Nimalthasan (2007), pointed out that sales are positively associated with profitability ratio except return on investment and numbers of depositors are negatively correlated with the profitability ratios except return on equity, likewise number of advances to the return on investment and return on average assets. Sexton & Kasarda (2000), found that firm profitability was correlated with sustainable growth. Chandler & Jensen (1992), found that sales growth and profitability were not correlated. Today, profitability analysis has captured all other aspects which are highlighted in interpretation of financial statements, in developed and developing countries. Financial analysis is more external than internal; profitability analysis is internal as well as external. Profitability analysis helps in critically analyzing and interpreting the current and prospective earning capacities of business corporations. It becomes more important when it stand as the major yardstick within the business earning goal that helps to guide the behaviour of managers and other employees.
THEORETICAL FRAMEWORK
Technology Led Theory
The term technology led theory (TLT) was believed to have coined by Thorstein Veblen (1857–1929), who is an American social scientist. This model states that technology exerts an independent, un-directional and casual influence over humans and organizations’ similar in nature to the laws of physical sciences (Orlikowski, 1992). Some technology led theories argue that society itself is entirely determined by technology: ‘new technologies transform society at every level, including institutions, social interaction and individuals. The premise is that the technology as well as organizational and individual variables can be measured and predicted (Leavitt & Whistler, 1985; Pfeffer & Leblebici, 1977 and Siegel et al, 1986). Technological determinism stands in opposition to the theory of the social construction of technology, which suggests that both the path of innovation and the consequences of technology for humans are strongly if not entirely shaped by society itself, through the influence of culture, politics, economic arrangements, and the like. Although current literature of product design and development refers to some technologies as modules within an architecture (Ulrich, 1995, Gershenson et al., 2003), our approach suggests the concept of technological parasitism to stress the relation of dependence of some sub-systems, called parasitic technologies, within complex systems of host (or master) technology (Rosenberg, 1982). The concept of technological parasitism, based on technologies that depend on and interact within complex systems of host-master technologies, can explain general characteristics of the evolution of technology (Coccia, 2019, 2019a, 2019b).
Marketing Capabilities Theory
The marketing capabilities theory was first put postulated by Teece, Pisano & Shuen in 1997. This theory equally assumes that capabilities develop when individuals and groups repeatedly apply their knowledge and skills to combine and convert inputs in ways that contribute to attaining the firm’s objectives (Collis, 2015; Mahoney & Pandian, 2022). Consequently, as with other types of capabilities, marketing capabilities occur at diverse levels within the firm ranging from individual to the corporate level (Grant, 2016; Morgan & Slotegraaf, 2021). The criticism of this theory is that as the concept of marketing capabilities is comparatively new to the marketing discipline, the constituent specialized, architectural, cross-functional, and dynamic marketing capabilities have yet to be broadly identified and cataloged. An organisation or firm who repeatedly applies their knowledge and skills of system factors and transforms it in ways that contributes to the achieving the firm’s goals will have a competitive edge over its competitors, higher profits and become a market leader in its sector.
Table 1: Empirical Review
| S/N | Researcher(s) | Year | Topics | Location | Methodology | Major Findings |
| 1. | Machek & Machek | 2022 | “Factors of business growth: A decomposition of sales growth into multiple factors”. | Czech Republic | Model and Case Study Analysis. | Findings reviewed that model is straight forward and suitable for management of small and medium sized companies and can be used in the education of entrepreneurs. |
| 2. | Ogunsakin & Bola | 2022 | Comparative break down of service delivery by ATM in two banks in Lagos State with the application of queuing theory. | Lagos Nigeria | Empirical Analysis | The findings reviewed that the study concluded that the average amount of idle time obtained for the two banks were 3 minutes and 7 minutes respectively. |
| 3. | Bakari, Chamalwa & Baba | 2020 | Queuing process and its application to customer service delivery (a case study of Fidelity Bank plc, Maiduguri)”. | Maiduguri, Nigeria | Observation method of primary source. | The study reveals that the traffic intensity (ℓ) is 0.96 and concludes that the system operates under steady-state condition. |
| 4. | Adiele & Opara | 2019 | Physical architecture and customer patronage of banks in Nigeria: An empirical study” | South-South zone of Nigeria. | Descriptive Statistics | Findings showed that there is a positive and significant correlation between physical architecture and customer patronage. |
| 5. | Kariuki | 2011 | Analysis of Market Performance: A case of ‘Omena’ Fish in selected outlets in Kenya” aims to assess the performance of Omena marketing in Kenya. | Kenya | A multi-stage sampling procedure. | Result indicates that longer marketing channels resulted not only to high costs and thus high retail prices; but also to lower returns to fishermen. |
Model of the Study
Three proxies were adapted to Conceptualized the Service Charge: these are Automated Teller Machines (ATMs), Marketing Development and Profitability which decomposes the independent variable (Operational Services) and proxy by (Market Performance) as the dependent variable.
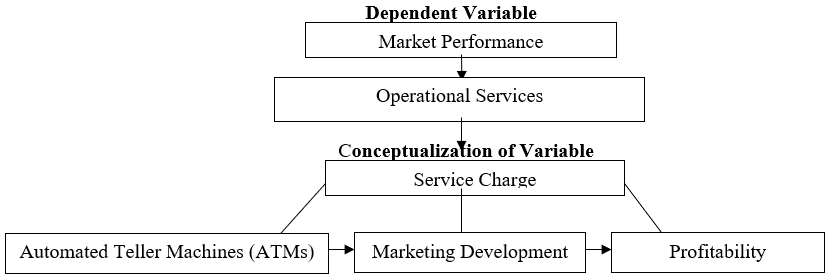
Source: Researchers Conceptualization
ANALYTICAL METHODOLOGY AND RELATED STATISTICS
Descriptive and inferential statistics have been used to discuss the findings of the study. Data were collected from selected ATM users at high density urban centres of Obio/Akpor, Khana, Ogba-Egbema-Ndoni, Abua-Oduai, Etche, Degema, Okirika, Gokana, Khana and Ahoada in River State.
Table 2: Study Variables
| S/N | Variables | Sources of adapted questionnaire |
| 1. | Service Charge (SC) | Amistead & Clark (1991); Vicent (2008). |
| 2. | Automated Teller Machines (ATMs) | Frei, Harker & Hunter (1998); Little, A.D. (2012); Njuki, Okoth & Mwangombe (2013); Godin (2008). |
| 3. | Profitability (PT) | Ali et al (2017), Das (2017); Singh et al (2013). |
| 4. | Market development (MD) | Little, A.D. (2012); Gupta, Guha & Krishnaswami (2013); Machek & Machek (2014); Zhou & Geritt de Wit (2009). |
| 5. | Market Performance (MP) | Malan & Dimitriu (2012); Mirrow (2005); Paoni & Elrod (2013). |
| 6. | Operational Service (OS) | Subramaniam, Husin, Yusop & Hamidon (2009) |
Source: Researcher’s compilation, 2023
Questionnaires Administered
The number of questionnaires administered to all the respondents was 385. After coding and checking for accuracy in the data, 381 questionnaires were found useful for the study. This gave a response rate of 98.7% and 4 questionnaires were not received which represented 1.3% of the total questionnaires distributed.
Table 3: Rate of Response by the Respondents
| Response | Respondents | Percentage (%) |
| Returned | 381 | 98.7 |
| Not-Returned | 4 | 1.3 |
| Total Distributed | 385 | 100 |
Source: Field Survey, 2023
Descriptive Analysis of Demographic Information of the Respondents
The demographic data comprising gender, age of the respondents, employment status, income level and highest educational qualification of the respondents were analysed and the findings show the aggregate demographic and respondent characteristics of the population studied. Frequencies and percentages were then used to evaluate each attribute.
Table 4: Presents the demographic and characteristics of the respondents
| Variables | Characteristics | Frequency | Percentage, % |
| Gender | Male | 212 | 55.6% |
| Female | 169 | 44.4% | |
| Total | 381 | 100% | |
| Age | 18-25 Years | 102 | 26.18% |
| 26-35 Years | 111 | 29.13% | |
| 36-45 Years | 93 | 24.21% | |
| 46-55 Years | 37 | 9.71% | |
| 56-70 Years | 38 | 9.97% | |
| Total | 381 | 100% | |
| Employment Status | Employed | 136 | 35.69% |
| Unemployed | 51 | 13.38% | |
| Student | 144 | 37.79% | |
| Retired | 9 | 2.36% | |
| Businessman | 41 | 10.78% | |
| Total | 381 | 100% | |
| Do you earn income? | Yes | 217 | 56.95% |
| No | 164 | 43.04% | |
| Total | 381 | 100% | |
| Income Level | Low Income | 110 | 28.87% |
| Medium Income | 141 | 37.01% | |
| High Income | 130 | 34.12% | |
| Total | 381 | 100 | |
| Educational Qualification | Primary | 13 | 3.4% |
| Secondary | 124 | 32.54% | |
| OND/HNDBSC/DIP | 113 | 29.68% | |
| MSc/MBA/PGD | 109 | 28.64% | |
| PHD | 22 | 5.78% | |
| Total | 381 | 100 |
Source: Field Survey, 2023
Demographic and personal profile of respondents shows that Gender distribution revealed 212respondent representing 55.6% are male, while 169 respondents representing 44.4% are female; indicating that more of the respondents are male respondents.
Age showed that 102 (26.18%) are between 18- 25 years of age, 111 (29.13%) respondents are between 26-35 years, 93 (24.21%) respondents are between 36-45years, 77(9.71%) respondents were 46-55 years, and lastly 38(9.9%) were 56-70 years. Findings also shows that distribution of respondents based on their Employment Status, 136(35.69%) respondents are employed staffs, 51 (13.38%) respondents are unemployed, 144(37.79%) respondents are students, and lastly 41(10.78%) respondents are Self-employed. The above table also shows the distribution of respondents based on whether they earn income or not, 217(56.95%) respondents disclosed that they are income earners. The Table above also shows the distribution of responses from respondents based on their income level, 164(43.04%) respondents are of Low income earners, 110 (28.8%) respondents are Average/medium income earners, and finally 130(34.12%) respondents are High income earners. The Table above also shows the distribution of respondents based on their educational qualification, 13(3.4%) respondents had just primary education, 124(32.54%) respondents had their qualification at O’ level, 113(29.68%) respondents are OND/HND/B.Sc./DIP holders, 109(28.64%) respondents are M.Sc./MBA/PGD holders, and lastly, 22(5.78%) respondents are M.Sc./Ph.D holders.
DATA ANALYSIS AND RESULTS
The data generated relates to the Operational Services of Automated Teller Machines (ATMs) on Market Performance of Money Deposit Banks in River State, Nigerian through observation and administered questionnaires which were analyzed using SPSS (Statistical Package for Social Sciences) version 25.0
Data Analysis for the study objective
The data generated through the administered questionnaires were analysed using Statistical Package for Social Sciences (SPSS) version 25.0. The descriptive analyses of respondent’s responses on demographic data as well as for each item as regards the formation of the data generated on queuing analysis of system factors and market performance of ATM operations in selected deposit money banks in River State, Nigeria were obtained.
Hypothesis
There is a significant effect of service charge on the profitability of money deposit banks in River State.
Table 5: Descriptive Analysis on Service rate
| Strongly Agree | Agree | Partially Agree | Partially Disagree | Disagree | Strongly Disagree | Total | |
| There is no time wasting when using ATMs. | 53 | 206 | 108 | 1 | 2 | 11 | 381 |
| 13.9% | 54.1% | 28.3% | 0.3% | 0.5% | 2.9% | 100.0% | |
| ATMs hardly run out of cash. | 43 | 214 | 113 | 2 | 4 | 5 | 381 |
| 11.3% | 56.2% | 29.7% | 0.5% | 1.0% | 1.3% | 100.0% | |
| ATMs always have network service. | 37 | 198 | 123 | 7 | 14 | 2 | 381 |
| 9.7% | 56.2% | 29.7% | 0.5% | 1.0% | 0.5% | 100.0% | |
| ATMs terminals are spatial enough to accommodate number of customers. | 78 | 177 | 115 | 6 | 3 | 2 | 381 |
| 20.4% | 46.5% | 30.2% | 1.6% | 0.8% | 0.5% | 100.0% | |
| There are reasonable cash points available in a particular location. | 36 | 203 | 128 | 11 | 1 | 2 | 381 |
| 9.4% | 53.3% | 33.6% | 2.9% | 0.3% | 0.5% | 100.0% |
Source: Researcher’s Field Survey Result, 2023
The descriptive analysis of respondents’ responses as regards service rate. By combining responses under strongly agree, agree and partially agree, 358(94%) of the respondents agreed that there is no time wasting when using ATMs., 370(97.1%) of the respondents accepted that ATMs hardly run out of cash, 358(94%) agreed that ATMs always have network service. 370(97.1%) accepted that ATMs terminals are spatial enough to accommodate number of customers. And lastly, 367(96.3%) agreed that there are reasonable cash points available in a particular location.
Descriptive Analysis on Market development
| Strongly Agree | Agree | Partially Agree | Partially Disagree | Disagree | Strongly Disagree | Total | |
| My bank has a process to identify hidden or needs of customers. | 22 | 237 | 114 | 3 | 3 | 2 | 381 |
| 5.7% | 62.2% | 30% | 0.8% | 0.8% | 0.5% | 100.0% | |
| My bank has a process to identify potential customers. | 55 | 217 | 106 | 2 | 0 | 1 | 381 |
| 14.3% | 57% | 28% | 0.5% | 0% | 0.2% | 100.0% | |
| My bank uses technology in a new way to increase sales. | 38 | 216 | 111 | 11 | 3 | 2 | 381 |
| 10% | 57% | 29% | 2.8% | 0.7% | 0.5% | 100.0% | |
| My bank has process to quickly translate the identified opportunities into growth. | 41 | 238 | 76 | 11 | 12 | 3 | 381 |
| 10.8% | 62.5% | 20% | 2.8% | 3.1% | 0.8% | 100.0% | |
| Generally, my bank customers’ base has been on the increase. | 53 | 119 | 127 | 1 | 0 | 1 | 381 |
| 13.9% | 52.23% | 33.3% | 0.3% | 0% | 0.3% | 100.0% |
Source: Researcher’s Field Survey Result, 2023
The descriptive analysis of respondents’ responses for Market development. Combining the responses under strongly agree, agree and partially agree, 381(99.6%) of the respondents agreed that their bank has a process to identify hidden or unmet needs of customers. 381(99.6%) of the respondents accepted that their bank has a process to identify potential customers, 381(93.7%) agreed that their bank uses technology in a new way to increase sales. 381(91.6%) respondents accepted that their bank has process to quickly translate the identified opportunities into growth. And lastly, 381(91.6%) agreed that their bank customers’ base has been on the increase.
Test of Hypothesis
In order to test the hypothesis, standard simple regression analysis was used. Data on service rate and market development of banks were obtained by adding the items under each of the variable. The results of the test of hypothesis is presented in table below.
Table 6a: The Goodness-of-fit (Model Summary) of Service rate and Market development in Selected deposit money banks in Rivers State.
| Model Summary | ||||
| Model | R | R Square | Adjusted R Square | Std. Error of the Estimate |
| 1 | .277a | .072 | .071 | 2.73127 |
| a. Predictors: (Constant), Service rate | ||||
Source: Researcher’s Field Survey Results, 2023
The table shows the model summary of both dependent variable (Service rate) and independent variable (Market development). The model summary established the effect of service rate on market development of selected deposit money banks in Rivers State.
Table 6b: The Overall Significance
| ANOVAa | ||||||
| Model | Sum of Squares | Df | Mean Square | F | Sig. | |
| 1 | Regression | 400.721 | 1 | 400.721 | 59.090 | .000b |
| Residual | 5221.720 | 770 | 6.781 | |||
| Total | 5622.440 | 771 | ||||
| a. Dependent Variable: Market development | ||||||
| b. Predictors: (Constant), Service rate | ||||||
Source: Researcher’s Field Survey Report, 2023
Table 6c: Regression Coefficients
| Coefficientsa | ||||||||
| Model | Unstandardized Coefficients | Standardized Coefficients | T | Sig. | 95.0% Confidence Interval for B | |||
| B | Std. Error | Beta | Lower Bound | Upper Bound | ||||
| 1 | (Constant) | 15.179 | 1.057 | 14.343 | .000 | 13.101 | 17.256 | |
| Service rate | .237 | .030 | .277 | 7.686 | .000 | .176 | .297 | |
| a. Dependent Variable: Market development | ||||||||
Source: Researcher’s Field Survey Report, 2023
The result presented in the above table shows that service rate has a positive effect on market development and this relationship was statistically significant at p= .000 [R = .277, p <.05]. This indicates that service rate and market development move in the same direction, that as service rate increases, market development also increases. The model R2 (coefficient of determination) was 0.072 indicates that service rate explained 7.2% of the variance observed in market development. In Table 6(b), the F statistic = 59.090 was significant at p<0.05 which revealed that the model was significant in explaining the effect of service rate on market development of banks in River State. This finding is supported by a positive and significant unstandardized B coefficient in Table 6(c) that service rate is [B = 0.237, t = 7.686, p<0.05]. Therefore, the null hypothesis (H0) which states that service rate has no significant effect on market development of banks in River State is hereby rejected. The regression model used to explain the variation in market development due to the effect of service rate of banks in River State can be stated as follows:
MD = 15.180 + .237SR + ɛ ……………………………………………………. (equi. 1)
Where;
MD = Market development
SR = Service rate
ɛ = Error term
DISCUSSION OF FINDINGS
The regression equation indicates that the parameter estimates complied with a priori expectation which explains that service rate will increase market development of banks in River State. The constant is 15.180 implies that if service rate is zero, market development would be 0.237. The coefficient of service rate is 0.237 which indicates that a 1-unit increase in service rate is associated with 0.237 units increase in market development of banks. This implies that an increase in service rate will subsequently increase market share of banks in River State. The result of the hypothesis demonstrates that service rate of banks has a significant effect on market share of the banks in River State.
CONCLUSION
Service rate has no significant effect on market development. The result presented in the table shows that service rate had a positive relationship with market development and this relationship was statistically significant at p= .000 [R = .267, p <.05]. This indicates that service rate and market development move in the same direction, that as service rate increases, market development also increases. The model R2 (coefficient of determination) was 0.071 indicates that service rate explained 7.2% of the variance observed in market development.
RECOMMENDATIONS
- Due to the recent upsurge in the customer base of most banks, it is imperative for banks to increase their service rate of ATMs, both in terms of number as well as speed to enhance effective market development in Nigeria.
- For banks to be relevant in this volatile and dynamic environment in Nigeria, they need to innovate and be in tune with latest software in the ATM cycle to champion the national growth.
- Customers are becoming ever more demanding of total quality management in terms of service delivery from their chosen banks, it is therefore imperative for banks to provide effective steady behaviour rate to have a competitive benefit both in their sector and other sectors.
REFERENCES
- Abor, J. (2020). Technological innovations and banking in Ghana: An evaluation of Customers’ perceptions. Legion: University of Ghana. Available at: http://www.financialcertified.com/Technological%20Innovations%20and%20Banking%20Ghana%20-%20AAFM.doc.Accessed: 27 April 2020.
- Adeniran, L. M. & Junaidu, A.S. (2022). An empirical study of automated teller machine (ATM) and user patronage in Nigeria: A study of United Bank for Africa in Sokoto Metroplois. International Journal of Management Technology, 2(3), 1-11.
- Adiele, K. C. & Opara, B. C. (2017). Analysis of corporate identity on customer patronage of banks in Nigeria. International Review of Management and Business Research, 3(4), 1809-1818.
- Alchian, E.O. (2015). Green marketing and consumer buying behaviour of fastmoving consumer goods (FMCG) in Rivers State, Nigeria. Unpublished PhD Thesis. Babcock University Business School.
- Armistead, C. G. & Clark, G.R. (2017). Service delivery. Management Service Quality.
- Asikhia, O. (2019). Strategic flexibility and market performance of SMEs in Nigeria. International Journal of Management and Enterprise Development, 10 (1), 72-91.
- Barahmand, Z., & Eikeland, M. S. (2022). Techno-Economic and Life Cycle Cost Analysis through the Lens of Uncertainty: A Scoping Review. Sustainability, 14(19), 12191. MDPI AG. Retrieved from http://dx.doi.org/10.3390/su141912191.
- Berry, L. L., Zeithaml, V.A. & Parasuraman, A. (2020). Five imperatives for improving service quality. Sloan Management Review.
- Chinedu, N.O., Chima, B.O. & Emeka E.I. (2022). Analysis of the negative effects of the Automated Teller Machine (ATM): As a channel for delivering banking services in Nigeria. International Journal of Business and Management, 7(7), 180-190.
- Collier, D.A. (2019). The customer service and quality challenge. Service Industries Journal, 7(1), 77-90.
- Collis, D.J. (2021). The resource-based view of the firm and the importance of factor markets. Working Paper #95-070. Cambridge: Harvard Business School.
- Dess G. & Robinson, R. (2020). Measuring organisational performance in the absence objectives measures: the case of the privately-field firm and conglomerate business units. Strategic Management Journal, 5, 265-273.
- Garuba, A.O. & Otomewo, G.O.T. (2020). An evaluation of banks’ liability in robbery incidents at banks’ premises in Nigeria. International Journal of Arts and Humanities, 4 (2), 179-188.
- Grant, R.M. (2016). Prospering in dynamically-competitive environments: Organisational capability as knowledge integration. Organisational Science, 7, 375-387.
- Grant, R.M. (2016). The resource-based theory of competitive advantage: Implications for strategy formulation. California Management Review, 33 (spring), 114-135.
- Grant, R.M., Shani, R. & Krishman, R. (2017). TQM’s challenge to management: theory and practice. Sloan Management Review; winter, 25-35.
- Gronroos, C. (2016). A service quality model and its marketing implications. European Journal of Marketing, 18(4), 36-44.
- Heskett, J.L., Sasser, W.E., & Hart, C.W.L. (2021). Service Breakthroughs: New York, Free Press, pp135.
- Kale, P., & Singh, H. (2017). Building firm capabilities through learning: The role of the alliance learning process in alliance capability and firm-level alliance success. Management Journal, 28 (10), 981-1000.
- Kalm, D.P. & Waschke, M. (2023). Capacity management: A CA service management process Map.
- Machek,L., Robert, D., Marcia, F., Blake, W.P. & Ahahinu, S.A. (2019). Models of Emergency Department for Reducing Customers Waiting Time Plos One, 1 (7), 36-43.
- Mahoney, J.T. & Pandian, J.R. (2022). The resource-based view within the conversation of strategic management.Strategic Management Journal, 13(3), 363-380.
- Mobarek, A. (2021). E-banking practice and customer patronage. A case study in Botswana. http://www.papers.ssrn.com/so13/papers.
- Morgan, N.A. & Slotegraaf, R.J. (2021). Marketing capabilities for B2B firms. In G.L. Lillien and R. Grewal (eds.), The B2B marketing handbook. Northampton: Edward Elgar.
- Mwatsika, C. (2018). Customers’ patronage with ATM banking in Malawi. African Journal of Business Management, 8(7), 218-227.
- Nelson, C. (2022). Financial Innovation and its Effect on Financial Performance of Commercial Banks in Kenya. University of Nairobi unpublished MB
- Nelson,C. & Wmtor, D. (2016). Consumer perceptions of cause related marketing campaig Journal of Consumer marketing. 27, 543.
- Nwaze, C. (2018). Electronic banking fraud: Quality and internal control challenges: Zenith Economy Quarterly, 1(7).
- Oboh, T.A. (2021). Development an ICT-enabled service delivery in the Nigerian banking Industry. Union bank experience. Union Digest, 9 (1and2).
- Ogbo, A.I. (2015). Production and Operations Management: Enugu. De-Verge Agencies Ltd Publishers.
- Ovia, J. (2016). IT development as corporate strategy in repositioning bank in Nigeria. Zenith Economy Quaterly, 1(7), 1-69.
- Pahwa, M.S. & Saxena, K. (2021). Analytical study of customer patronage at ICICI Bank with special reference to ATMs. International Conference on Information and Financial Engineering, 12, 160-164.
- Pfeffer, J. & Salancik, G.R. (2018). The external control of organisations: A resource dependency perspective. New York: Harper and Row Publishers.
- Rameshwar, T. (2022). Determining customer patronage on Automated Teller Machine (ATM) in Imphal city. Asian Journal of Research in Banking and Finance, 3(1), 55-76.
- Sasser, W.E. (2017). Match supply and demand in service industries. Harvard Business Review, November-December.
- Slack, N. (2018). Flexibility and the manufacturing function- Ten empirical observations, Proc.Operations Manager Conference, UK.
- Soocheong, J. & Kwangmin, P. (2021). Mergers and acquisitions and firm growth: investigating restaurant firms. International Journal of Hospitality Management, 30 (1),141-149.
- Teece, D.J., Pisano, G. & Shuen, A. (2017). Dynamic capabilities and strategic management. Strategic Management Journal, 18(7), 509-535.
- Yakubu, A.N. & Najim, U. (2018). An application of queuing theory to ATM service optimization: A case study. Mathematical Theory and Modeling, 4 (6), 11-23.
- Zhu, Z., Scheuermann, L. & Babineauz, B. J. (2020). Information network technology in the banking industry. Industrial Management and Data Systems, 104(5), 409-417.