
Prevalence and Factors Associated with Malnutrition and Hypertension among University Students in Southwest Nigeria
- Okunbor H.N.
- Oyelakin T.T.
- Okunbor L.O.
- Akinsolu F.T.
- Opadotun, O.A.
- Edun, S.J.
- Okoh, A.U.
- 2148-2162
- Jul 31, 2024
- Education
Prevalence and Factors Associated with Malnutrition and Hypertension among University Students in Southwest Nigeria
Okunbor H.N.1*, Oyelakin T.T.2, Okunbor L.O.3, Akinsolu F.T.4, Opadotun, O.A.5, Edun, S.J.6, Okoh, A.U.7
1Department Of Medical Microbiology, Babcock University Teaching Hospital, Nigeria
2Department of Epidemiology and Medical Statistics, University of Ibadan
3,5,7Department of Family Medicine, Babcock University Teaching Hospital, Nigeria
4Department of Public Health, Lead City University, Ibadan, Nigeria
6Department of Surgery, Babcock University Teaching Hospital, Nigeria
*Corresponding Author
DOI: https://dx.doi.org/10.47772/IJRISS.2024.803156S
Received: 23 May 2024; Revised: 16 June 2024; Accepted: 17 June 2024; Published: 31 July 2024
ABSTRACT
Background: Malnutrition and hypertension are widespread among university students, with dietary habits and sedentary lifestyles playing significant roles. This study aimed at determining the prevalence and factors linked to malnutrition and hypertension in Southwest Nigeria’s university population.
Methods: Conducted from January 2018 to December 2022, a cross-sectional study was undertaken at Lead City University in South-West Nigeria. Medical records of 5110 enrolled students were analyzed to assess the prevalence and factors associated with malnutrition and hypertension within the university population. Data encompassing demographic information and health metrics were examined for this study.
Results: A study of 5110 participants, mean age (23.57+14.89), female sex (54.1%), blood group O prevalence (53.6%), Rhesus negative (4.9%), and genotype AA prevalence (73.6%). The average weight was 67.17+ 15.18 kg and height of 1.67+ 0.93 meters. Hypertension prevalence was at 8.7%, while malnutrition is 42.7%. Among the participants, 3% were anemic while the mean systolic and diastolic blood pressure were 115.93+15.26 and 73.52+17.43 respectively. Male sex was significant factor in hypertension and malnutrition (p < 0.001). PCV levels lack significant associations, while BMI categories strongly correlate with hypertension (p < 0.001).
Discussion: The demographic profile reveals a youthful population vulnerable to behaviors impacting long-term health. With malnutrition prevalence at 47.2%, significant health concerns arise, while the relatively low hypertension rate of 8.7% is promising but requires ongoing monitoring. Age is a notable risk factor for hypertension, stressing targeted interventions for older adults. Sex disparities highlight the need for sex-specific healthcare. Blood group, Rhesus factor, and genotype lack significant associations with hypertension, while hypertension prevalence varies across packed cell volume levels. BMI strongly links to hypertension, highlighting obesity management’s importance.
Conclusion: Understanding demographic factors and health metrics is crucial for developing effective interventions to address malnutrition and hypertension risks within populations.
Keywords: prevalence, risk factors, malnutrition, hypertension, students
INTRODUCTION
Malnutrition and hypertension are two significant public health challenges affecting populations globally(1), cutting across all age groups and demographics. These health issues are especially prevalent among university students, whose lifestyles and dietary habits often predispose them to such conditions(2). In Sub-Saharan Africa, these concerns are notably pertinent due to evolving socio-economic factors, cultural influences, and lifestyle transitions among young adults. (3) The prevalence of these health conditions in university students is reflective of broader systemic issues that require targeted interventions to address effectively.
Malnutrition: Prevalence, Factors, and Health Outcomes
Malnutrition, encompassing both undernutrition and overnutrition, remains a significant health concern. The prevalence of underweight (9.2%), overweight (21.5%), and obesity (12.0%) in the studied population underscores the need for comprehensive nutritional interventions.
The higher prevalence of obesity compared to similar studies (6% – 7.5%) (5,6) suggests an escalating public health issue. The disparity indicates potential changes in dietary habits, lifestyle, and socio-economic factors over time. Such shifts are often driven by increased availability and consumption of high-calorie, low-nutrient foods. (7,8, 15) Malnutrition leads to a range of adverse health outcomes, including stunted growth, weakened immune function, increased susceptibility to infections, chronic diseases and impaired cognitive development.(21) These findings are consistent with other studies, (22,23) which highlighted the broad spectrum of health issues associated with malnutrition. Economic constraints limit access to nutritious foods, while cultural norms and peer influences shape dietary behaviors. Traditional diets are often replaced by westernized fast-food options, which are more convenient but less healthy (9, 10). This dietary transition emphasizes the role of economic and cultural factors in dietary choices.
Hypertension: Prevalence, Risk Factors, and Implications
Hypertension, a prevalent non-communicable disease, poses significant health risks.(11,16) The relatively low prevalence of hypertension (8.7%) among participants, compared to other studies (21.9% – 35.3%),(13,14,15) is a positive indicator of cardiovascular health. However, it underscores the need for ongoing monitoring and preventive measures.
Sex Disparities: The higher prevalence of hypertension among males raises important considerations for sex-specific healthcare approaches. Studies (24, 25) have shown that males are at increased risk due to biological, lifestyle, and behavioral factors. Some studies (26, 27, 28) highlighted the role of hormonal differences and higher rates of tobacco and alcohol use among men as contributing factors.
Age and Hypertension: The strong association between age and hypertension prevalence underscores aging as a significant risk factor. The high rates (164, 37%) of hypertension among younger age groups highlight the need for targeted screening and intervention strategies. This pattern was observed in some studies (17, 29, 30), which attribute the rise to lifestyle factors such as sedentary behavior and poor dietary habits.
Packed Cell Volume (PCV) and Hypertension: Fluctuations in hypertension prevalence across different PCV levels suggest that hematocrit levels may influence hypertension risk. Higher PCV levels may indicate conditions like dehydration (33), which is associated with increased cardiovascular risk. Similar findings are reported in studies conducted in Nigeria (31,32), emphasizing the importance of monitoring PCV levels in hypertension risk assessment.
Malnutrition and Hypertension: Intersection and Synergy
The robust correlation between body mass index (BMI) categories and hypertension likelihood underscores the critical role of obesity as a major risk factor for hypertension (43,44). Addressing malnutrition, particularly overnutrition, is essential for preventing hypertension and associated health complications.
BMI and Hypertension: Overweight and obese individuals are at significantly higher risk of developing hypertension.(43) A study highlight the importance of weight management and lifestyle modification in hypertension prevention and control (45). Comprehensive obesity prevention and treatment strategies, including dietary interventions, physical activity promotion, and behavioral counseling, are crucial. (46)
Age-Sex and Malnutrition: The association between young adulthood and malnutrition is influenced by lifestyle, socio-economic factors, and physiological changes.(9) Young adults often experience malnutrition due to poor dietary habits, such as excessive consumption of processed foods and limited intake of nutritious options.(10) This aligns with findings from some studies (34,35), which reported similar trends among university students. The association between male sex and malnutrition (OR: 1.510, CI: 1.196- 1.908, p< 0.05), reflects a complex interplay of biological, social, and cultural factors. Males may encounter distinct challenges related to nutritional needs, cultural norms, and socio-economic factors. (36, 37,38) Research by Novak et al. (2019) (39) emphasizes that men are sometimes discouraged from seeking healthcare or nutritional support, contributing to undiagnosed or untreated malnutrition.
Packed Cell Volume (PCV) and Malnutrition
PCV, a measure of red blood cell volume in the blood, is significantly affected by malnutrition.(40) Insufficient intake of vital nutrients impairs red blood cell production, leading to anemia. Conditions like protein-energy malnutrition (PEM) result in insufficient intake of iron, folate, and vitamin B12, impairing red blood cell production.(41) Anemia leads to reduced oxygen transport, causing fatigue and weakness. (42) Studies by WHO (2024) highlighted the relationship between nutrient deficiencies and low PCV levels.(47)
METHODOLOGY
Study Design
A descriptive a cross-sectional study was used to assess the prevalence and factors associated with malnutrition and hypertension among university students. Medical records of 5110 enrolled students were analyzed to obtain comprehensive data for the study. The methodology employed rigorous procedures to ensure accuracy and reliability in the assessment of these health conditions within the university population.
Study area
The study was conducted at Lead City University, a private university, in South-West Nigeria.
Data Collection:
The primary source of data for this study was the medical records of students enrolled at Lead City University. These records provided detailed information on demographic characteristics as well as health metrics. Medical records were accessed with permission from the university authorities, ensuring compliance with ethical standards and data protection regulations.
Variables:
Several variables were examined to assess the prevalence and factors associated with malnutrition and hypertension among university students. Demographic variables included age, sex, and academic status, while health metrics encompassed weight, height, body mass index (BMI), blood pressure, blood group, and genotype. These variables were selected based on their relevance to the study objectives and existing literature on malnutrition and hypertension.
Data Analysis:
Data analysis was conducted using statistical software to examine the prevalence of malnutrition and hypertension and identify associated factors among university students. Descriptive statistics were used to summarize the demographic characteristics and health metrics of the study population. Chi-square tests and logistic regression analysis were employed to assess the associations between variables and the likelihood of malnutrition and hypertension.
Ethical Considerations:
Ethical approval for the study was obtained from the Institutional Review Board of Lead City University and measures were implemented to ensure the confidentiality and anonymity of their medical records. Data were securely stored and accessed only by authorized personnel involved in the research.
Limitations:
Several limitations should be considered when interpreting the findings of this study. Firstly, the cross-sectional design limits the ability to establish causal relationships between variables. Secondly, the study was conducted at a single university in South-West Nigeria, which may limit the generalizability of the findings to other settings. Additionally, reliance on medical records for data collection may introduce bias due to missing or incomplete information. Despite these limitations, this study provides valuable insights into the prevalence and factors associated with malnutrition and hypertension among university students in South-West Nigeria. The methodology employed rigorous procedures to ensure the accuracy and reliability of the findings, contributing to the body of knowledge on student health and informing evidence-based interventions and policies to improve health outcomes within the university population.
RESULT
Table 1 illustrates the demographic composition and health metrics across a sample of 5110 individuals. With an average age of 23.57 (+14.89), the age distribution demonstrates a varied range, with the highest proportion falling within the 18-29 age bracket (43.9%), followed closely by those under 18 years (37.7%). In terms of sex distribution, the sample displays a near-even split between males (45.9%) and females (54.1%). Examining blood group distribution, the data highlights blood group O as the most prevalent (53.6%), trailed by groups A (20.7%) and B (21.7%), with AB constituting the least common blood type (3.9%). Additionally, the overwhelming majority of individuals are Rhesus positive (95.1%). Analysis of blood group phenotypes unveils genotype AA as the most prevalent (73.6%), followed by AS (21.9%) and AC (3.3%), with less common genotypes such as CC, SC, and SS also observed. Anthropometric measurements reveal an average weight of 67.17 kg and height of 1.67 meters. The prevalence of hypertension and malnutrition were 8.7% and 42.7%, respectively.
The bar chart (Figure 1) illustrates the distribution of body mass index (BMI) categories within the studied population. The largest proportion of individuals falls within the normal weight category, constituting 57.3%. Following normal weight, the next most prevalent BMI category is overweight (21.5%). Additionally, the underweight category represents 9.2% of the sample, suggesting a smaller proportion of individuals with a BMI below the normal range, warranting further assessment for potential underlying health issues. Moreover, the proportions for different classes of obesity—Class 1, Class 2, and Class 3—reveal varying degrees of obesity within the population.
The table 2 examines hypertension prevalence across diverse demographic and health-related variables within a sample population. Age demonstrates a notable influence on hypertension rates (p-value = 0.000, X2= 397.69), with individuals aged 18-29 years exhibit the highest prevalence (37.0%). Additionally, a significant sex disparity is evident (p-value = 0.000, chi-square = 60.24), with males displaying a notably higher prevalence (63.4%) compared to females (36.6%). There was also association with packed cell volume (PCV) levels (p-value = 0.002, X2= 19.553) and body mass index (BMI) categories (p-value = 0.000, X2= 237.10). However, variables such as blood group, Rhesus factor, and genotype do not demonstrate a significant association with hypertension prevalence (p-values > 0.05).
The logistic regression analysis presented in table 3 shows the correlation between various independent variables—age groups, sex, PCV levels, and BMI categories—and the likelihood of developing hypertension, the dependent variable. Regarding sex, males exhibit a significant predisposition to hypertension (OR = 2.083, p = 0.001, CI: 1.337- 3.244), which approximately double the odds compared to females. Also, BMI categories display a correlation with hypertension likelihood (p < 0.001), with increasing BMI significantly elevating the odds of hypertension. Overweight and obese individuals (Classes 1, 2, and 3) exhibit substantially heightened odds (OR > 2.79) compared to those with a normal BMI, with the odds increasing progressively with higher BMI categories. However, age group and PCV levels fail to yield significant predictions concerning hypertension (p > 0.05).
The table 4 provides an overview of the relationship between several demographic and health-related variables and BMI (Body Mass Index) status. There is an association between age and BMI status (X2= 327.661, p< 0.05). The proportion of individuals with abnormal BMI decreases steadily with increasing age, with the highest prevalence seen in younger age groups (<18 to 30-39 years) and the lowest prevalence in older age groups (60-69 years and >70 years). There were also significant association between sex (X2= 67.177, p< 0.05), the packed cell volume (PCV) (X2=12.429, p< 0.05) and BMI status. In addition, there was a significant association between hypertensive status and BMI status (X2=101.845, p< 0.05). There was no significant association between blood group or Rhesus factor and BMI status.
The logistic regression analysis presented in table 5 shows the correlation between various independent variables—age groups, sex, PCV levels, and hypertension—and the likelihood of developing being malnourished, the dependent variable. In terms of sex, males (OR = 1.510, p = 0.001, CI: 1.196- 1.908) exhibit a significant predisposition to be malnourished, with approximately double the odds compared to females. Those who were hypertensive, demonstrated a significant correlation with malnutrition (OR= 2.147, p < 0.05, CI: 1.647- 2.797), indicating a double burden of disease. However, PCV levels and age groups fail to yield significant predictions concerning malnutrition (p > 0.05).
DISCUSSION
The demographic composition and health metrics of a population provide several important insights into potential health implications and necessary interventions (18). Age distribution, sex disparities, prevalence of malnutrition and hypertension, and associated factors like packed cell volume (PCV) all play critical roles in understanding and addressing public health challenges
Age-Sex Distribution and Health Implications
The age distribution within a population is a crucial determinant of health outcomes and intervention strategies. A population with a significant proportion of young adults, particularly those aged 18-29, presents unique health challenges and opportunities. While younger populations typically exhibit lower risks for certain chronic conditions, (19) they are also more susceptible to behaviors that negatively impact long-term health (20), such as poor dietary habits, sedentary lifestyles, and substance use. Studies (17,30) have shown that young adults are at a critical juncture where lifestyle choices can significantly influence their future health. These studies highlighted that unhealthy eating patterns established during university years can lead to chronic diseases later in life. The near-even split between males and females in the population suggests that any health interventions or programs should consider sex-specific factors. Differences in male and female health risks and behaviors necessitate tailored approaches to effectively address the unique needs of each group.
A prevalence of malnutrition (underweight 9.2%, overweight 21.5% and obese 12.0%) indicates a significant health concern within the population. The prevalence of obesity in this study was higher, compared to similar studies (5, 6) which found prevalence between 6% and 7.5%. Malnutrition can lead to a range of adverse health outcomes, including stunted growth, weakened immune function, increased susceptibility to infections, and impaired cognitive development (21). Additionally, malnutrition exacerbates the risk of chronic diseases and can contribute to higher morbidity and mortality rates (22,23). The relatively low prevalence of hypertension within the participants (8.7%) compared to other studies (13,14,15) is a positive indicator of overall cardiovascular health within the population. However, continued monitoring and preventive measures are essential to address the likely hypertension risk factors in this population (malnutrition).
HYPERTENSION
Sex Disparities: The significant sex disparity in hypertension prevalence, with males exhibiting an increased risk compared to females, raises important considerations for sex-specific healthcare approaches. Studies (24, 25) have revealed male sex as a non-modifiable risk factor. The higher prevalence of hypertension among males may be attributed to biological factors such as differences in hormonal profiles and genetic predispositions (26), as well as lifestyle factors including higher rates of tobacco and alcohol use (27), and lower health seeking behavior among men (28).
Age and Hypertension: The strong association between age and hypertension prevalence underscores the importance of aging as a significant risk factor for the development of hypertension. The escalating rates of hypertension observed among younger age group highlights the need for targeted screening and intervention strategies among them. This pattern of increasing risk of hypertension with age has been observed with several studies (17, 29). These studies highlighted advancing age with physiological changes such as arterial stiffness and decreased vascular compliance as contributory to the increased risk of hypertension. However, this increase risk among younger age group has been attributed to sedentary lifestyle, unhealthy diet, and poor blood pressure monitoring. (30)
Packed Cell Volume (PCV) and Hypertension: The significant fluctuations in hypertension prevalence across different PCV levels highlight the potential role of hematocrit levels in hypertension risk. Similar pattern were found in studies (31,32) conducted in Nigeria. Higher PCV levels may be indicative of condition such as dehydration (33), which is associated with increased cardiovascular risk. Monitoring PCV levels in clinical practice may provide valuable insights into hypertension risk assessment and management, particularly in individuals with underlying medical conditions affecting blood volume and viscosity.
MALNUTRITION
Age and Malnutrition:
The association between young adulthood and malnutrition is complex, influenced by lifestyle, socio-economic factors, and physiological changes (9). Despite being viewed as a healthy demographic, young adults can experience malnutrition due to poor dietary habits, including excessive consumption of processed foods and limited intake of nutritious options like fruits and vegetables (10). Physiological changes during this life stage, such as growth spurts and metabolic shifts, increase nutrient demands (34). Busy schedules and financial constraints exacerbate the problem (35).
Male Sex and Malnutrition: The association between male sex and malnutrition reflects a complex interplay of biological, social, and cultural factors. While malnutrition affects individuals of all genders, males may encounter distinct challenges. Biologically, males often have different nutritional needs due to factors like higher muscle mass and metabolic rates (36). Socially, cultural norms may influence dietary behaviors, with men sometimes encouraged to consume larger portions or specific types of foods associated with masculinity, potentially leading to imbalanced diets (37). Socio-economic factors also play a significant role. While men may have greater access to resources in many societies, economic instability, poverty, and food insecurity can still impede their ability to maintain a healthy diet especially in Sub-Saharan Africa (38). Furthermore, societal expectations around masculinity can discourage men from seeking healthcare or nutritional support, contributing to undiagnosed or untreated malnutrition. (39)
Packed Cell Volume (PCV) and malnutrition:
Packed cell volume (PCV), a measure of red blood cell volume in the blood, is significantly affected by malnutrition (40). In conditions like protein-energy malnutrition (PEM), insufficient intake of vital nutrients like iron, folate, and vitamin B12 impairs red blood cell production, leading to decreased PCV levels and anemia (41). Anemia results in reduced oxygen transport, causing fatigue and weakness (42). Malnutrition also compromises immunity, increasing susceptibility to infections, which can worsen anemia and lower PCV levels (21). Regular monitoring of PCV helps assess nutritional status and detect signs of malnutrition.
Hypertension and malnutrition: The robust correlation between BMI categories and hypertension likelihood underscores the critical role of obesity as a major risk factor for hypertension (43, 44). The progressively elevated odds of hypertension observed with increasing BMI categories highlight the importance of weight management and lifestyle modification in hypertension prevention and control (45). Overweight and obese individuals are at significantly higher risk of developing hypertension (43), emphasizing the need for comprehensive obesity prevention and treatment strategies, including dietary interventions, physical activity promotion, and behavioral counseling (46).
CONCLUSION
The findings from this underscore the multifactorial nature of hypertension and the importance of considering various demographic and health-related variables in its prevention and management. Targeted interventions aimed at addressing modifiable risk factors such as malnutrition, unhealthy lifestyle behaviors, and aging-related changes are crucial for reducing the burden of hypertension and improving cardiovascular health outcomes within the population. Additionally, further research is needed to elucidate the complex interactions between these variables and their implications for personalized hypertension management strategies.
ACKNOWLEDGEMENTS
The authors thank the vice chancellery of Lead City University, staffs of the Lead City Hospital for the support during the study.
CONFLICTS OF INTEREST
There was no conflict of interest in this study.
FUNDING SOURCE
No funding was received for the study
ETHICAL APPROVAL STATEMENT
Ethical approval was obtained from Oyo State Research Ethics Committee (NHREC/OYOSHRIEC/10/11/22)
REFERENCES
- Zhang HZ, Wang YH, Ge YL, Wang SY, Sun JY, Chen LL, et al. Obesity, malnutrition, and the prevalence and outcome of hypertension: Evidence from the National Health and Nutrition Examination Survey. Frontiers in Cardiovascular Medicine. 2023 Mar 2;10.
- Gosse R, Chona E, Kiyalo V, Kiangi R, Ramadhani F. Eating habits and physical exercise patterns among undergraduate nursing students at Muhimbili University of Health and Allied Sciences, Tanzania: A cross-sectional study. Tanzania Journal of Health Research [Internet]. 2023 [cited 2024 Apr 26];24(4). Available from: https://www.ajol.info/index.php/thrb/article/download/238847/241796/608922
- Ekpenyong CE, Akpan EE. Sub-Saharan Africa: A Review of the Situation in Nigeria. European Journal of Sustainable Development. 2013 Jun 1;2(2):141–64.
- Global Nutrition Report. The burden of malnutrition – Global Nutrition Report [Internet]. Global Nutrition Report. 2019. Available from: https://globalnutritionreport.org/reports/global-nutrition-report-2018/burden-malnutrition/
- Adu O, Falade A, Nwalutu E, Elemo B, Magbagbeola O. Nutritional status of undergraduates in a Nigerian university in south-west Nigeria. International Journal of Medicine and Medical Sciences [Internet]. 2009 [cited 2024 Apr 26];1(8):318–24. Available from: https://academicjournals.org/article/article1379235574_Adu%20et%20al.pdf
- Oladoyinbo CA, Ekerette NN. Double Burden of Malnutrition among Undergraduates in Ogun State Nigeria. International Journal of Public Health Science (IJPHS). 2015 Dec 1;4(4):315.
- McNamara K, Wood E. Food taboos, health beliefs, and gender: understanding household food choice and nutrition in rural Tajikistan. Journal of Health, Population and Nutrition. 2019 Aug 7;38(1).
- Silva P, Araújo R, Lopes F, Ray S. Nutrition and food literacy: Framing the challenges to health communication. Nutrients. 2023;15(22):4708–8.
- Abdelhafez AI, Akhter F, Alsultan AA, Jalal SM, Ali A. Dietary Practices and Barriers to Adherence to Healthy Eating among King Faisal University Students. International Journal of Environmental Research and Public Health. 2020 Dec 1;17(23):8945.
- Chung A, Vieira D, Donley T, Tan N, Jean-Louis G, Kiely Gouley K, et al. Adolescent peer influence via social media on eating behaviors: A scoping review. Journal of Medical Internet Research [Internet]. 2020 Apr 28;23(6). Available from: https://www.ncbi.nlm.nih.gov/pmc/articles/PMC8212626/
- World Health Organization. Hypertension [Internet]. www.who.int. 2024 [cited 2024 Apr 26]. Available from: https://www.who.int/health-topics/hypertension
- World Health Organization. Hypertension [Internet]. World Health Organization. 2023 [cited 2024 Apr 26]. Available from: https://www.who.int/news-room/fact-sheets/detail/hypertension
- Birinus Ezeala-Adikaibe, Chigekwu Nkeiruka Mbadiwe, Umezurike Hughes Okafor, Ume Monday Nwobodo, Chibuzo Celestine Okwara, Chibuike Paul Okoli, et al. Prevalence of hypertension in a rural community in southeastern Nigeria; an opportunity for early intervention. Journal of Human Hypertension. 2023 Apr 29;
- Oluwatosin Odubela, Nkiruka Odunukwe, Peer N, Adesola Zaidat Musa, Babatunde Lawal Salako, Andre Pascal Kengne. Prevalence of hypertension among antiretroviral therapy naïve patients in Lagos, Nigeria. Clinical hypertension. 2023 Nov 1;29(1).
- Suleiyol Charity Abatur, Joseph Michael Okwori, Terwase Simon Amgah, Ter Basil Anweh, Igba Richard Injor, Daniel Friday Onuh. A retrospective cross-sectional study of the prevalence of hypertension and its co-morbidities in a Nigerian medical center. World Journal of Advanced Research and Reviews [Internet]. 2023 Jul 30;19(1):831–46. Available from: https://wjarr.com/sites/default/files/WJARR-2023-1394.pdf
- Zhou B, Perel P, Mensah GA, Ezzati M. Global epidemiology, health burden and effective interventions for elevated blood pressure and hypertension. Nature Reviews Cardiology [Internet]. 2021 May 28;18(18). Available from: https://www.nature.com/articles/s41569-021-00559-8
- Ondimu DO, Kikuvi GM, Otieno WN. Risk factors for hypertension among young adults (18-35) years attending in Tenwek Mission Hospital, Bomet County, Kenya in 2018. The Pan African Medical Journal [Internet]. 2019 Jul 16 [cited 2020 May 24];33. Available from: https://www.panafrican-med-journal.com/content/article/33/210/full/
- Tulchinsky TH, Varavikova EA. Measuring, Monitoring, and Evaluating the Health of a Population. The New Public Health [Internet]. 2014;91–147. Available from: https://www.ncbi.nlm.nih.gov/pmc/articles/PMC7171905/
- Public Health Agency of Canada. Aging and chronic diseases: A profile of Canadian seniors [Internet]. www.canada.ca. 2021. Available from: https://www.canada.ca/en/public-health/services/publications/diseases-conditions/aging-chronic-diseases-profile-canadian-seniors-report.html
- Maurya C, Maurya P. Adverse childhood experiences and health risk behaviours among adolescents and young adults: evidence from India. BMC Public Health. 2023 Mar 21;23(1).
- Morales F, Montserrat-de S, Leon MJ, Rivero‐Pino F. Effects of Malnutrition on the Immune System and Infection and the Role of Nutritional Strategies Regarding Improvements in Children’s Health Status: A Literature Review. Nutrients. 2023 Dec 19;16(1):1–1.
- Saunders J, Smith T. Malnutrition: Causes and consequences. Clinical Medicine [Internet]. 2010 Dec [cited 2024 Apr 26];10(6):624–7. Available from: https://www.ncbi.nlm.nih.gov/pmc/articles/PMC4951875/
- Fan Y, Yao Q, Liu Y, Jia T, Zhang J, Jiang E. Underlying Causes and Co-existence of Malnutrition and Infections: An Exceedingly Common Death Risk in Cancer. Frontiers in Nutrition. 2022 Feb 23;9.
- Connelly PJ, Currie G, Delles C. Sex Differences in the Prevalence, Outcomes and Management of Hypertension. Current Hypertension Reports. 2022 Mar 7;24(6):185–92.
- Defianna SR, Santosa A, Probandari A, Dewi FST. Gender Differences in Prevalence and Risk Factors for Hypertension among Adult Populations: A Cross-Sectional Study in Indonesia. International Journal of Environmental Research and Public Health. 2021 Jun 9;18(12):6259.
- Ahn SY, Gupta C. Genetic Programming of Hypertension. Frontiers in Pediatrics [Internet]. 2018 Jan 22;5. Available from: https://www.ncbi.nlm.nih.gov/pmc/articles/PMC5786744/
- Falk DE, Yi H, Hiller-Sturmhöfel S. An epidemiologic analysis of co-occurring alcohol and tobacco use and disorders: findings from the National Epidemiologic Survey on Alcohol and Related Conditions. Alcohol research & health : the journal of the National Institute on Alcohol Abuse and Alcoholism [Internet]. 2006 [cited 2024 Apr 26];29(3):162–71. Available from: https://www.ncbi.nlm.nih.gov/pmc/articles/PMC6527037/#:~:text=However%2C%20men %20were%20much%20more
- Olanrewaju FO, Ajayi LA, Loromeke E, Olanrewaju A, Allo T, Nwannebuife O, et al. Masculinity and men’s health-seeking behaviour in Nigerian academia. Cogent Social Sciences. 2019 Nov 11;5(1).
- Liu X, Xiang Z, Shi X, Schenck H, Yi X, Ni R, et al. The Risk Factors of High Blood Pressure among Young Adults in the Tujia-Nationality Settlement of China. BioMed Research International. 2017;2017:1–6.
- Park JH, Moon JH, Kim HJ, Kong MH, Oh YH. Sedentary lifestyle: Overview of Updated Evidence of Potential Health Risks. Korean Journal of Family Medicine [Internet]. 2020 Nov 19;41(6):365–73. Available from: https://www.ncbi.nlm.nih.gov/pmc/articles/PMC7700832/
- Akinnuga A, Bamidele O, Chukwuebuka I. Correlation between packed cell volume and body mass index inHypertensive and normotensive subjects. Annals of Biological Research. 2011 Jan;2:65–71.
- Erhabor O, Shehu A, Erhabor T, Adias TC, Iwueke IP. Some Full Blood Count Parameters among Hypertensive Patients Attending Specialist Hospital, Sokoto, Nigeria. Open Journal of Blood Diseases. 2019;09(04):77–91.
- Gangopadhyay D, Roy M, Laha S, Nandi D, Sengupta R, Chattopadhyay A. Hyperviscosity syndrome revisited. Annals of Pediatric Cardiology. 2022;15(3):284.
- Winpenny EM, van Sluijs EMF, White M, Klepp KI, Wold B, Lien N. Changes in diet through adolescence and early adulthood: longitudinal trajectories and association with key life transitions. International Journal of Behavioral Nutrition and Physical Activity [Internet]. 2018 Sep 10;15(1). Available from: https://ijbnpa.biomedcentral.com/articles/10.1186/s12966-018-0719-8
- Ahmad NSS, Sulaiman N, Sabri MF. Food Insecurity: Is It a Threat to University Students’ Well-Being and Success? International Journal of Environmental Research and Public Health [Internet]. 2021 May 25;18(11):5627. Available from: https://www.ncbi.nlm.nih.gov/pmc/articles/PMC8197461/
- Indya Del-Cuerpo, Jerez-Mayorga D, Luis Javier Chirosa, María Dolores Morenas-Aguilar, Mariscal-Arcas M, Lopez-Moro A, et al. Males Have a Higher Energy Expenditure than Females during Squat Training. Nutrients. 2023 Aug 4;15(15):3455–5.
- Higgs S. Social norms and their influence on eating behaviours. Appetite. 2015 Mar;86(1):38–44.
- Wudil AH, Usman M, Rosak-Szyrocka J, Pilař L, Boye M. Reversing Years for Global Food Security: A Review of the Food Security Situation in Sub-Saharan Africa (SSA). International Journal of Environmental Research and Public Health [Internet]. 2022 Jan 1;19(22):14836. Available from: https://www.mdpi.com/1660-4601/19/22/14836
- Novak JR, Peak T, Gast J, Arnell M. Associations Between Masculine Norms and Health-Care Utilization in Highly Religious, Heterosexual Men. American Journal of Men’s Health. 2019 May;13(3):155798831985673.
- Getawa S, Getaneh Z, Melku M. Hematological Abnormalities and Associated Factors Among Undernourished Under-Five Children Attending University of Gondar Specialized Referral Hospital, Northwest Ethiopia. Journal of Blood Medicine. 2020 Dec;Volume 11:465–78.
- Atassi H. Protein-Energy Malnutrition: Background, Pathophysiology, Etiology [Internet]. Medscape.com. 2019. Available from: https://emedicine.medscape.com/article/1104623-overview
- Turner J, Badireddy M. Anemia [Internet]. Nih.gov. StatPearls Publishing; 2023 [cited 2024 Apr 26]. Available from: https://www.ncbi.nlm.nih.gov/books/NBK499994/
- Landi F, Calvani R, Picca A, Tosato M, Martone AM, Ortolani E, et al. Body Mass Index Is Strongly Associated with Hypertension: Results from the Longevity Check-up 7+ Study. Nutrients [Internet]. 2018 Dec 13;10(12):1976. Available from: https://www.ncbi.nlm.nih.gov/pmc/articles/PMC6316192/
- Khalid F, Siddique A, Siddiqui JA, Panhwar G, Singh S, Anwar A, et al. Correlation Between Body Mass Index and Blood Pressure Levels Among Hypertensive Patients: A Gender-Based Comparison. Cureus. 2020 Oct 15;
- Campbell N, Burgess E, Choi B, Taylor G, Wilson E, Cleroux J, et al. Lifestyle modifications to prevent and control hypertension. 1. Methods and an overview of the Canadian recommendations. Canadian Hypertension Society, Canadian Coalition for High Blood Pressure Prevention and Control, Laboratory Centre for Disease Control at Health Canada, Heart and Stroke Foundation of Canada. CMAJ: Canadian Medical Association Journal [Internet]. 1999 May 5 [cited 2024 Apr 26];160(9):S1. Available from: http://www.ncbi.nlm.nih.gov/pmc/articles/pmc1230333/
- Mb NA, Tronieri JS, Wadden T. Behavioral Approaches to Obesity Management [Internet]. Feingold KR, Anawalt B, Boyce A, Chrousos G, de Herder WW, Dungan K, et al., editors. PubMed. South Dartmouth (MA): MDText.com, Inc.; 2000. Available from: https://www.ncbi.nlm.nih.gov/books/NBK278952/
ANNEXES AND SUPPLEMENTARY MATERIAL
Table 1: Socio-demographic factors
| Variables | Categories | Frequencies
(n=5110) |
Percentages (%) |
| Age | (Mean ± SD) | 23.57+14.89 | |
| Less than 18 years | 1923 | 37.7 | |
| 18-29 years | 2241 | 43.9 | |
| 30-39 years | 545 | 10.7 | |
| 40-49 years | 277 | 5.4 | |
| 50-59 years | 97 | 1.9 | |
| 60-69 years | 21 | 0.4 | |
| 70 years and above | 2 | 0.01 | |
| Sex | Male | 2344 | 45.9 |
| Female | 2766 | 54.1 | |
| Blood Group | A | 1060 | 20.7 |
| AB | 200 | 3.9 | |
| B | 1111 | 21.7 | |
| O | 2739 | 53.6 | |
| Rhesus | Negative (-) | 245 | 4.9 |
| Positive (+) | 4861 | 95.1 | |
| Genotype of Patients | AA | 3760 | 73.6 |
| AC | 169 | 3.3 | |
| AS | 1121 | 21.9 | |
| CC | 5 | 0.1 | |
| SC | 20 | 0.4 | |
| SS | 35 | 0.7 | |
| PCV of patients | (Mean ± SD) | 38.5 (9.74) | |
| >19 | 4 | 0.1 | |
| 20-24 | 32 | 1.1 | |
| 25-29 | 50 | 1.8 | |
| 30-34 | 547 | 19.3 | |
| 35-39 | 1842 | 65.0 | |
| 40-44 | 357 | 12.6 | |
| Weight of patients | (Mean ± SD) | 67.17 (15.18) | |
| Height of patients | (Mean ± SD) | 1.67 (0.93) | |
| BMI | (Mean ± SD) | 24.02 (5.89) | |
| BMI | Underweight | 468 | 9.2 |
| Normal weight | 2901 | 57.3 | |
| Overweight | 1089 | 21.5 | |
| Obesity Class 1 | 416 | 8.2 | |
| Obesity Class 2 | 127 | 2.5 | |
| Obesity Class 3 | 63 | 1.3 | |
| Blood Pressure | Systolic (Mean ± SD) | 115.93 (15.26) | |
| Diastolic (Mean ± SD) | 73.52 (17.43) | ||
| Systolic Blood Pressure | <120 | 3412 | 66.8 |
| 120-129 | 865 | 16.9 | |
| 130-139 | 483 | 9.5 | |
| 140-159 | 294 | 5.8 | |
| 160-179 | 44 | 0.9 | |
| >180 | 12 | 0.2 | |
| Diastolic Blood Pressure | <80 | 4158 | 81.4 |
| 80-89 | 620 | 12.1 | |
| 90-99 | 243 | 4.8 | |
| >100 | 89 | 1.7 | |
| Hypertension Status | Hypertensive | 443 | 8.7 |
| Non-Hypertensive | 4667 | 91.3 | |
| 5110 |
Table 2: Bivariate analysis using Chi-Square Analysis
| Variables | Categories | Hypertensive | Non-hypertensive | P value | Chi-Square |
| N (%) | N (%) | ||||
| Age | < 18 years | 65 (14.7) | 1858 (39.8) | 0.000 | 397.69* |
| 18-29 years | 164 (37.0) | 2077 (44.5) | |||
| 30-39 years | 87 (19.6) | 458 (9.8) | |||
| 40-49 years | 83 (18.7) | 194 (4.2) | |||
| 50-59 years | 33 (7.4) | 64 (1.4) | |||
| 60-69 years | 11 (2.5) | 10 (0.2) | |||
| >70 years | 0 (0.0) | 2 (0.01) | |||
| Sex | Male | 281 (63.4) | 2063 (44.2) | 0.000 | 60.24* |
| Female | 162 (36.6) | 2604 (55.8) | |||
| Blood Group | A | 98 (22.1) | 962 (20.6) | 0.367 | 3.164 |
| AB | 11 (2.5) | 189 (4.0) | |||
| B | 93 (21.0) | 1018 (21.8) | |||
| O | 241 (54.4) | 2498 (53.5) | |||
| Rhesus | Negative (-) | 27 (6.1) | 218 (4.7) | 0.339 | 2.166 |
| Positive (+) | 416 (93.9) | 4445 (95.2) | |||
| Genotype of Patients | AA | 326 (73.6) | 3434 (73.6) | 0.827 | 2.156 |
| AC | 16 (3.6) | 153 (3.3) | |||
| AS | 98 (22.1) | 1023 (21.9) | |||
| CC | 0 (0.0) | 5 (0.1) | |||
| SC | 2 (0.5) | 18 (0.4) | |||
| SS | 1 (0.2) | 34 (0.7) | |||
| PCV of patients | >19 | 0 (0.0) | 4 (0.2) | 0.002 | 19.553* |
| 20-24 | 1 (0.3) | 31 (1.2) | |||
| 25-29 | 6 (2.0) | 44 (1.7) | |||
| 30-34 | 35 (11.5) | 512 (20.3) | |||
| 35-39 | 210 (69.1) | 1632 (64.6) | |||
| 40-44 | 52 (17.1) | 305 (12.1) | |||
| BMI Group | Underweight | 16 (3.6) | 452 (9.8) | 0.000 | 237.10* |
| Normal weight | 152 (34.5) | 2749 (59.5) | |||
| Overweight | 142 (32.3) | 947 (20.5) | |||
| Obesity Class 1 | 73 (16.6) | 343 (7.4) | |||
| Obesity Class 2 | 36 (8.2) | 91 (2.0) | |||
| Obesity Class 3 | 21 (4.8) | 42 (0.9) |
Table 3: Binary Logistic Regression of the hematological parameters and hypertensive status
| B | S.E. | Wald | df | Sig. | OR | 95% C.I.for EXP(B) | ||
| Lower | Upper | |||||||
| Age Grouped | 89.011 | 6 | .000 | |||||
| Less than 18 years | 18.472 | 28110.013 | .000 | 1 | .999 | 105241960.872 | .000 | . |
| 18-29 years | 19.307 | 28110.013 | .000 | 1 | .999 | 242659101.186 | .000 | . |
| 30-39 years | 19.771 | 28110.013 | .000 | 1 | .999 | 385749844.561 | .000 | . |
| 40-49 years | 20.508 | 28110.013 | .000 | 1 | .999 | 806448714.489 | .000 | . |
| 50-59 years | 20.544 | 28110.013 | .000 | 1 | .999 | 835908222.104 | .000 | . |
| 60-69 years | 21.229 | 28110.013 | .000 | 1 | .999 | 1658377095.769 | .000 | . |
| Sex (Male) | .734 | .226 | 10.523 | 1 | .001 | 2.083* | 1.337 | 3.244 |
| PCV Grouped | 2.361 | 5 | .797 | |||||
| >19 | -18.069 | 19961.676 | .000 | 1 | .999 | .000 | .000 | . |
| 20-24 | -.824 | 1.056 | .609 | 1 | .435 | .439 | .055 | 3.477 |
| 25-29 | .347 | .568 | .374 | 1 | .541 | 1.415 | .465 | 4.307 |
| 30-34 | -.247 | .308 | .644 | 1 | .422 | .781 | .428 | 1.428 |
| 35-39 | -.148 | .178 | .690 | 1 | .406 | .863 | .609 | 1.223 |
| BMI Group | 50.256 | 5 | .000 | |||||
| Underweight | -.161 | .331 | .237 | 1 | .626 | .851 | .445 | 1.627 |
| Overweight | .845 | .153 | 30.395 | 1 | .000 | 2.329* | 1.724 | 3.146 |
| Obesity Class 1 | 1.001 | .211 | 22.534 | 1 | .000 | 2.720* | 1.799 | 4.111 |
| Obesity Class 2 | 1.081 | .371 | 8.508 | 1 | .004 | 2.947* | 1.426 | 6.094 |
| Obesity Class 3 | 1.637 | .453 | 13.042 | 1 | .000 | 5.142* | 2.114 | 12.504 |
| Constant | -22.275 | 28110.013 | .000 | 1 | .999 | .000 | ||
Table 4: Bivariate analysis between hematological parameters and BMI status
| Variables | Categories | Abnormal BMI | Normal Weight | P value | Chi-Square |
| N (%) | N (%) | ||||
| Age | < 18 years | 697 (32.2) | 1215 (41.90) | 0.000 | 327.661* |
| 18-29 years | 828 (38.3) | 1394 (48.1) | |||
| 30-39 years | 346 (16.0) | 192 (6.6) | |||
| 40-49 years | 197 (9.1) | 73 (2.5) | |||
| 50-59 years | 77 (3.6) | 19 (0.7) | |||
| 60-69 years | 16 (0.7) | 4 (0.1) | |||
| >70 years | 1 (0.01) | 1 (0.01) | |||
| Sex | Male | 851 (39.3) | 1478 (50.9) | 0.000 | 67.177* |
| Female | 1312 (60.7) | 1423 (49.1) | |||
| Blood Group | A | 457 (21.1) | 596 (20.5) | 0.610 | 1.822 |
| AB | 76 (3.5) | 121 (4.2) | |||
| B | 465 (21.5) | 639 (22.0) | |||
| O | 1165 (53.9) | 1545 (53.3) | |||
| Rhesus | Negative (-) | 107 (4.9) | 137 (4.7) | 0.894 | 0.224 |
| Positive (+) | 2054 (95.0) | 2762 (95.2) | |||
| Genotype of Patients | AA | 1595 (73.7) | 2128 (73.4) | 0.344 | 5.628 |
| AC | 61 (2.8) | 108 (3.7) | |||
| AS | 486 (22.5) | 626 (21.6) | |||
| CC | 1 (0.0) | 4 (0.1) | |||
| SC | 8 (0.4) | 12 (0.4) | |||
| SS | 12 (0.6) | 23 (0.8) | |||
| PCV of patients | >19 | 0 (0.0) | 4 (0.2) | 0.029 | 12.429* |
| 20-24 | 13 (1.2) | 19 (1.1) | |||
| 25-29 | 19 (1.7) | 29 (1.7) | |||
| 30-34 | 243 (21.8) | 300 (17.7) | |||
| 35-39 | 689 (61.9) | 1140 (67.2) | |||
| 40-44 | 149 (13.4) | 205 (12.1) | |||
| Hypertensive Status | Non-Hypertensive | 1875 (86.7) | 2749 (94.8) | 0.000 | 101.845* |
| Hypertensive | 288 (13.3) | 152 (5.2) |
Table 5: Binary Logistic Regression of the hematological parameters and BMI
| B | S.E. | Wald | df | Sig. | Exp(B) | 95% C.I.for EXP(B) | ||
| Lower | Upper | |||||||
| Age Grouped | 134.234 | 6 | .000 | |||||
| Less than 18 years | .922 | 1.417 | .424 | 1 | .515 | 2.514 | .157 | 40.382 |
| 18-29 years | .893 | 1.416 | .398 | 1 | .528 | 2.443 | .152 | 39.187 |
| 30-39 years | -.169 | 1.420 | .014 | 1 | .906 | .845 | .052 | 13.654 |
| 40-49 years | -.352 | 1.427 | .061 | 1 | .805 | .703 | .043 | 11.522 |
| 50-59 years | -.865 | 1.448 | .356 | 1 | .550 | .421 | .025 | 7.197 |
| 60-69 years | -.708 | 1.564 | .205 | 1 | .651 | .493 | .023 | 10.567 |
| Male | .412 | .119 | 11.972 | 1 | .001 | 1.510 | 1.196 | 1.908* |
| PCV Grouped | 3.334 | 5 | .649 | |||||
| <19 | 20.893 | 20096.136 | .000 | 1 | .999 | 1184453181.536 | .000 | . |
| 20-24 | -.018 | .389 | .002 | 1 | .963 | .982 | .459 | 2.104 |
| 25-29 | .389 | .350 | 1.238 | 1 | .266 | 1.476 | .744 | 2.928 |
| 30-34 | .073 | .174 | .176 | 1 | .675 | 1.076 | .765 | 1.513 |
| 35-39 | .178 | .124 | 2.054 | 1 | .152 | 1.194 | .937 | 1.523 |
| Hypertensive | .764 | .135 | 32.004 | 1 | .000 | 2.147 | 1.647 | 2.797* |
| Constant | -1.354 | 1.432 | .894 | 1 | .345 | .258 | ||
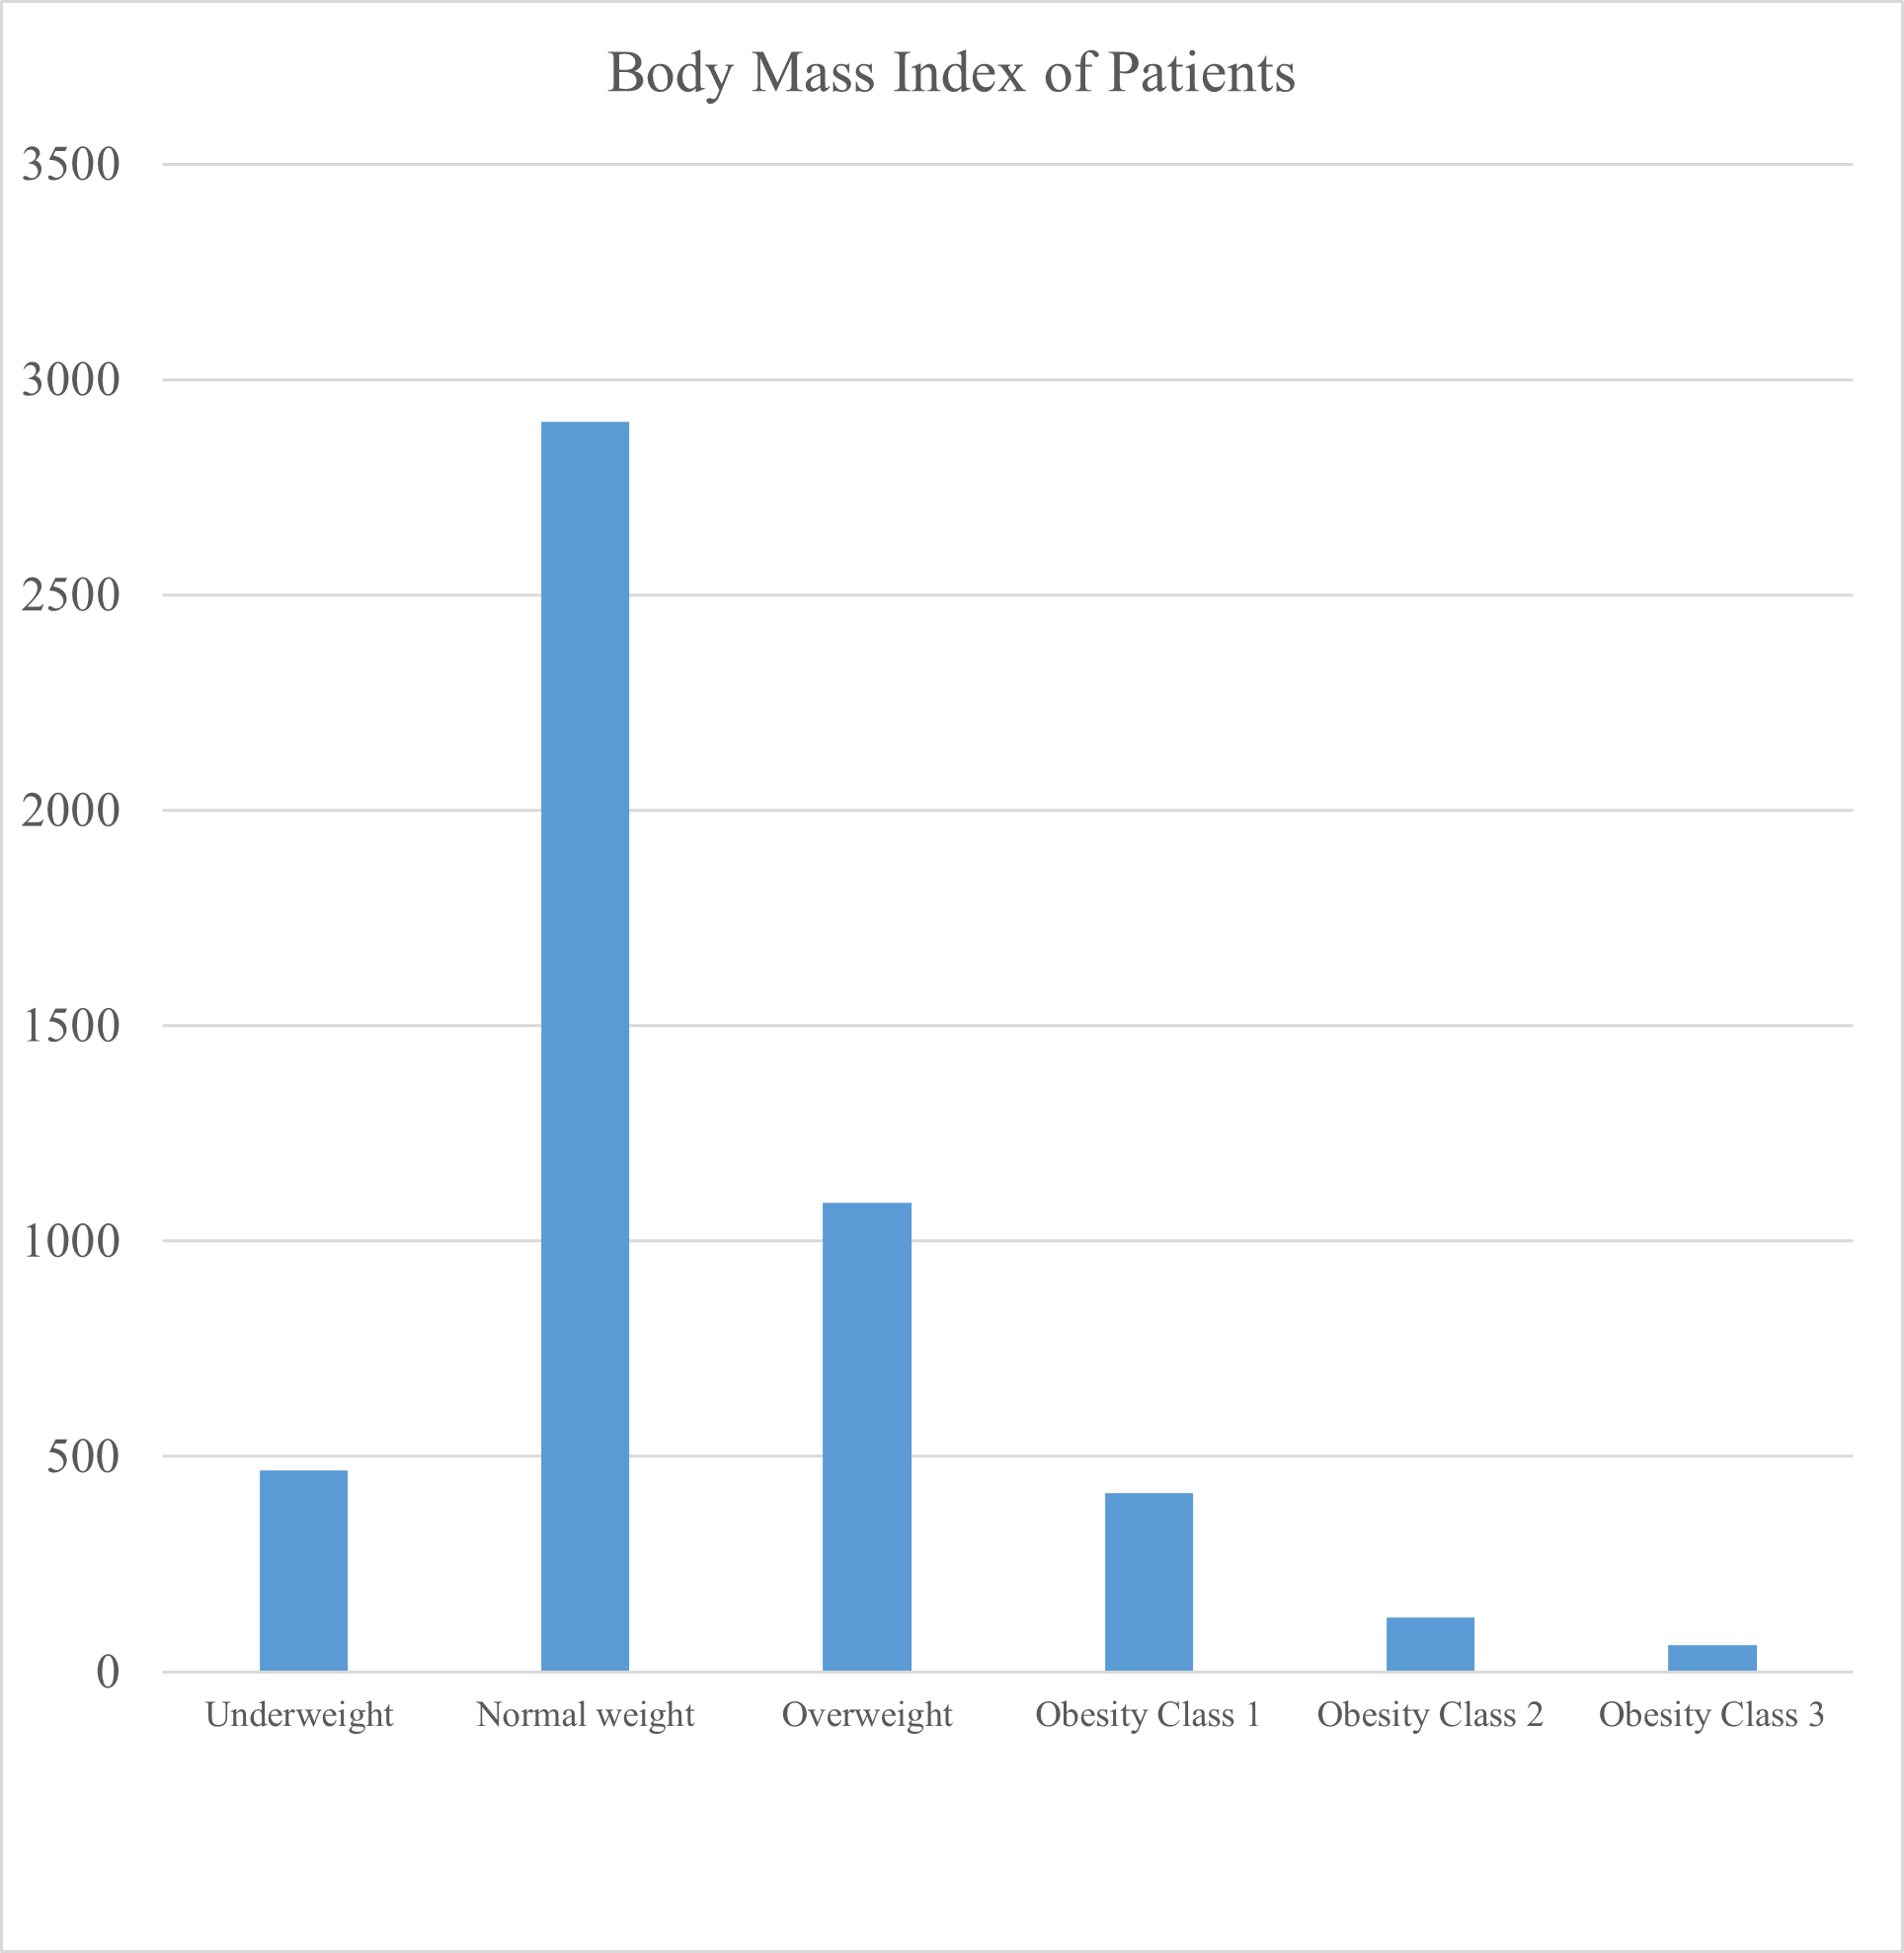
Figure 1: Bar Chart showing the Body Mass Index of the Patients.