
Price Volatility, Population Dynamics and Employment Nexus: Evidence from Nigeria.
- Olujobi Oluwatosin Michael
- Joseph Adetokunbo Abu
- 1541-1554
- Jun 15, 2024
- Economics
Price Volatility, Population Dynamics and Employment Nexus: Evidence from Nigeria.
Olujobi Oluwatosin Michael1*, Joseph Adetokunbo Abu2
1Department of Economics College of Social and Management Sciences Achievers University Owo, Ondo-state, Nigeria
2Department of Accounting College of Social and Management Sciences Achievers University Owo, Ondo-state, Nigeria
*Corresponding Author
DOI: https://dx.doi.org/10.47772/IJRISS.2024.805110
Received: 03 April 2024; Revised: 19 April 2024; Accepted: 01 May 2024; Published: 14 June 2024
ABSTRACT
This study investigates how Nigerian employment is impacted by changes in population dynamics and price movements. How the influence of price volatility and price expectations in the rate of inflation as a key measures of the general price level. The investigation used an estimating technique called the autoregressive distributive lag (ARDL) model to assess the long- and short-term relationships between population dynamics, employment as measured by labor, and price fluctuations as proxy by the consumer price index. The dependent variable in the model is labor force, which is a proxy for employment, while the regress variables are the consumer price index, foreign direct investment, population growth rate, and tax revenue. Additionally, the ADRL bound test verified that there isn’t actually a long-term association. While the Augmented Dickey Fuller unit root cointegration test verified variables are stationary at level and at first difference, there is a correlation between employment, as measured by the labor force, price changes, as measured by the consumer price index, foreign direct investment, population growth rate, and tax revenue. The study’s findings indicate that price rises, as determined by the consumer price index, have a short- and long-term marginally positive impact on employment. Additionally, the population has a short-term and minimal negative influence on jobs. In addition, the research recommends that the government implement measures to help slow down population growth in order to control the labor supply and, consequently, lower unemployment rates, also suggest a much symmetric inflation objectives that will improve the management of both fiscal and monetary policies inter-temporal sustainability in Nigeria .
Keywords: Price Volatility, System ARDL, Population Dynamics, Employment rate
INTRODUCTION
Crucial to every nations of the world is the goal of achieving price stability, the much objective of price stability essentially encapsulates the need to eliminate price expectations to zero and also eliminate long run uncertainty and volatility in the general price levels. The intense debate of this study focused much more within the purview of two main monetary frameworks. Inflationary targeting and monetary systemic targeting. There’s also this chain reaction of event cause primarily by population growth and high rate of unemployment that has been much of an existential problems in Nigeria. According to the neoclassical growth model states that an economy benefits from population expansion since it is correlated with advances in technology. In order to meet the growing demand for specific goods and services, technological advancements are becoming increasingly necessary due to the growing population. As a result of the rising population, economies benefit from a huge labor force that is also more affordable because of its widespread availability. When labor becomes more readily available and affordable, firms are more likely to hire people at low cost, which leads to a significant increase in employment. Low labour costs cause money to be diverted from wages into technological innovation (Coale & Hoover, 2012).
Nigeria has one of the highest rates of inflation in the world in 2024.Nigeria’s annual inflation rate climbed further to a near 28-year high of 29.9% in January 2024, up from 28.9% in December 2023 and above market forecasts of 22.5%—roughly 17 percent. Emerging economies tend to have higher rates of inflation. This is due to a number of factors. There will probably be a rise in demand for products and services as emerging economies grow more quickly. However, prices may rise and inflation may result if the supply remains constant while demand rises. The absence of a well-defined monetary policy is another issue at play. This could lead to currency manipulation to accomplish short-term objectives, such lowering export costs. Furthermore, the overabundance of money creation drives down the value of money and raises inflation. Nigeria has faced a number of development obstacles in recent years, in addition to an unstable micro and macroeconomic climate. With high rates of unemployment (33.3%) and inflation (29.9%), along with an elevated public debt profile that has led to skyrocketing debt-to-income and debt-to-GDP ratios, about 133 million people (63.0%) of her population live in multidimensional poverty (Dauda, 2022; World Bank, 2022 and 2023; DMO-Debt Management Office, 2023; National Bureau of Statistics-NBS, 2023; and Central Bank of Nigeria-CBN, 2023). The result of all of these has been a declining national misery index, or MI. Nigeria’s population is suffering more than ever as a result of the country’s MI, which increased from roughly 43.0 in 2018 to 55.0 in 2019 and then to 61.15 in 2024
Stylized Facts on Price Changes, Employment to Population-Ratio in Nigeria Overtime
The percentage of the working-age population that is employed is known as the employment-to-population-ratio. 77.1% of Nigerians of working age had a job as of Q2 2023. When broken down by gender, the employment-to-population ratio for men and women was 79.3% and 74.9%, respectively. In urban regions, the employment-to-population ratio was 73.8%, while in rural areas it was around 80%
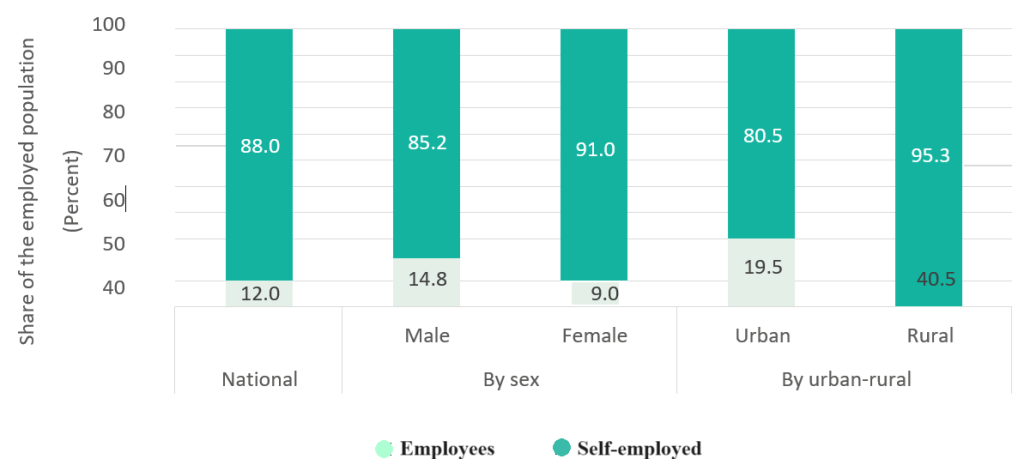
Figure 1: Employment-To-Population Ratio by Gender, Urban and Rural Settings
Source: Authors Computation
In the light of the above illustration of the interrelationship between employment to population ratio, certain economists view on the interrelationship between, price changes, population dynamics and employment according to the monetarists view inflation as a result of changes in prices of goods and services is harmful to both economic growth and employment, structuralisms maintain that inflation has a positive impact on both. Every point of view offers an explanation for why inflation affects employment, population dynamics and economic growth in a favorable or bad way. Keynesians also stated that inflation may increase growth by raising the rate of profit, which can increase private investment, which can trigger growth employment in the economy. For example, neoclassical views hold that inflation increases economic growth by shifting the income distribution in favor of higher saving capitalists, growth, and employment. However, theories or empirical research demonstrates why inflation is positively correlated with employment but adversely correlated with economic growth and unemployment.
Status of Social-Employment Ratio in Nigeria
The two main categories that make up the overall employment status are employees and self-employed people. Employees are defined as anyone who works for compensation in the form of salaries and wages, whether given in cash or in kind. This includes paid apprentices. Employers, own-account employees, and contributing family workers are all considered self-employed.
In Q2 2023, self-employment accounted for 88.0% of Nigerians in employment, with employees making up the remaining 12.0%. When broken down by gender, 91.0% of working women and 85.2% of working males were self-employed. When broken down by region, 80.5% of employed persons in cities and 95.3% of employed people in rural regions were self-employed.
Nigeria Labour Markets Indicators at First-Third Quarters 2023
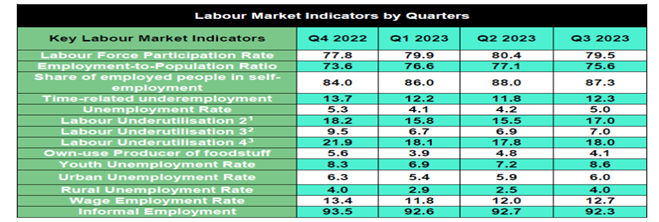
Source: Nigeria Bureau of Statistic (NBS)
However this study tend to examine the effects of population dynamics and price changes on employment rates in Nigeria between the periods of ten years. However, in light of the aforementioned submission, empirical responses to the following research questions is so imperative
- Does Nigerian employment suffer greatly from fluctuations in the consumer price index?
- Does Nigeria’s population expansion impact the country’s employment growth?
- What are the causative effects and the relationship between employment, population dynamics, and the consumer price index in Nigeria overtime?
The remaining part of this study will be structurally design as follows section two provides and expositions on selected related literatures while section three points out on the scientific methodology adopted in analyzing the data’s gathered in the study using the Autoregressive Distributed Lag (ARDL) and the Dynamic Ordinary Least Squares (DOLS) modelling approaches. Section four highlights the conclusive results and outcomes while section five draws on several policies recommendations.
LITERATURES REVIEW
Series of study has analyzed the dynamic relationships between population increase, employment rate and general price increases in Nigeria overtime. The social welfare and the misery index is a crucial indicator of the status of any economy and the well-being of its citizens. Several empirical research has not do a good job of explaining how price change and labor force participation, demographic dynamics impact economic hardship. The majority of the empirical studies that are currently available focus on the relationship between the misery index and economic growth.
Dadgar & Nazari (2018) look at how In terms of the relationship between economic growth and the misery index, Dadgar & Nazari (2018) use vector autoregressive models to analyze the effects of economic growth and governance on the misery index in Iran using time series data spanning the years 1974–2011. The scientists found that the nation’s unhappiness index dramatically decreased as the economy grew. The work of Ubah et al. (2021) on Nigeria, which used the ARDL technique, is consistent with our study. According to reports, the unhappiness index is negatively and statistically significantly impacted by economic growth.
Nwosu, Dike, and Okwara (2014) examined the relationship between population increase and economic growth in Nigeria between 1960 and 2008 using annual time series data. Granger causality testing was employed in conjunction with OLS approaches for this investigation. The two primary variables in the model were the GDP and population growth. Among other things, the researchers found that during the study period, population expansion had a significant impact on economic growth and that there is a long-term, sustainable association between population growth and economic growth.
Likewise, Olabiyi (2014) used the Vector Auto Regressive (VAR) system to examine the impact of population dynamics on Nigerian economy between 1980 and 2010. Child mortality rate, birth rate, trade openness, government spending, actual gross domestic product, and primary school enrollment are the variables of interest. The study was based on annual time series data drawn on variables of interest within the specified timeframe, and the researcher discovered that as fertility rates decreased, economic growth increased; additionally, the researcher discovered a positive relationship between infant mortality rate and economic growth.
Bloom, Canning, and Finlay (2015) used descriptive and inferential statistics and a fixed (dynamic) panel regression model to assess the relationship between aging populations and economic growth in Asia between 1960 and 2014. The research discovered a negative correlation between population aging and economic growth, as well as a positive relationship between economic growth and capital stock, trade openness, and other institutional variables in the regression model.
Adekola, Allen, Olawole, Akanbi, and Adewunmi (2016) investigated whether changing demographics are the main driver of unemployment in Nigeria or if there are other underlying causes at work. Nigeria, China, and the United States were the three positively chosen, heavily populated countries on three continents whose population and unemployment structures were examined. The results show that population increase is not solely driven by demographic expansion; however, in Nigeria, the rate of unemployment is rising along with the population.
Imiosi, Amba, and Okon (2017) use annual secondary data on GDP, unemployment rate, minimum wage, working population, and population from 1980 to 2016 to investigate the impact of unemployment on economic growth in Nigeria using the Ordinary least squares multiple regression empirical approach. The results indicate that while the minimum wage rate has no discernible impact on the nation’s economic development, unemployment, population, and working population all have a large impact.
Enejoh and Tsauni (2018) look at how unemployment and inflation affected Nigeria’s economic growth between 1970 and 2016. Dynamic error correction for the nation was carried out using the ARDL model, which also yielded long and short run coefficients. The results show that whereas unemployment has a long-term negative and insignificant impact on Nigeria’s economy, inflation has a positive but negligible effect on economic growth. Exchange rates have a positive and significant impact on the economy throughout time. The influence of inflation on Nigeria’s economic growth is negligible.
Theoretical Framework
This part, which is broken down into two subsections, describes the process and methods employed in the paper. In the first, data are used, and in the second, an analytical model is estimated using certain assumptions. The World Development Indicators (WDI) and the CBN 2023 Statistical Bulletin provided the data for this research. The sample of data includes the years 1993 through 2023. In order to do the study, annual time series data on price changes were proxied for the price consumer index (PCI), population (POP), jobs (LAB), foreign direct investment (FDI), and tax revenue (TAXREV). Additionally, the natural log of the variables was employed to deflate their enormous magnitude.
Following that, the theoretical framework was Guerrini’s (2006) adaptation of the Solow Swan development model, which was employed in the study. Population growth, saving rates, and technological advancement are all considered exogenous variables in Solow’s model. Two inputs that have previously been compensated for their entire goods are capital and labor. A Cobb-Douglas functional form is taken into consideration to determine the production function at time \( t \):
\[
y(t) = k(t)^\alpha A(t) L(t)^{1-\alpha} \quad 0 < \alpha < 1 \tag{1}
\]
It is expected that the starting points for labor, capital, and innovation will remain unchanged. Both the labor force and technological innovation are growing steadily:
\[
\dot{L}(t) = nL(t) \tag{2}
\]
\[
\dot{A}(t) = gA(t) \tag{3}
\]
A derivative with respect to time is represented by a dot over a variable, where n and g are exogenous parameters. It may be observed that the rates of change of the logs of L and A are constant, equaling n and g, respectively, by attributing equations (4) and (3) to the outcome that a variable’s rate of growth equals the rate of change of its log. As a result,
\[
\ln L(t) = \ln L(0) + nt \tag{5}
\]
\[
\ln A(t) = \ln A(0) + gt \tag{6}
\]
Where \( L(0) \) and \( A(0) \) represent \( L \) and \( A \)’s values at time 0. When we exponent all sides of these equations we obtain:
\[
L(t) = L(0)e^{nt} \tag{7}
\]
\[
A(t) = A(0)e^{gt} \tag{8}
\]
The quantity of labor units that are effective, the model assumes that a constant fraction of output \( s \) is invested. Defining \( k \) as the stock of capital per effective unit of labor \( k/AL \) and \( y \) as the level of output per effective unit of labor \( y = Y / AL \), the evolution of \( k \) is governed by:
\[
\dot{k}(t) = sY(t) – (n + g + \delta)k(t) = sK(t)^\alpha – (n + g + \delta)k(t) \tag{9}
\]
The capital labor ratio in a steady state has a negative relationship with population growth rates and a positive relationship with saving rates. The main prediction of the Solow model is how population growth and saving affect real income. The steady state income per capita can be calculated by taking logs and replacing (9) with the output function (10).
\[
\ln y(t) = \ln A(0) + gt + \frac{\alpha}{1-\alpha} \ln(s) – \frac{\alpha}{1-\alpha} \ln(n + g + \delta) \tag{10}
\]
The model predicts not only the signs but also the magnitudes of the saving and population growth coefficients because it assumes marginal product variables.
RESEARCH METHODOLOGY
The following expression can be used to relate the theoretical model to the research, taking an excerpt from equation (10) above:
PR0D = f (CPI, POP, FDI, TAX REV )…………………. (11)
Where:
PROD= is the labour input or productivity, which is a proxy for jobs creation,
CPI = is the consumer price index, which is a proxy for price increases,
POP= is the population increase,
FDI= is the foreign direct investment and TAXREV is the government tax revenue.
The work of Yelwa, David, and Omoniyi (2015) served as the basis for the model for this investigation in light of the theoretical framework. The authors conducted a study wherein they employed the Philip’s curve to examine the correlation between unemployment, inflation, and economic factors. The inverse relationship between unemployment and inflation is noted by the Philip’s curve.
The definition of the author’s model is as follows:
RGDP = (UNEMP, INTR, GEXP, INF)………………………. … (12)
Where: RGDP is the real gross domestic product, INTR represented the annual rate of interest, GEXP is the Government expenditure overtime, INF is the inflation rate
The current study variables are incorporated into the equation above. The following are the study’s variables:
PROD = f (CPI, POP, FDI,TAXREV ) …………………………………… (13)
Linearly, the model is estimated as:
PRODt = a0 + a1CPIt + a2POPt + a3FDIt + a4TAXREVt +Ut …….. (14)
ESTIMATING TECHNIQUES
The Autoregressive Distributed Lag Model (ARDL) estimate technique, which was introduced by Pesaran, Shin, and Smith (2001), was employed in the investigation. One benefit of the ARDL approach is that it can be applied regardless of the variables’ order of integration as long as none of the variables are integrated of order two, or I (2). Furthermore, even with small observation sizes, the ARDL technique yields consistent estimation and is not affected by endogeneity or serial correlation. Additionally, the method incorporates both the long-run and short-run dynamics estimation into a unified-framework
The above equation is further specified in ARDL for as:
\[
\Delta PRODt = \alpha_0 + \sum_{i=1}^{p} \alpha_1 \Delta PRODt_{-1} + \sum_{i=0}^{p} \alpha_2 \Delta CPIt_{-1} + \sum_{i=0}^{p} \alpha_3 \Delta POPt_{-1} + \sum_{i=0}^{p} \alpha_4 \Delta FDIt_{-1} +\sum_{i=0}^{p} \alpha_5 \Delta TAXREVt_{-1} + \alpha_6 \ln LABt_{-1} + \alpha_7 \ln CPIt_{-1} + \alpha_8 \ln POPt_{-1} + \alpha_9 \ln FDIt_{-1} + \alpha_{10} \ln TAXREVt_{-1} + \epsilon_t \tag{15}
\]
Where: EC-1 is represented by 𝐸𝐶𝑀𝑡−1, represents the rate of adjustment from short-term to long-term equilibrium.The study employed Dynamic Ordinary Least Squares (DOLS) for robustness and sensitivity assessments in addition to the ARDL technique. It has been determined that the DOLS technique is a consistent estimator that accounts for the potential endogeneity and serial correlation problems.
Data Description and Sources
| Variables | Measurement | Description | Sources |
| Price changes | Consumer price index as a percentage of | Proxied as consumer price index | Central Bank of Nigeria (CBN) |
| Labour Force | Labour force as a percentage of GDP | Proxy as employment | WorldBank Development Indicators (WDI). |
| Population Growth | Population growth rate | World Bank Development Indicators (WDI). | Annual growth rate of population |
| Foreign Direct Investment | Net inflow of Foreign Direct Investment | World Bank Development Indicators (WDI). | Net inflow of FDI as percentage of GDP |
| Tax Revenue | Proxied as Government Tax Revenue | Central Bank of Nigeria (CBN) | Government Tax Revenue in Millions. |
EMPIRICAL RESULT AND DISCUSSIONS
The empirical results are displayed in Tables 1 below as well. They include descriptive statistics, correlation analysis outcomes, unit root test findings, ARDL Bounds cointegration test results, the short run and long run ARDL findings, and DOLS, diagnostic or post estimating test results.
Descriptive Statistics
Table 2: Descriptive Statistics of the Variables
| Variables | Mean | Median | Std. Dev. | Skewness | Kurtosis | Jarque-Bera | Prob | Obs |
| CPI | 58.2068 | 28.6411 | 68.378 | 1.16938 | 3.270495 | 9.238419 | 0.009861 | 30 |
| FDI | 1.48405 | 1.12923 | 1.2899 | 1.40352 | 5.735264 | 25.60195 | 0.000003 | 30 |
| LAB | 0.04047 | 0.03444 | 0.0283 | 0.93044 | 3.397752 | 6.035173 | 0.048919 | 30 |
| PROD | 35.7796 | 34.572 | 8.4740 | 0.14516 | 1.863408 | 2.293561 | 0.317658 | 30 |
| TAXREV | 22.9192 | 49.465 | 40.1350 | 2.4.0787 | 8.610761 | 91.12027 | 0. | 30 |
Source: Author`s computation (2024)
The median value of 28, 6 percent is less than the average mean of price changes as measured by the consumer price index (CPI), which is 58.2 percent in table 4.1. This indicates that the economy’s average annual rate of price increases is 58.2 percent, which is a very high rate. In a similar vein, the median value of 1.12 percent and the average mean of 1.48 percent for foreign direct investment indicate that foreign direct investment in Nigeria is growing at an annual rate of 1.48 percent.
Furthermore, compared to the median estimate of 3.4 percent, the average mean for labor input-based jobs is higher at 4.0 percent. This indicates that the pace of increase in employment in Nigeria is 4.0 percent every year. Moreover, the median population number of 34.5 is 35% lower than the average population mean, indicating that Nigeria’s population is expanding at an above- rate on average of 35.7%. In a similar vein, real tax revenue is lower than average at 22.9 percent compared to 49.4 percent. This indicates that compared to the high costs of products and services in the economy, the government’s rate of revenue generation is low The model is sound since all of the variables’ standard deviation values are greater than 1.0, with the exception of jobs that are proxied by the labor force. Moreover, all variables have a Jarque-Bera figure bigger than one, meaning that their distribution levels are equal to zero but greater than one, although the probability value is less than one. In a similar vein, the results for skewness and kurtosis demonstrate that every variable has skewness and kurtosis that can be derived from a normal curve, indicating that, aside from price adjustments, which are represented by the consumer price index, foreign direct investment, and taxes, a normal distribution should have skewness of zero or very near zero.
This section presents the results of the unit root test on the variables. The first step is to diagnose the stationary state of the variables in order to select the optimal test and estimation model.
Unit Root Test
The Augmented Dickey-Fuller (ADF) and Phillips-Perron unit root tests were performed to ascertain the stationarity status in order to establish the order of integration of the variables used for analysis in the study. The below table presents the findings.
Table 3: Unit Root Test (Augmented Dickey Fuller Test)
| Variables | Level | First Difference | ||||||
| ADF Static | 1% | 5% | Level of Integration | ADF Static | 1% | 5% | Level of Integration | |
| PROD | -1.1182 | -3.6104 | -2.9389 | I(0) | -6.1348*** | -3.6155 | -2.9411 | I(1) |
| CIP | -1.5490 | -3.6267 | -2.9458 | I (0) | -4.2532** | -3.6329 | -2.9484 | I(1) |
| FDI | -4.1932*** | -3.6104 | -2.9389 | I(0) | -8.1947*** | -3.6155 | -2.9411 | I(1) |
| POP | -1.6021 | -3.6155 | -2.9411 | I(0) | -4.8490** | -3.6155 | -2.9411 | I(1) |
| TAXREV | -1.7363 | -3.6210 | -2.9434 | I(0) | -5.9128*** | -3.6210 | -2.9434 | I(1) |
Note: *** significant at 1%, ** significant at 5%, * significant at 10%, Mackinnon
Source: Computed by Author
Only foreign direct investment is found to be stationary at the level by the Augmented Dickey Fuller (ADF) test results. At the 5% level of significance, jobs proxy by labor input (productivity), price changes proxy by the consumer price index, population growth, and tax revenue are found to be non-stationary at the level, indicating the existence of a unit root. However, for 1 percent relevant levels after first differencing, it is acknowledged that foreign direct investment, salaries proxied by labor input, price movement’s proxy by consumer price index, population growth, and tax revenue are all stationary at first difference. As a result, the combined series of the model have no unit-root at first difference, indicating that they are mean-reverting and will eventually converge to their long-run equilibrium.
Estimation Techniques
The Autoregressive Distributive Lag (ARDL) bound testing model is applied in this investigation. This is because, irrespective of whether the variables are fixed at the level or at the first difference, it focuses on the short- and long-term relationships between price rises, population dynamics, and jobs.
Table 4: ARDL Bounds Test; Null Hypothesis: No long-run relationship exits
| Test Statistic | Value | k |
| F-statistic | 0.815259 | 4 |
| Critical Value Bounds | ||
| Significance | I(0) Bound | I(1) Bound |
| 10% | 2.45 | 3.52 |
| 5% | 2.86 | 4.01 |
| 2.5% | 3.25 | 4.49 |
| 1% | 3.74 | 5.06 |
Source: Author’s Computation
The above bound testing result indicates that there is no long-run equilibrium relationship between price shifts, population dynamics, and jobs in Nigeria because the F-Statistic is smaller than the I(0) and I (1) bounds. In this instance, the methodology will estimate the short- and long-run significance using autoregressive distributive lag.
Autoregressive distributive lagged (ardl) co-integration analysis
Table 5: Autoregressive Distributive Lagged (ARDL) Estimation Dependent Variable: Gross Domestic Product (GDP)
|
Short-Run Co-efficient |
||||
| Variable | Coefficient | Std. Error | t-Statistic | Prob. |
| D(CPI) | 0.240030 | 0.03249 | 0.335603 | 0.7394 |
| D(POP) | -0.000752 | 0.00070 | -1.068847 | 0.2931 |
| D(FDI) | 0.004008 | 0.00185 | 2.166600 | 0.0378 |
| D(TAXREV) | 0.001013 | 0.00311 | 0.014572 | 0.9885 |
| CointEq(-1) | -0.306953 | 0.11687 | -2.626296 | 0.0131 |
| Long-Run Co-efficient | ||||
| Variable | Coefficient | Std. Error | t-Statistic | Prob. |
| CPI | 0.23009 | 0.11030 | 0.32134 | 0.7500 |
| POP | -0.00245 | 0.00255 | -0.95858 | 0.3450 |
| FDI | 0.01305 | 0.00635 | 2.05381 | 0.0482 |
| TAXREV | 0.00230 | 0.00302 | 2.23348 | 0.0326 |
| C | 0.09297 | 0.06959 | 1.33594 | 0.1910 |
Source: Author’s Computation
The above bound testing result indicates that there is no long-run equilibrium relationship between price shifts, population dynamics, and jobs in Nigeria because the F-Statistic is smaller than the I(0) and I(1) bounds. In this instance, the methodology will estimate the short- and long-run significance using autoregressive distributive lag
Additionally, price changes as measured by the consumer pricing index have a positive but insignificant effect on jobs over the long term. This suggests that a percent increase in price changes as measured by the consumer price index would result in a 23.0% gain in employment, which is a percent difference from the short-run outcome. Conversely, population has a negative and insignificant effect on jobs over the long run; that is, a 1% change in population results in a 0.07 percent and 0.2 percent decrease in employment, respectively
This means that when the unemployment rate falls, the economy will employ fewer people. In addition, foreign direct investment raises wages in a definite and significant way; a one percent increase in foreign investment increases employment by 0.4 and 1.3 percent, respectively. This means that when money enters the nation through foreign direct investment, the net inflow will go toward the real or manufacturing sectors, where the production of good requires hiring workers.
In addition, even though government tax income is marginally lower in both scenarios, tax revenue does have a positive influence on jobs over the long term; however, this benefit is greater in the long run. Ultimately, the co-integration equation of the error correction model is negative and significant, indicating a slower than average rate of transition from short-term disequilibrium to long-term equilibrium. Furthermore, the outcome shows that in one cycle, about 30.6% of the departure from equilibrium was corrected.
Post Estimation Results
To make sure the outcome was robust, additional stability and diagnostic testing was conducted.
Table 6: below lists and discusses the consistency and diagnostic tests.
| Heteroskedasticity Test (Breusch-Pagan Godfrey Test) | |||
| F-statistic | 2.00088 | Prob. F (7, 31) | 0.1870 |
| Obs* R-squared | 12.1370 | Prob. Chi-
Squared (7) |
0.2961 |
| Scaled explained SS | 25.6492 | Prob. Chi- Squared (7) | 0.0236 |
| Breusch-Godfrey Serial Correlation LM Test | |||
| F-statistic | 0.02175 | Prob. F (2, 29) | 0.9785 |
| Obs* R-squared | 0.05841 | Prob. Chi- Squared (2) | 0.9712 |
| Pair Granger Causality Test | |||
| Null Hypothesis | Obs | F-statistic | Prob. |
| LAB does not Granger cause CPI
CPI does not Granger cause LAB |
30 | 0.3708
1.5198 |
0.6930
0.2337 |
| POP does not Granger cause CPI
CPI does not Granger cause POP |
30 | 3.9669
7.1643 |
0.0286
0.0026 |
| POP does not Granger cause LAB
LAB does not Granger cause POP |
30 | 4.1732
0.1002 |
0.0242
0.9049 |
Source: Author’s Computation
Since the corresponding p-values for the chi-square and F-statistics are both > 0.05 and 0.1870, respectively, we cannot rule out the null hypothesis. Consequently, we evaluate the null hypothesis against the alternative hypothesis and come to the conclusion that the residual is homoscedastic. Furthermore, the null hypothesis, which asserts that there is no heterokedasticity, should not be disregarded because both probability (Chi-square) and likelihood (F-statistic) are 0.
The null hypothesis that the residuals generated by the autoregressive model do not exhibit autocorrelation is accepted when the Breusch-Godfrey Correlation Lagrange Multiplier test produces significant probability values of 0.9785 and 0.9712 for F-statistics and observed R-Squared, respectively. Because the estimated series has serial correlation, we may thus conclude that the test is true.
Table 6: Additionally demonstrates the lack of a causal relationship between price rises as indicated by the consumer price index and employment as determined by labor input. On the other side, bidirectional causation suggests that as the population expands, so will the price of products and services. Bidirectional causality goes from market growth to population increases. Additionally, as indicated by labor input, the results demonstrate a unidirectional causal relationship between jobs and population, suggesting that employment cannot cause population growth but can only be triggered by it. This suggests that when people are sufficiently engaged, the rate of population declines.
FINDINGS DISCUSSION
The empirical results of the study verified that, for a 5% level of significance, only foreign direct investment is stationary at level in the Augmented Dickey Fuller (ADF) test. In contrast, employment, as measured by labor input (productivity), price changes, as measured by the consumer price index, population growth, and tax revenue are not stationary at level, suggesting the existence of a unit root. Following the initial difference, all of the relevant variables—including the control variables—were stagnant at 1% significant levels. The combined series of the model are therefore mean reverting and will eventually find their long-run equilibrium since they do not have a unit-root at first difference.
Similarly, bound testing results demonstrate that price changes, population dynamics, and employment in Nigeria do not exhibit a long-run equilibrium relationship, suggesting that autoregressive distributive lag analysis can be used to quantify both short- and long-run importance.
The ARDL outcome demonstrates that changes in prices as measured by the consumer price index have a positive, albeit small, impact on employment over the short and long terms. This indicates that although there will be no appreciable impact on employment, a 4% increase in the consumer price index will result in an increase of 24.0 and 23.0% in jobs, respectively. Similarly, population changes have a negative and insignificant effect on employment over the long run; that is, for every percent change in population, employment decreases by 0.07 and 0.2 percent, respectively. This implies that the likelihood of unemployment will increase in the economy as the population’s employment rate declines. Furthermore, an increase in foreign direct investment increases employment by 0.4 and 1.3 percent, respectively, demonstrating the beneficial and significant impact that this policy has on jobs over the long run. More precisely, tax revenue increases employment both temporarily and permanently, while its effects are greater over the long run.
Despite the fact that tax collection for the government is marginally less in both cases. The coefficient’s negative and significant co-integration indicates how quickly the short-run disequilibrium adjusted to the long-run equilibrium, or that around thirty.6% of the equilibrium deviance was rectified in a single period. Granger causality provided proof that there is a bidirectional causal relationship between price changes and population growth, meaning that rising rates of population will result in rising costs for goods and services. However, there is no direct relationship between price changes, as measured by the consumer price index, and employment, as measured by labor input.
CONCLUSION AND POLICY RECOMMENDATIONS
This study investigates the impact of population dynamics and price changes on jobs in Nigeria from 1993 to 2023. It is commonly believed that population growth and price fluctuations are the primary forces that attract or repel people in Nigeria, and the government is creating and enforcing legislation that can contribute to the creation of more jobs in the area. However, because of an increase in the consumer price index, which is connected to changes in economic prices, tax money has not been very helpful in creating jobs in Nigeria.
The outcome further demonstrates the absence of heteroscedasticity and autocorrelation in the model. Ultimately, the results of the Granger causality test show that there is no causal relationship between changes in prices as indicated by the consumer price index and jobs as determined by labor input. With the following recommendations solely based on the findings
Governments at all levels should invest in physical capital, promote greater labor market participation, and keep the economy growing as a result of the results’ policy implications. Furthermore, the strategy on girl-child education should be used to control the high rate of fertility.
Policies aimed at slowing population growth will assist the government control the labor supply and cut unemployment rates.
- To help the unemployed find work, the government should support industrialization initiatives and the influx of foreign direct investment into the nation.
- The Nigerian government ought to make greater investments in infrastructure as well, since this will create the necessary favorable conditions for a range of economic endeavors. In a similar vein, more effort may be made by the public and private sectors to fund initiatives that promote education and skill development. By doing this, labor efficiency would rise, which would boost productivity.
The government needs to enact more economically beneficial policies in order to attract more both domestic and foreign investment. This would significantly boost employment opportunities and boost productivity. It is also necessary to develop policies that directly lower fertility rates, and to make efforts to assure their enforcement concurrently.
REFERENCES
- Abaidoo, (2012). Corporate profit growth and variability in US unemployment rate. International Journal of Economics and Finance, 4(7), 3.
- Adekola, O., Allen, A.A., Olawole-Isaac, A., Akanbi, M.A. & Adewumi, O. (2016) Unemployment in Nigeria; A Challenge of Demographic Change? International Journal of Scientific Research in Multidisciplinary Studies 2(5): 1-9.
- Adewole, O. (2012). Effect of population on economic development in Nigeria: A quantitative assessment. International Journal of Physical and Social Sciences, 2(5), 1-14.
- Aidi, H., O., Emecheta, C. & Ngwudiobu, I., M. (2016). Population and economic growth in Nigeria: Is there an empirical evidence of causality? International Journal of Advances in Social Science and Humanities, 4(2), 59-66.
- Ajakaiye, , Jerome, A. T., Nabena, D., & Alaba, O. A. (2015). Understanding the relationship between growth and employment in Nigeria (No. 2015/124). WIDER Working Paper.
- Akintunde, T. S., Olomola, P. A. & Oladeji, S. I. (2015). Population dynamics and economic Journal of Economics and Sustainable Development, 4(13), 148-157.
- Aminu, I., & Peterside, Z. B. (2010). The impact of privatization of power sector in Nigeria: a political economy approach. Mediterranean Journal of Social Sciences, 5(26),
- Asif, K. (2013). Factors Effecting Unemployment: A Cross Country Analysis. International Journal of Academic Research in Business and Social Sciences, 3(1),
- Banda, , Ngirande, H., & Hogwe, F. (2016). The impact of economic growth on unemployment in South Africa: 1994-2012. Investment Management & Financial Innovations, 13(2), 246.
- Banerjee, , Galiani, S., Levinsohn, J., McLaren, Z., & Woolard, I. (2008). Why has unemployment risen in the new South Africa? 1. Economics of Transition, 16(4), 715-740.
- Barro, R. J. (2001). Human Capital and Growth. The American Economic Review,91(2), 12-17.
- Bhalli, N., Muhammad, S.M. & Tahir, M.A (2013), Determinants of Unemployment: Empirical Evidences from Pakistan, Pakistan Economic and Social Review 51(2): 191-207
- Bloom, D. E., Cannning, D. & Finlay, J. E. (2015). Population aging and economic growth in National Bureau of Economic Research, 19, 61-89.
- Bucci, (2003). R&D, imperfect competition and growth with human capital accumulation. Scottish Journal of Political Economy, 50(4), 417-439.
- Coale, A. J., & Hoover, E. M. (1958). Population growth and economic development in low- income countries: Economic Policy Working Paper No. 1502. Washington, DC:
- Olujobi O.M & Afolabi O.A (2024), Impact of Small Scale Enterprises on Microeconomics Performances of Edo state “Confluence Journal of Economics and Allied Sciences (CJEAS) Volume , Number 2 Pp 164-179, ISSN: 2437-1661