
Relationship between Student Attitudes and Student Achievement in Chemistry Subject Area of Science
- B. Siri Sumedha Thero
- K.S.H.M.V.W.W. Senevirathne
- 227-240
- Jul 27, 2024
- Education
Relationship between Student Attitudes and Student Achievement in Chemistry Subject Area of Science
B. Siri Sumedha Thero1*, K.S.H.M.V.W.W. Senevirathne2
1Piriven Education Branch, Ministry of Education, Isurupaya, Baththaramulla, Sri Lanka.
2Department of Education, Faculty of Arts, University of Peradeniya, Peradenya, Sri Lanka.
*Corresponding Author
DOI: https://dx.doi.org/10.47772/IJRISS.2024.807019
Received: 22 January 2024; Received: 02 February 2024; Accepted: 07 February 2024; Published: 27 July 2024
ABSTRACT
Identifying the problems faced by students is essential in building science education. Through the analysis of the results of the Sri Lanka Examination Department, it is clear that the science subject as a whole gets the minimum number of marks compared to other subjects. Therefore, it was a major requirement of this research to find out the multivariate correlation and effect between students’ attitude towards the subject of chemistry and student achievement. For that, research was carried out through a quantitative design. 111 teachers and 302 students from 13 secondary schools in Kegalle Education Zone, Kegalle District, Sri Lanka were selected as the sample. Cluster random sampling method was chosen as the sampling method. A pilot test was conducted for a validation test based on the research instrument and Bloom’s taxonomy. In addition, a confirmatory factor analysis (CFA) was also conducted to further confirm the validity of the identified research instrument for measuring students’ attitude towards the subject. An exploratory data analysis (EDA) was first conducted to validate the data collected. Then, data analysis related to the main study was conducted using descriptive and inferential statistical methods. It was identified that there is a positive correlation between attitude towards the subject and student achievement in answering the research questions related to the research.
Keywords: Attitude of the subject, Student achievement, Chemistry, G.C.E (O/L) examination
INTRODUCTION
The Sri Lanka Examination Department releases performance reports of candidates who took the General Certificate of Education examination each year. These reports show that the passing percentages in English, Mathematics, and Science are relatively low when compared to other major subjects. The table 1 below provides a clear identification of such. The analysis of the performance records for the academic years 2018, 2019, 2020, and 2021 further reveals that, after English, the scientific subject has the lowest pass percentage.
Table 1. G.C.E (O/L) Pass percentage of compulsory subjects of the examination: (2018 -2021)
| Subject | Pass percentage | |||
| 2018 (%) | 2019 (%) | 2020 (%) | 2021(%) | |
| Buddhism | 87.8 | 89.32 | 89.31 | 85.56 |
| Sinhala | 91.3 | 91.4 | 91.3 | 89.15 |
| English | 54.9 | 62.36 | 65.78 | 72.86 |
| Mathematic | 68.3 | 71.08 | 70.52 | 70.03 |
| Science | 69.83 | 65.45 | 69.07 | 70.84 |
| History | 83.18 | 83.51 | 84.36 | 80.64 |
According to the Table 2 below, a further examination of the performance reports shows that the percentage of A and B passes for the science subject has taken a minimum value in relation to other compulsory subjects within three consecutive years.
Table 2. G.C.E (O/L) Percentage of A and B passes in the compulsory subjects of the examination
| Subject | 2019 | 2020 | 2021 | |||
| A | B | A | B | A | B | |
| Buddhism | 34.77 | 17.24 | 34.01 | 16.3 | 32.83 | 16.21 |
| Sinhala | 20.11 | 20.46 | 20.08 | 18.66 | 20.04 | 17.68 |
| English | 10.58 | 8.48 | 10.77 | 8.77 | 12.8 | 9.48 |
| Mathematic | 19.3 | 10.72 | 20.74 | 9.6 | 19.72 | 9.73 |
| History | 18.06 | 12.56 | 19.51 | 12.71 | 16.8 | 10.47 |
| Science | 8.28 | 7.38 | 11.58 | 8.81 | 10.9 | 8.26 |
According to the General Certificate of Education General Certificate evaluation reports issued by the examination department in the years 2017 and 2018, in providing answers for the first paper of the science subject, the ease of providing answers related to the field of chemistry has taken the values of 44% and 43%. It is clear from Figure 1. and 2. below.
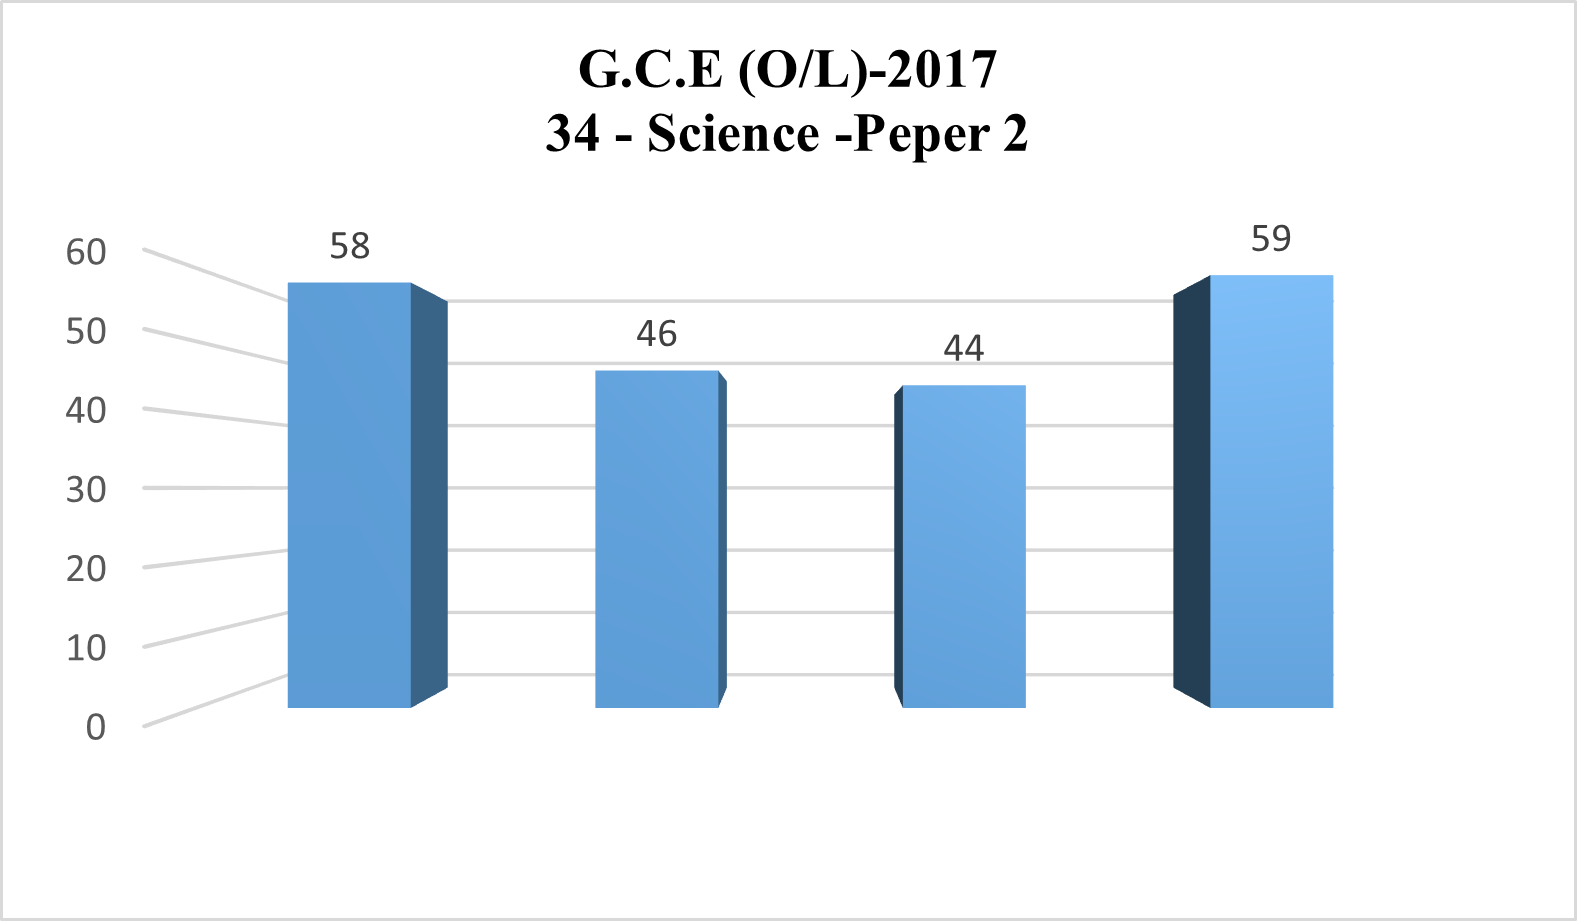
Figure 1. Convenience in each subject area
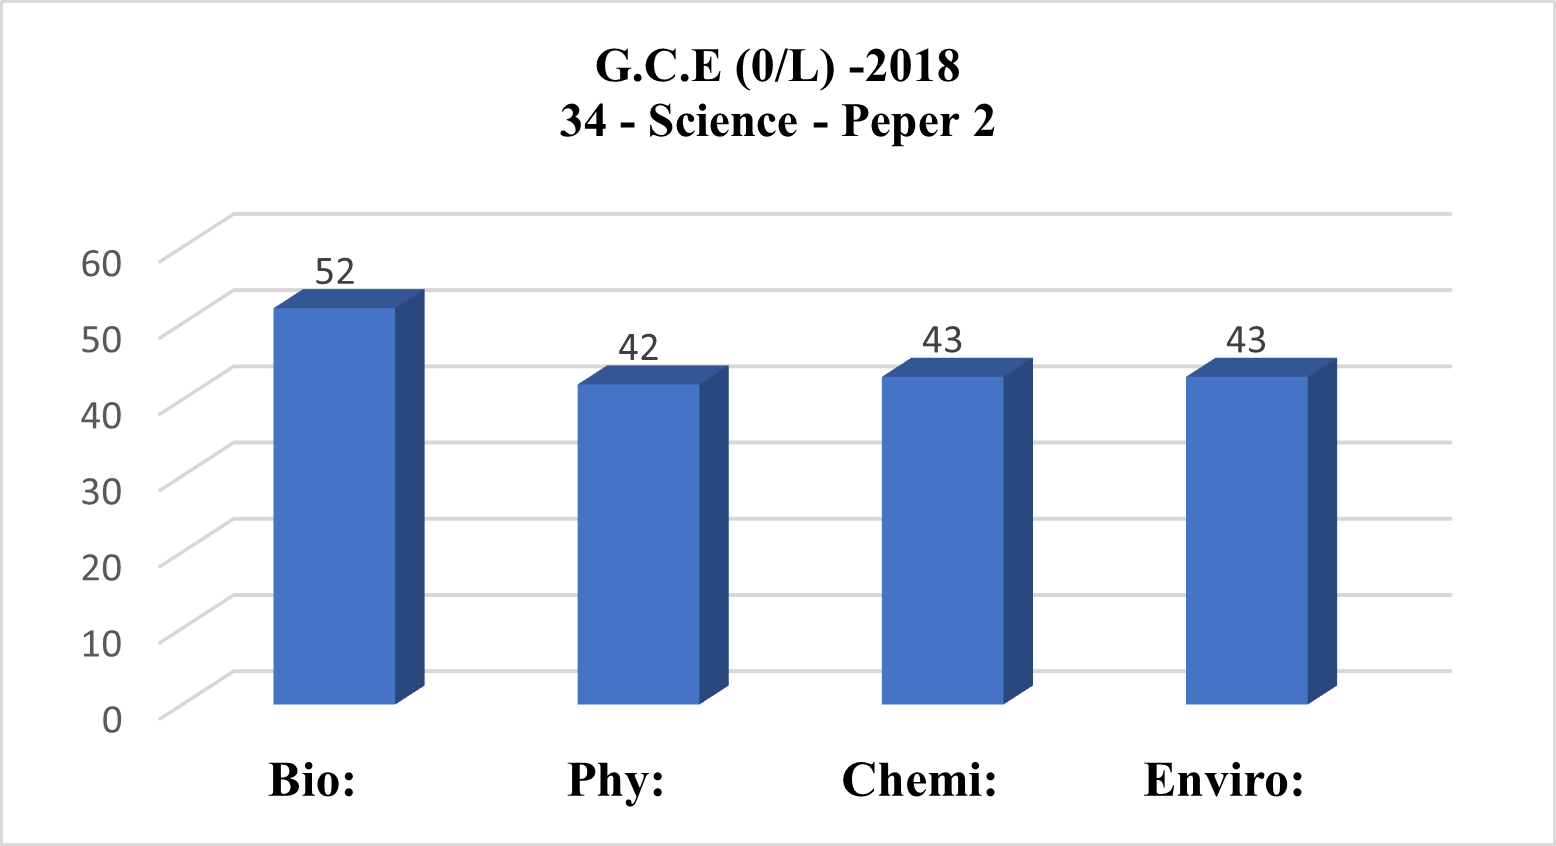
Figure t 2. Convenience in each subject area
According to the examination department’s 2017 academic general certificate general level evaluation report, among the nine questions given for the second paper of the science subject, the sixth question is entirely from the field of chemistry, and from the two parts a and b of the ninth question, part a is from chemistry questions. Section A and B will also have physics questions. Among the nine questions related to paper two, the percentage values of the students’ choice of questions are shown in Figure 3. below. It will be clear that questions six and nine, which had more weightage for chemistry, the percentage of students choosing is lower compared to choosing other questions.
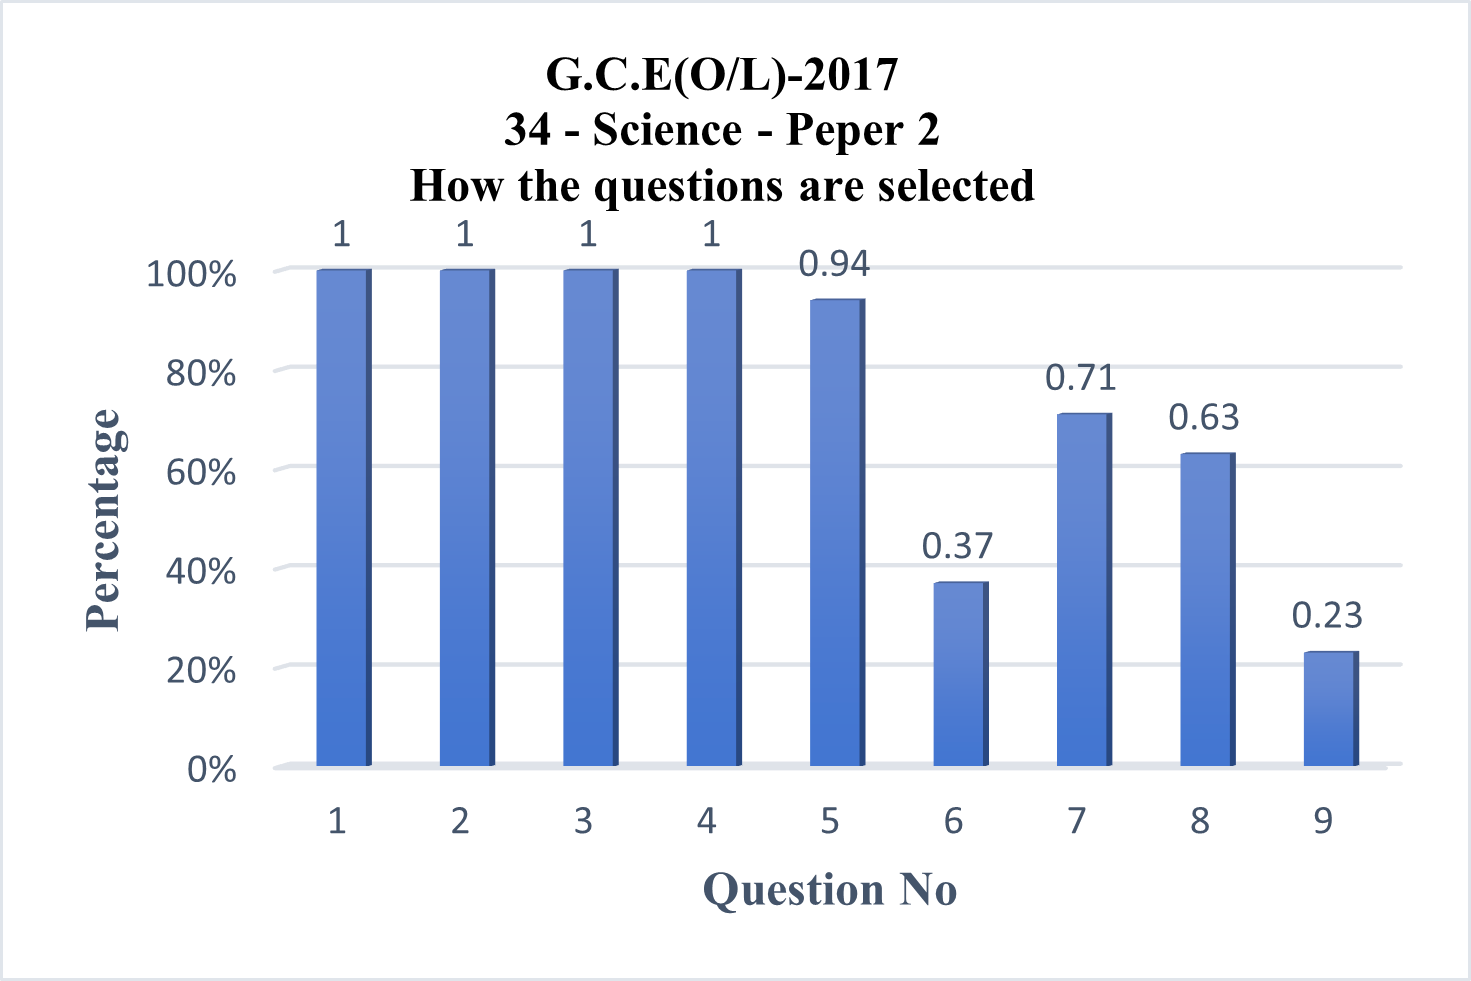
Figure 3. How Questions are Selected in Paper 2 – 2017
Also, the way the questions have been selected in relation to paper two of the science subject in the year 2018 is clearly shown in the graph 4. below. The questions have been weighted so that the third and sixth questions are 100% under the field of chemistry, and among the two parts a and b of the ninth question, part a is under the field of chemistry. The third question is a compulsory question which is chosen by 99% candidates. Only 4% have scored more than 12 points. 43% of the candidates scored three marks or less. Only 8% scored 16 or more out of 20 for the sixth question. 62% have scored less than five points. 20% candidates have selected the ninth question. Out of that, 53% scored less than five marks. Only 13% percentage of more than 16 points have been obtained.
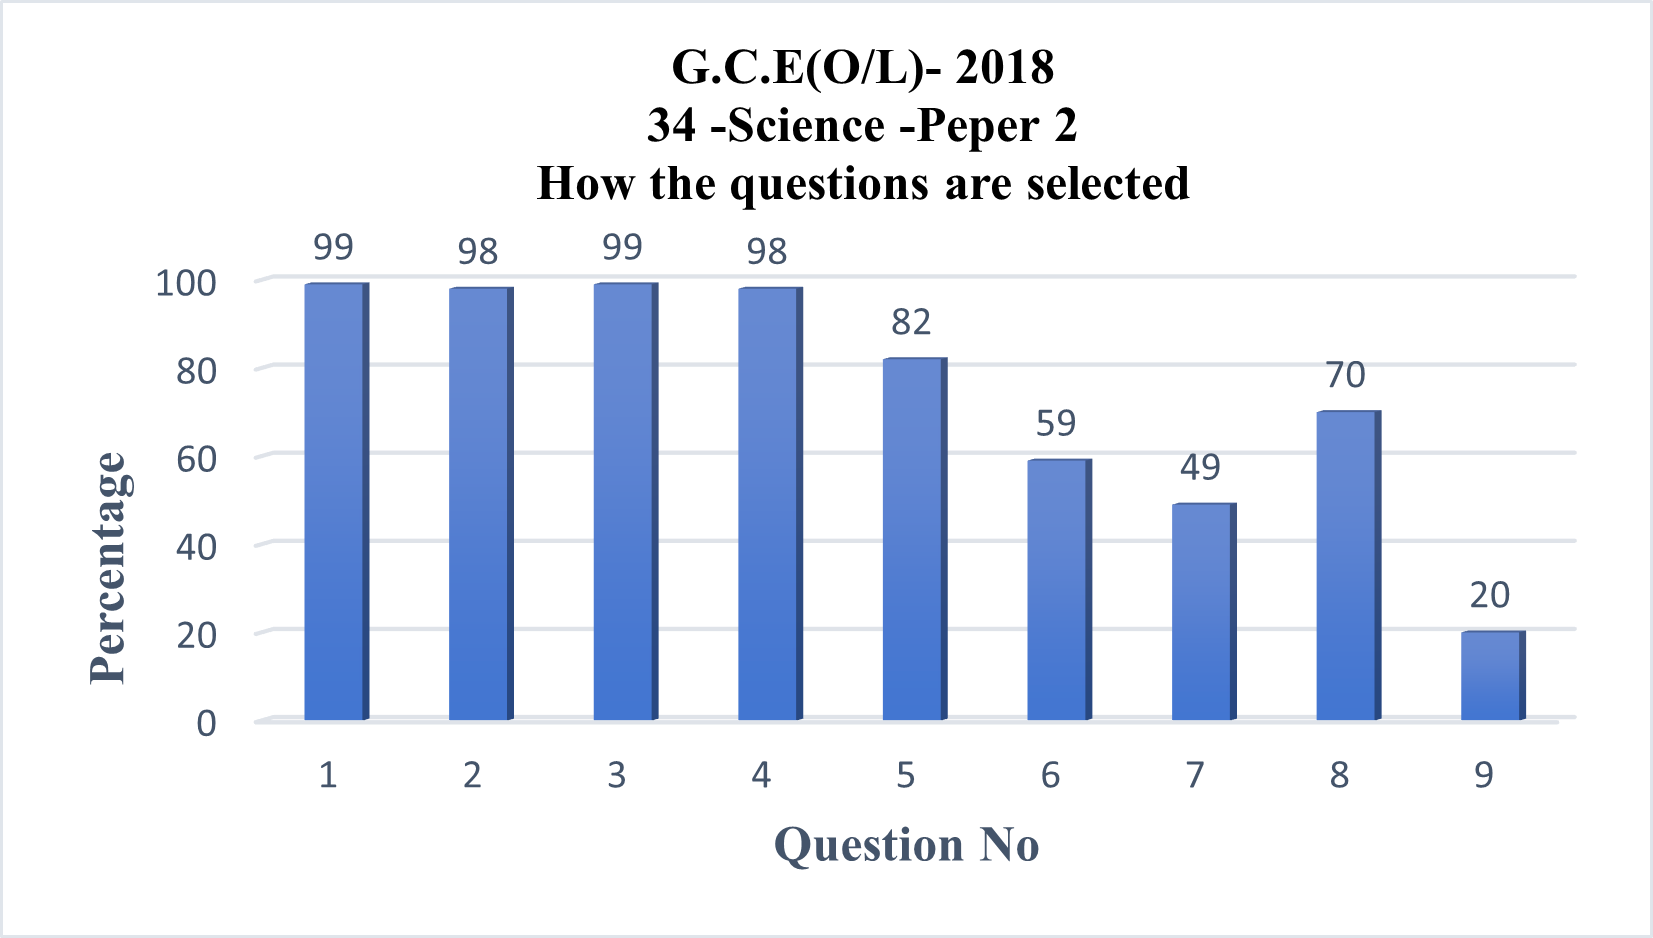
Figure 4. How Questions are Selected in Paper 2 – 2018
According to the above analysis, it appears that the facility for the field of chemistry is the least compared to other fields. With the beginning of secondary education, science has been included in the curriculum as a compulsory subject from grade six to grade 11. The number of periods given for the subject of Mathematics and Science is also higher compared to other subjects. However, at the end of 11 years of learning and teaching process, as mentioned above, by observing the analysis reports of the results of the general certificate examination, it appears that the achievement of the science subject is at a minimum level relative to other subjects. Out of that, it is clearly seen from the evaluation reports that the responses given by the students to the field of chemistry in the science subject are minimal.
It is clear from the above analysis recorded information that students do not understand chemistry concepts better. In addition to intelligence, various factors affect students’ achievement in chemistry (Wijesekara, 1997). Among those various factors, the attitude towards the subject of chemistry was taken as the independent variable and student performance as the dependent variable and hypotheses were formed. Thus, what is the correlation between attitude towards the subject of chemistry and student achievement? This research was carried out to find solutions to the problem.
RESEARCH METHODOLOGY
The broad purpose of this research was to conduct a study using a quantitative research design to measure the relationship between students’ attitude towards the subject and student achievement in the field of chemistry included in the science subject. For that, the philosophical course of the research was identified by the research onion diagram (Raithatha, 2017). After identifying the size of the sample, 302 students were selected from 13 schools of different types (1AB, 1 C, type 2, Piriven Vidyayatana) in the four education divisions of Kegalle, Galigamuwa, Dadigama, Warakapola in the Kegalle Education Zone of Kegalle District, Sri Lanka through the cluster random sampling method.There were 30 questionnaire items identified by foreign research literature. A pilot study was also conducted to check the reliability of the research instrument. The comparison of Cronbach’s alpha value related to the pilot study and the main study is shown in the following table.
Table 3. Comparison of Cronbach’s Alpha value between pilot and main studies
| (Scale) | Pilot test | Real test | ||||
| Items | Cronbach’s Alpha | Cronbach’s Alpha Based on Standardized Item | Items | Cronbach’s Alpha | Cronbach’s Alpha Based on Standardized Item | |
| *SPQ | 30 | 0.764 | 0.794 | 30 | 0.793 | 0.806 |
*Questionnaire to measure attitude towards the subject
According to pilot and main studies, it is clear that the research instrument has an excellent level of consistency (Pallant, 2013). In addition, a factor analysis was also conducted using the hypothesis called principal component analysis to identify the validity of the research instrument. KMO and Bartlett’s test was done for that. The results of the analysis were as follows.
Table 4. Determining the validity of the research instrument
| Variable | No of item | KMO value | Bartlett’s significant |
| SAQ | 30 | 0.750 | 0.000 |
Additionally, a confirmatory factor analysis (CFA) was conducted with respect to the research instrument. Here, all the questions in the questionnaire were prepared as a category name (Compute Variable) and the measurement model was prepared. The categories were separated according to the characteristics of each question. Likeness for chemistry (SAQ1LIK), Emotional climate of the chemistry classroom (SAQ1EMO), Chemistry curriculum (SAQ1CUR), Chemistry teacher (SAQ1TEA), Physical environment of the chemistry classroom/laboratory (SAQ1PHY), Friends’ attitude towards chemistry (SAQ1FRE), The categories were named Achievement motivation (SAQ1ACH), Anxiety, Chemistry self-concept (SAQ1ANX). Accordingly, the initial measurement model can be presented as follows.
Measurement model
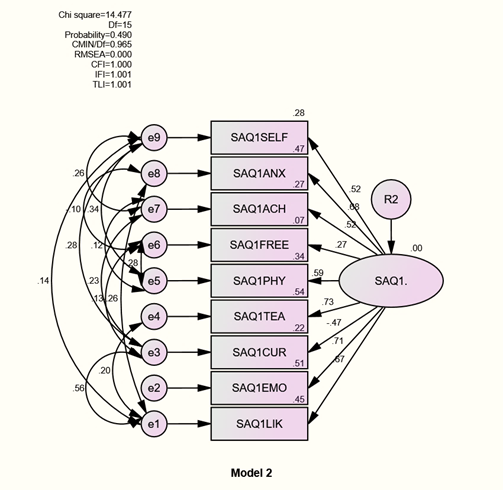
Figure 5. Initial measurement model of the research instrument concerned with measuring the attitude towards the subject
As shown in Figure 5. above, all the questions in the questionnaire designed to measure the students’ attitude towards the subject were grouped into nine categories. In relation to those categories, the accuracy of the initial measurement model (Model testing) was tested. The measurement scales obtained for the test carried out are clearly indicated by Table 5.
Table 5. Model fit indices of the measurement model
| Category | Goodness of fit index | Observed Value | Threshold | Decision |
| Absolute fit Indicates | P | 0.490 | > 0.05 | Satisfied |
| CMIN/DF | 0.965 | < 3 good | Satisfied | |
| GFI | 0.989 | > 0.9 good
> 0.8 Acceptable |
Satisfied | |
| RMESA | 0.000 | < 0.1 | Satisfied | |
| RMR | 0.011 | < 0.1 | Satisfied | |
| Hoelter’s CN (.05) | 520 | > 200 | Satisfied | |
| Incremental fit indices | TLI | 1.001 | > 0.9 | Satisfied |
| CFI | 1.000 | > 09 | Satisfied | |
| RFI | 0.961 | > 0.9 | Satisfied | |
| NIF | 0.984 | > 0.9 | Satisfied | |
| Parsimony fit indices | PRATIO | 0.817 | > 0.8 | Satisfied |
| PNFI | 0.810 | > 0.8 | Satisfied | |
| PCFI | 0.817 | > 0.8 | Satisfied |
According to Table 5 CMIN/DF value shows a value of 0.965 (CMIN/DF=0.965). The value of GFI (Goodness of fit index) is high at 0.989 (GFI=0.989). The value of RMESA is at a level of 0.000 and the requirement of being less than the level of 0.1 that should be present in an appropriate measurement model is fulfilled (RMESA=0.000). The RMR value is also at a level of 0.011 (RMR=0.011). Also, Hoelter’s CN value of 520 has fulfilled the requirement of being above 200. Accordingly, the research instrument designed to measure the attitude of the students towards the subject could be recognized as an instrument of optimum level and quality. Also, the absolute fit indicates that the research instrument should have completeness. In addition, TLI, CFI, RFI, NIF values have taken the optimal value levels of 1.001, 1.000, 0.961, 0.984 respectively (TLI=1.001, CFI=1.000, RFI=0.961, NFI=0.984). Also, the value of PRATIO, PNFI, PCFI all took a high value close to the level of 0.8 (PRATIO = 0.817, PNFI = 0.810, PCFI = 0.817). Accordingly, it will be clear that the measurement model of the research instrument used to measure the students’ attitude towards the subject is at an acceptable and optimal level. Meanwhile, the following tests were also carried out to further confirm that the research instrument is a valid research instrument.
Validation of the measurement Model
The results of the convergent validity test carried out to evaluate the validity of the measurement model were clearly shown in Table 6 below.
Table 6. Convergent validity measures
| Construct | No of Items | Standardized factor loding (>0.7) | Average variance exacted (AVE) (>0.6) | Composite Reliability (CR) (>0.7) | Squaroot of AVE |
| SAQ1 | 9 | 0.784-0.910 | 0.710 | 0.924 | 0.852 |
According to the table number 6 above, it will be clear that the minimum value of Standardized factor loading is 0.784, AVE value is 0.710, and CR value is 0.924. Also, Haya Atal points out that the AVE square root value should be higher than the Inter construct Correlation value, and it will be clear that this requirement has also been fulfilled here. According to the information analyzed above, it was possible to confirm in the present study that the research instrument identified by the foreign research literature is suitable for measuring the students’ attitude towards the subject. In addition to this, it was also possible to identify that the (Squaroot of AVE) value related to completeness of discriminant validity is at an optimal level (Squaroot of AVE=0.852).
Software (IBM SPSS AMOS version 24 and IBM SPSS statistic version 25) was used for all these analysis tasks. Before administering the research instrument to the sample, it was translated and modified to suit the current research. Also, the prepared research instrument was referred to three subject experts and further content validity and face validity were checked.
In particular, an exploratory data analysis (EDA) was also conducted for the data collected related to the attitude of students towards the subject of chemistry as independent variables for general assumptions of statistical methods. For that, at first three fellow researchers were contacted to check whether there were any deficiencies and errors in entering the data set into the SPSS data system. Then, the tests of Outliers, Multicollinearity, Normality, Linearity and Homoscedasticity of the data set should be done primarily to find Pearson’s Correlation as parametric statistical data (Kline, 2011; Hair, Black, Babin, & Anderson, 2009; George & Mallery, 2006). Here, the researcher conducted Outliers, Multicollinearity, Normality, Linearity and Homoscedasticity tests using IBM SPSS Statistics 25 software. Normal Q-Q plot tests were performed to detect the normality of data distribution. Univariate outliers of each variable were detected using stem and leaf diagrams. Tolerance value > 0.10 (Should be > 0.10) and VIF value < 10 (Should be < 10) were maintained while performing multicollinearity tests. Bivariate Scatter Plots and R values were used for linearity and homoscedasticity tests. This identified the data collected by the research instrument as consistent with the basic hypotheses. Below are some data distribution representations related to the checks performed to determine the correctness of the data.
In addition to this, a chemistry question paper was prepared using a special table prepared according to Bloom’s taxonomy to measure the students’ achievement level. After that, the question paper prepared for the achievement test was also sent for the regulation test and necessary amendments were made. Standardized research instruments were given to the sample and the collected data were analyzed. For this purpose, the data analysis was done using Bivariate Correlation and Chi-Square statistical methods, forming hypotheses related to the research questions. In cases where the data are parametric, it has been shown that “Pearson’s correlation coefficient” can be used (Turney, 2022). Accordingly, Bivariate Correlation was used to investigate the correlation between the subject’s attitude and student performance. In addition, the responses received for the questions asked by the questionnaire prepared according to the Liket scale and the student achievement scores were identified as categorical data. Therefore, chi-square tests were also conducted to examine the relationship between questionnaire items and student performance. Based on the information obtained from the data analysis, data interpretation was done and conclusions were drawn.
DATA ANALYSIS AND CONCLUSION
In quantitative research, there are many dimensions or profiles that can be used for data analysis, and here the correlational study profile was specifically chosen. Accordingly, data analysis was conducted to find out the relationship between the independent variable, attitude towards the subject of chemistry, and the dependent variable, student achievement.
According to Haya Atal, when there is a scale variable, it is possible to use statistical methods called Correlation and Regression to find the correlation between them. Here, a relationship between two variables or bivariate correlation is investigated in correlation study. Accordingly, Pearson’s correlation coefficient was used to investigate the relationship between subject attitude and student achievement (Meyers, Gamut, & Guarino, 2006). Since the null hypothesis was to be tested in terms of bivariate correlations, Bonferroni adjusted alpha values of 0.01(0.05/5) were used. Bivariate Correlation information was presented in bivariate analysis to investigate the correlation between the variables presented by the conceptual model of the study. Here the r-value indicates the strength of the relationship and the p-value indicates the statistical significance of the relationship. The scale of interpretation of correlation coefficient introduced by Guildford (1977) was used. According to him, if there is a correlation coefficient (+/-) in the range of 0 to 0.2, it is insignificant even if there is a relationship. 0.2 to 0.4 indicates a low correlation. 0.4 to 0.7 indicates moderate correlation and 0.7 to 0.9 indicates high correlation. Also, 0.9 to 1 indicates a very high correlation (Guilford, 1977). According to the conceptual model of this study, the relationship between attitude towards the subject and student achievement was (r=0.048, P=0.010). Accordingly, it was discovered that there is a positive correlation between the attitude towards the subject and student achievement.
Table 7. Correlation between Attitude and Student Achievement in Chemistry
| Correlations | |||
| SAQ | ALL MARKS | ||
| SAQ | Pearson Correlation | 1 | .O48 |
| Sig. (2-tailed) | .010 | ||
| Sum of Squares and Cross-products | 55.768 | 144.535 | |
| Covariance | .185 | .483 | |
| N | 302 | 302 | |
| ALL MARKS | Pearson Correlation | .048 | 1 |
| Sig. (2-tailed) | .010 | ||
| Sum of Squares and Cross-products | 144.535 | 165972.387 | |
| Covariance | .483 | 555.092 | |
| N | 302 | 302 | |
According to Table 7 above, it appears that the Pearson and correlation coefficient r = +0.048 between the attitude towards the subject of chemistry and the achievement of chemistry students. Accordingly, it is clear that there is a positive correlation between students’ attitude towards the subject of chemistry and student performance. Therefore, null hypothesis (H0) is rejected and (H1) is accepted. Or accept the alternative hypothesis (alternative hypothesis). Here, the dependent variable increases strongly as the independent variable increases. That is, it is clear that when the attitude towards the subject of chemistry increases, student achievement increases strongly. To further confirm this, a variance analysis was also conducted in the following manner.
Table 8. Analysis of Variance for Correlation between Attitude towards Chemistry Subject and Student Achievement
| Model | Sum of Squares | df | Mean Square | F | Sig. | |
| 1 | Regression | 286.084 | 1 | 568.507 | .111 | .000 |
| Residual | 169628.377 | 293 | 603.861 | |||
| Total | 169914.461 | 294 | ||||
| a. Dependent Variable: ALL MARKS | ||||||
| b. Predictors: (Constant), SAQu | ||||||
According to the Table 8 above, it appears that the significant value is 0.000<0.005, so the regression model is statistically normal. (f=.111, df=1, p=.000) (Generally significant value should be < 0.05.)
Thus, according to the above data analysis information, it appears that there is a small positive correlation between students’ attitude towards chemistry subject and chemistry student achievement. That is, the null hypothesis that there is no relationship between the subject’s attitude and student achievement is rejected and the alternative hypothesis that there is a relationship between students’ chemistry subject attitude and chemistry student achievement had to be accepted. In addition, each question of the research and conducted 30 chi-square tests and descriptive data analysis to examine differences in student achievement. The results of those analyzes are clearly presented in Table 9 below.
Table 9. Responses related to the questionnaire to measure the attitude towards the subject and student performance as the dependent variable of the data of the ki square test and descriptive data analysis.
| No | Item | Responses (%) and results of chi-square test | Criteria / the Relationship | |||||
| 01. | Chemistry is a fun | 1 | 2 | 3 | 4 | 5 | Agree | |
| 16.8% | 23.8% | 42.7% | 16.6% | 59.3% | ||||
| χ 2 | Df | P- Value | CV | Significant relationship | ||||
| 50.289 | 16 | 0.000 | 0.204 | |||||
| 02. | have good feelings towards chemistry | 1 | 2 | 3 | 4 | 5 | Not Agree | |
| 38.7% | 20.5% | 30.1% | 10.6% | 40.7% | ||||
| χ 2 | Df | P- Value | CV | Significant relationship | ||||
| 59.197 | 16 | 0.000 | 0.221 | |||||
| 03. | like chemistry | 1 | 2 | 3 | 4 | 5 | Not Agree | |
| 30.8% | 42.4% | 18.5% | 8.3% | 26.8% | ||||
| χ 2 | Df | P- Value | CV | Significant relationship | ||||
| 50.300 | 16 | 0.000 | 0.204 | |||||
| 04. | I would enjoy being a chemist or chemical scientist | 1 | 2 | 3 | 4 | 5 | Not Agree | |
| 53.6% | 13.9% | 19.5% | 12.9% | 32.4% | ||||
| χ 2 | Df | P- Value | CV | No significant relationship | ||||
| 15.530 | 16 | 0.496 | 0.113 | |||||
| 05. | Everyone should learn chemistry | 1 | 2 | 3 | 4 | 5 | Agree | |
| 4.3% | 20.2% | 43.7% | 31.8% | 75.5% | ||||
| χ 2 | Df | P- Value | CV | Significant relationship | ||||
| 49.212 | 16 | 0.000 | 0.202 | |||||
| 06. | feel nervous in chemistry class | 1 | 2 | 3 | 4 | 5 | Agree | |
| 16.6% | 25.2% | 46.4% | 11.9% | 58.3% | ||||
| χ 2 | Df | P- Value | CV | Significant relationship | ||||
| 66.811 | 16 | 0.000 | 0.235 | |||||
| 07. | I usually look forward to my chemistry class | 1 | 2 | 3 | 4 | 5 | Agree | |
| 10.3% | 19.5% | 47.4% | 22.8% | 70.2% | ||||
| χ 2 | Df | P- Value | CV | Significant relationship | ||||
| 40.341 | 16 | 0.001 | 0.183 | |||||
| 08. | We do a lot fun activities in chemistry class | 1 | 2 | 3 | 4 | 5 | Agree | |
| 18.6% | 27.5% | 32.5% | 21.5% | 54% | ||||
| χ 2 | Df | P- Value | CV | Significant relationship | ||||
| 42.163 | 16 | 0.001 | 0.187 | |||||
| 09 | We learn about important things in chemistry class | 1 | 2 | 3 | 4 | 5 | Not Agree | |
| 35.8% | 31.8% | 8.9% | 7.3% | 16.2% | ||||
| χ 2 | Df | P- Value | CV | Significant relationship | ||||
| 70.138 | 16 | 0.000 | 0.241 | |||||
| 10. | We cover interesting topics in chemistry class | 1 | 2 | 3 | 4 | 5 | Not Agree | |
| 44.7% | 40.1% | 12.9% | 2.3% | 15.2% | ||||
| χ 2 | Df | P- Value | CV | Significant relationship | ||||
| 70.138 | 16 | 0.000 | 0.241 | |||||
| 11. | love spending my free time studying chemistry | 1 | 2 | 3 | 4 | 5 | Not Agree | |
| 51.7% | 35.1% | 8.6% | 4.6% | 13.2% | ||||
| χ 2 | Df | P- Value | CV | Significant relationship | ||||
| 89.403 | 16 | 0.000 | 0.272 | |||||
| 12. | consider our chemistry classroom attractive and comfortable | 1 | 2 | 3 | 4 | 5 | Agree | |
| 2.6% | 12.6% | 51.3% | 33.4% | 84.7% | ||||
| χ 2 | Df | P- Value | CV | Significant relationship | ||||
| 35.312 | 12 | 0.000 | 0.197 | |||||
| 13. | Our chemistry classroom/laboratory contains a lot of interesting equipment | 1 | 2 | 3 | 4 | 5 | Agree | |
| 23.5% | 23.5% | 37.1% | 15.9% | 53% | ||||
| χ 2 | Df | P- Value | CV | Significant relationship | ||||
| 53.492 | 16 | 0.000 | 0.210 | |||||
| 14. | My chemistry teacher encourages me to learn more chemistry | 1 | 2 | 3 | 4 | 5 | Agree | |
| 23% | 22.2% | 41.7% | 23.2% | 64.9% | ||||
| χ 2 | Df | P- Value | CV | Significant relationship | ||||
| 66.070 | 16 | 0.000 | 0.234 | |||||
| 15. | I enjoy talking to my chemistry teacher after class | 1 | 2 | 3 | 4 | 5 | Agree | |
| 2.3% | 6.6% | 56.3% | 34.8% | 91.1% | ||||
| χ 2 | Df | P- Value | CV | Significant relationship | ||||
| 33.128 | 12 | 0.000 | 0.191 | |||||
| 16. | My chemistry teacher makes good plans for us | 1 | 2 | 3 | 4 | 5 | Agree | |
| 6.6% | 32.8% | 46.4% | 14.2% | 60.6% | ||||
| χ 2 | Df | P- Value | CV | Significant relationship | ||||
| 48.431 | 16 | 0.000 | 0.200 | |||||
| 17. | Sometimes my chemistry teacher makes me feel dumb | 1 | 2 | 3 | 4 | 5 | Agree | |
| 2.3% | 7.3% | 46.4% | 44% | 90.4% | ||||
| χ 2 | Df | P- Value | CV | Significant relationship | ||||
| 39.532 | 12 | 0.000 | 0.209 | |||||
| 18. | My chemistry teacher expects me to make good grades | 1 | 2 | 3 | 4 | 5 | Strongly Agree | |
| 10.9% | 9.6% | 25.5% | 54.4% | 79.5% | ||||
| χ 2 | Df | P- Value | CV | Significant relationship | ||||
| 36.211 | 16 | 0.003 | 0.173 | |||||
| 19. | My best friends like chemistry | 1 | 2 | 3 | 4 | 5 | Not Agree | |
| 44/7% | 38.1% | 9.3% | 7.9% | 16.6% | ||||
| χ 2 | Df | P- Value | CV | Significant relationship | ||||
| 57.405 | 16 | 0.000 | 0.218 | |||||
| 20. | Most of my friends do well in chemistry | 1 | 2 | 3 | 4 | 5 | Agree | |
| 7.3% | 14.6% | 58.6% | 19.2% | 78.1% | ||||
| χ 2 | Df | P- Value | CV | Significant relationship | ||||
| 68.109 | 16 | 0.000 | 0.237 | |||||
| 21. | I always try hard, no matter how difficult the work | 1 | 2 | 3 | 4 | 5 | Agree | |
| 4.9% | 12.3% | 46.7% | 36.1% | 82.8% | ||||
| χ 2 | Df | P- Value | CV | Significant relationship | ||||
| 41.510 | 16 | 0.001 | 0.185 | |||||
| 22. | When I fail that makes me try that much harder | 1 | 2 | 3 | 4 | 5 | Agree | |
| 31.8% | 23.8% | 27.2% | 17.2% | 44.4% | ||||
| χ 2 | Df | P- Value | CV | Significant relationship | ||||
| 54.544 | 16 | 0.000 | 0.212 | |||||
| 23. | I always try to do my best in school | 1 | 2 | 3 | 4 | 5 | Agree | |
| 17.8% | 33.1% | 32.8% | 16.2% | 49% | ||||
| χ 2 | Df | P- Value | CV | significant relationship | ||||
| 44.533 | 16 | 0.000 | 0.192 | |||||
| 24. | try hard to do well in chemistry | 1 | 2 | 3 | 4 | 5 | Agree | |
| 10.3% | 34.4% | 40.7% | 14.6% | 55.3% | ||||
| χ 2 | Df | P- Value | CV | Significant relationship | ||||
| 35.845 | 16 | 0.004 | 0.172 | |||||
| 25. | Chemistry makes me feel as though I am lost in a bush | 1 | 2 | 3 | 4 | 5 | Agree | |
| 19.5% | 23.2% | 29.8% | 27.5% | 57.3% | ||||
| χ 2 | Df | P- Value | CV | Significant relationship | ||||
| 49.025 | 16 | 0.000 | 0.201 | |||||
| 26. | Chemistry tests make me not afraid | 1 | 2 | 3 | 4 | 5 | Agree | |
| 11.2% | 26.5% | 44.4% | 17.9% | 62.3% | ||||
| χ 2 | Df | P- Value | CV | Significant relationship | ||||
| 53.139 | 16 | 0.000 | 0.210 | |||||
| 27. | would probably not do well in sciences if I took it in college. | 1 | 2 | 3 | 4 | 5 | Agree | |
| 10.3% | 11.9% | 42.4% | 35.4% | 77.8% | ||||
| χ 2 | Df | P- Value | CV | No significant relationship | ||||
| 21.358 | 16 | 0.163 | 0.133 | |||||
| 28. | consider myself a good chemistry student | 1 | 2 | 3 | 4 | 5 | Agree | |
| 15.9% | 25.2% | 36.4% | 22.5% | 59.2% | ||||
| χ 2 | Df | P- Value | CV | Significant relationship | ||||
| 46.701 | 16 | 0.000 | 0.197 | |||||
| 29. | I think I am capable of becoming an engineer, scientist, chemist or doctor | 1 | 2 | 3 | 4 | 5 | Agree | |
| 9.6% | 17.2% | 46.4% | 26.8% | 73.2% | ||||
| χ 2 | Df | P- Value | CV | Significant relationship | ||||
| 30.071 | 16 | 0.018 | 0.158 | |||||
| 30. | n chemistry class, I feel being in control of my learning | 1 | 2 | 3 | 4 | 5 | Strongly Agree | |
| 13.6% | 15.9% | 35.1% | 35.4% | 70.5% | ||||
| χ 2 | Df | P- Value | CV | Significant relationship | ||||
| 57.139 | 16 | 0.000 | 0.217 | |||||
According to the Chi-square test conducted between each question item and student performance in the related questionnaire to measure the attitude towards the subject, the P value was less than 0.05 (P < 0.05) in all but two cases. Accordingly, the null hypothesis (H0) was always rejected. The alternative hypothesis was accepted. That is, it was possible to detect that there is a significant difference between each question related to measuring students’ attitude towards the subject and chemistry student performance. Likewise, the degree of influence exerted by the independent variable on student achievement is indicated by the Cramer’s v (Cramer’s v) value.
A chi-square test was conducted to examine the relationship between student achievement as the dependent variable in cases where the item “I would like to be a chemist or chemist” and the items “I learn all science subjects very well” behave as independent variables. According to the results of the test, it was revealed that the null hypothesis is acceptable. Here, the P value obtained in the relationship between the two variables had values greater than 0.05 (P > 0.05). The values were found to be 0.496 and 0.163 (P=0.496, P=0.163) respectively. Because of this, in both the cases, Veseyi recognized that there is no difference. Additionally, the first of the two relationships between these variables had the highest number of responses to disagree. It is 53.6 % as a percentage. Also, this questionnaire had the lowest CV value (CV=0.113) among all the questionnaires. In the second relationship, the highest response was given for the response level of “agree”. It is a percentage of 42.4%.
The highest CV value (CV= 0.272) among all the questionnaires was shown for the 11th questionnaire. ” love spending my free time studying chemistry,” the questionnaire was presented. That is, covering the lessons in the learning and teaching process in an interesting way and student achievement revealed that there was a positive significant difference between the two variables. (χ 2= 89.403, Df=16, P=0.000, CV=0.272). Here, the highest response was given for the response level of Disagree. It is 51.7 % as a percentage. The number of positive responses to the questionnaire was 13.2%. Also, 35.1% of the students had stated that they could not give a specific answer for this. Accordingly, the percentage of students who did not know the answer and gave negative answers was 86.1%. Accordingly, a greater number of students had given negative responses in relation to the question which showed the highest CV value. This is a significant situation. That is, most of the students in the sample related to the research say that learning chemistry lessons becomes uninteresting in the learning and teaching process. In the presence of this attitude, students’ interest in this subject decreases.
The number of questions that were given was “I Strongly agree ” which is the highest response in getting responses for this questionnaire. Let’s distinguish those questions as follows.
- Our chemistry classroom has a high level of equipment (54.4 %).
- When learning chemistry, I do not feel in control of my learning or do not want to stop learning (35.4 %).
Among the rest of the questions in this questionnaire, twenty questions were answered for the “I agree” response level. However, among them, the percentage of people who gave negative responses, “I do not agree and there is no agreement or disagreement” for the following questions, was more than 20%. Accordingly, it was possible to detect the number of negative responses in front of each question item as follows.
- Chemistry is a fun subject (40.6 %).
- Everyone should learn chemistry (24.5 %).
- Like to use my free time to study chemistry (41.8 %)
- I do not feel nervous in the chemistry classroom (29.8 %)
- Chemicals are sufficiently high (46.1 %)
- I would like to talk with the science teacher after class teaching activities (47 %).
- Our chemistry teacher teaches the subject in a planned way (45.2 %).
- My teacher expects high results from me (39.4 %).
- Most of my friends know chemistry well (22.9 %).
- When I fail, I work hard and succeed again (55.6 %)
- I try to do my best at school (50.9 %).
- I am very diligent in doing chemistry exercises (42.7 %).
- I have no fear in doing chemistry practical tests (37.7 %).
- I think I am a good chemistry student (41.1 %).
- I think that I have the ability to get a job in the field of chemistry (26.8 %).
According to the above findings, it appears that the subject of chemistry has become a difficult subject for a majority of students. Also, most students do not understand the importance of studying chemistry. After the classroom learning teaching process, the students engaged in the academic process shows a minimum level. Often the teacher-student relationship is limited to the classroom learning and teaching process. Most teachers have minimal preparation and enter the classroom unplanned. Also, the degree of intrinsic motivation in students should be taken care of. In particular, it is seen that students have various difficulties in solving problems related to the subject of chemistry. In addition to this, the group of students who are eager to learn the subject with maximum dedication also make up almost half of the sample. Also, there is a group of students who work with some fear in laboratory activities.
REFERENCES
- R. a. Development, “Education Perspectives,” Ministry of Education, Sri Lanka, Baththaramulla, 2016.
- R. a. D. Branch, “Education Perspectives,” Ministry of Education, Sri Lanka, Baththaramulla, 2017.
- R. a. D. Branch, “Education Perspectives,” Ministry Of Education, Sri Lanka, Baththaramulla, 2018.
- R. a. D. Branch, “Common Certificate of Studies Ordinary Level Examination – Assessment Report – Science,” Department of Examination, Sri Lanka, Pelawaththa, 2017.
- R. a. D. Branch, “Common Certificate of Studies Ordinary Level Examination – Assessment Report – Science,” Department of Examination, Sri Lanka, Pelawaththa, 2018.
- R. a. D. Branch, “Common Certificate of Studies Ordinary Level Examination – Assessment Report – Science,” Department Of Education, Pelawaththa, 2019.
- R. a. D. Branch, “Common Certificate of Studies Ordinary Level Examination – Assessment Report – Science,” Department of Examination, Pelawaththa, 2020.
- A.Hassan, “Factor Affecting Student’s Performance in Chemistry,” World Academy of Science , Zanzibar, 2015.
- A. B. Ridzuman, “Effect of Concept MappingOn Students’ Academic Achievement,” Jonal of Research and Reflections in Education, 22018.
- M. Bhimashanker, “Research Onion,” 2011.
- N. Blunch, “Introduction to Structuaral Equation Modeling using SPSS and AMOS,” London, 2008.
- R. a. D. branch, “Education Perspective,” Ministry of Education, Sri Lanka, Baththaramulla, 2016.