
Ringgit Malaysia Uncertainty Spillover from Google Trends Uncertainty
- Neilson Anak Teruki
- Zainuddin Sabu
- Saizal Pinjaman
- Robert Abraham Mojolou
- Shairil Izwan Taasim
- 367-372
- Apr 12, 2025
- Economics
Ringgit Malaysia Uncertainty Spillover from Google Trends Uncertainty
Shairil Izwan Taasim1*, Neilson Anak Teruki1, Zainuddin Sabu1 , Saizal Pinjaman2 & Robert Abraham Mojolou3
1Department of Social Science and Management, Faculty of Humanities, Management and Science, Universiti Putra Malaysia
2 Faculty of Business, Economics and Accountancy, Universiti Malaysia Sabah.
3North Borneo University College, Malaysia.
*Corresponding Author
DOI: https://dx.doi.org/10.47772/IJRISS.2025.915EC0022
Received: 27 February 2025; Revised: 08 March 2025; Accepted: 13 March 2025; Published: 12 April 2025
ABSTRACT
The great reset of the economic is one of the methods for Malaysia after the crisis of Covid-19 and to boost economic growth again. Meanwhile, Malaysia transitioned to a managed float system, allowing the ringgit to fluctuate based on market conditions. Despite periods of volatility, the economy has demonstrated resilience, supported by prudent monetary and fiscal policies. In 2024, Malaysia experienced strong economic performance, characterized by low and stable inflation. This event motivates us to study the relationship uncertainty from google trends towards ringgit volatility against US Dollar. The study used the Granger causality test methodology to assess the correlation between GTU and Ringgit exchange. The GTU was represented set word in google trends from the uncertainty word from the Economic Report of Malaysia. The data for this study over the period end of the year 2021 (September) until the end of the year 2022 (November). The implication from this study was Google Trends Uncertainty give the impact towards Ringgit volatility in the long run.
Keywords: uncertainty, Google Trends, Ringgit, volatility, Exchange Rates
INTRODUCTION
The economic sector has completely changed with the existence of technology as a catalyst for growth. The business sector has been in direct contact with society and impacted the customer-to-customer business, which is changing the environment and increasing the uncertainty of the market.
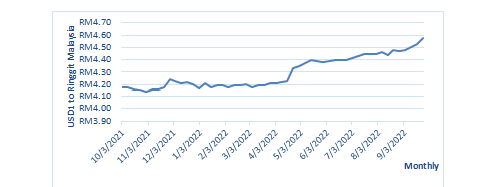
FIGURE 1: Malaysian Ringgit Exchange Rate Against US Dollar for the year 2021/2022
Source : Bank Negara Malaysia, 2023
Implications are seen during the instability of the global economy and the world health crisis in 2020/2021, which has not yet shown signs of rapid recovery even though the Malaysian government has opened the economic sector as wide as possible by removing some restrictions. The positive indicator of Malaysia’s economic growth in the first quarter of 2022 is 5.0 percent compared to 3.6 percent in the previous quarter (Malaysia, 2022a). Nevertheless, the exchange rate of the Malaysian ringgit dropped drastically even though the economy was performing well. Figure 1 shows the daily data of the ringgit currency exchange to the US dollar from October 2021 until September 2022. The data shows that the ringgit is traded weakly against the US dollar, and the value continues to show a downward trend even as the economy continues to grow.
The development of Malaysia’s open economy with the rapid growth of the foreign trade sector has an impact on exporters and importers. As a trading country, the country’s domestic supply and demand are greatly affected by foreign currency exchange, especially the US Dollar. Malaysia (2022b) the continued fall in the value of the ringgit due to the faster increase in the US federal reserve coupled with the Russia-Ukraine conflict that began in February 2022. The VUCA environment situation in the economy continues to affect economic growth if not dealt with efficiently and will also have an effect continuously. Based on that goal, the objective of the study is to construct a google trends index against the ringgit exchange rate to the US dollar based on economic reports related to uncertainty. The main objective of this study is to identify the google trends uncertainty to link the volatility of the Ringgit Malaysia exchange rate to the US Dollar.
LITERATURE REVIEW
During the 1997 Asian financial crisis, the ringgit experienced a sharp depreciation, dropping from approximately 2.50 to the US dollar to a low of 4.80. In response, the Malaysian government implemented a currency peg at 3.80 to the US dollar in 1998 and introduced capital controls to stabilize the economy. These measures were widely credited with facilitating Malaysia’s recovery, enabling the country to rebound more swiftly than some of its regional peers. By 2024, Malaysia’s economy demonstrated strong performance, characterized by low and stable inflation. The International Monetary Fund (IMF) advised the continuation of fiscal consolidation to restore fiscal buffers and recommended tightening monetary policy should inflationary pressures intensify. The Malaysian economy has long been influenced by various economic factors, including inflation, exchange rate volatility, and policy uncertainty. According to Hsing (2020) the ringgit, Malaysia’s national currency, has experienced significant fluctuations in recent years, with the global financial crisis in 2008-2009 leading to a 16.14% depreciation of the ringgit against major currencies.
Currency volatility, a measure of the fluctuations in the exchange rate of a currency relative to other currencies, has become an increasingly significant factor in the dynamics of global financial markets. Recent studies have highlighted the complex relationship between exchange rate volatility and various economic indicators, including productivity growth, trade flows, and commodity prices (Uremadu et al., 2017) (Daniel & Tosin, 2020) (Ariff & Zarei, 2018). (Chinthapalli (2021) the foreign exchange market, with its daily transaction volume of over $3.2 trillion, is the world’s largest financial market and has become increasingly dynamic and volatile in recent years. Volatility in the foreign exchange market can have significant implications for the economic performance of countries, particularly developing economies like Malaysia.
The literature on exchange rate management policy in developing countries has grown considerably in recent years, reflecting the increasing recognition of the impact of exchange rate policies on economic outcomes (Akpesiri & Oghenemega, 2020). Meanwhile Gala (2007) one key aspect of this literature is the development approach to exchange rates, which suggests that competitive currencies have been a crucial factor in the successful growth strategies of many East and Southeast Asian economies. Indeed, the literature has established a strong empirical link between overvalued exchange rates and low per capita growth rates, underscoring the importance of maintaining a competitive exchange rate for economic development. The International Monetary Fund and other institutions have recorded how countries manage their exchange rates to promote sustainable economic growth, with exchange rate regimes serving as a critical pillar within economic policy frameworks.
METHODOLOGY
The data in this study covering from weekly data for the years 2021 and 2022. The form of the simple log-linear model represents from equation (1).
LgGTUt= β0 + β2LgRM + ɛt (1)
Where Lg represents the natural log-linear for GTU denotes Googles Trends Uncertainty. RM represents Ringgit Exchange Rate against US Dollar. We apply the co-integration test to analyze both variables move jointly; according to Gujarati (2003), the pairs of variables could be described as co-integrated if they have a long-run relationship. Equation (2) shows the maximum like-hood estimation for cointegration.
\[ \Delta Z_t = \mu + \rho_1 \Delta Z_{t-1} + \dots + \rho_{k+1} \Delta Z_{t – p + 1} + \Pi \Delta Z_{t-k} + \varepsilon_t \quad \text{(2)} \]
Where Zt is a k x 1 vector of stochastic variables, is a k x 1 vector of constant, was error term and and ∏ are k x k matrices of parameters. After the equation show co-integration, we employ the Granger causality test according to Granger (1981) and Engle and Granger (1987). Johansen and Juselius(1990) cointegration techniques have become the solution to determining the long-run relationship between series that are non-stationary, as well as reparametrizing them to the Error Correction Model (ECM). We employ time series analysis was used to test the objective of this study. The weekly data for this study was obtained from Bloomberg and Bank Negara Malaysia.
For GTU is related to uncertainty which is a situation in which something is not known or something that is doubtful. GTU indices are interpreted as measures of business uncertainty. Based on Castelnuovo and Tran (2017), we are creating the GTU index over the period of October 2021 to September 2022. Construction of the GTU index using a bibliometric analysis (Aslanidis et al. 2022) with the procedure, identification, aggregation, and robustness check. According to Castelnuovo and Tran (2017), the GTU index was obtained from the frequencies if Nc search as the following equation (3).
\[ GTU_{m,c} = \sum_{i=1}^{N_c} FI_{i,m,c}^{x,*} \quad \text{(3)} \]
Where GTU represents Google Trends Uncertainty from the Economic Report of Malaysia 2022, FI is the benchmark of the term which word of x to construct the index. However, according to Castelnuovo and Tran (2017), to develop the GTU index, the researcher should assume that internet users represent economic agents.
EMPIRICAL RESULT
To test stationary time series data, the ADF and PP unit root test was run for our data sets. The results for the unit root test are shown in table 2. All the results from the table were obtained and integrated into order one I(1). On the other hand, the results represent our datasets are stationary for both test ADF and PP at the level I(1). We test to ensure no spurious regression, as suggested by Taasim, Pinjaman and Albani (2021); Perron and Ng (1996).
TABLE 2: Unit root test at First Difference
| Augmented Dickey-Fuller (ADF) | Phillips-Perron (PP) | |||
| With Constant & Trend | Without Constant & Trend | With Constant & Trend | Without Constant & Trend | |
| LGTU | -13.0973* | -13.2791* | -14.4666* | -14.5028 |
| LRM | -6.9836* | -6.0514* | -7.0132 | -6.2652 |
*Significant at the 1%
Johansen co-integration was employed in the analysis to examine the long-run movement of the variables. The results of this analysis are presented in table 3. The findings indicate the existence of a cointegrating relationship between these two variables, Ringgit volatility against the US Dollar and Google Trends Uncertainty (GTU). The results show that in the long run, these two variables move closely.
TABLE 3: Johansen co-integration test
| Eigenvalue | Trace | 0.05 | Probability | Number of cointegrating equations |
| Statistic | Critical Value | |||
| 0.51581 | 51.296 | 15.4947 | 0.0000* | None |
| 0.27499 | 15.757 | 3.84147 | 0.0001* | At most 1 |
Lag selection based on the Akaike Information criterion (two lag), *Significant at the 1%
We employ Granger-causality to examine the long-run and the short-run causality. Granger causality, a fundamental concept in econometrics and time series analysis, provides a framework for understanding the dynamic relationships between variables and determining the directionality of influence. The result for Granger causality at the first difference was examined between the uncertainty of the google trends index against the Ringgit Exchange.
TABLE 4 4: Granger-causality test
| Direction | F-Statistic | p-Value |
| D(LRM) → D(LGTU) | 0.1984 | 0.8208 |
| D(LGTU) → D(LRM) | 3.45563 | 0.0404 |
The results are reported in table 4. The test examines whether there is a long-term equilibrium relationship between the variables by checking for the presence of cointegration equations.We could not be rejected the null hypothesis at the 1% significance that D(LRM) does not granger cause D(LGTU) with a p-value of 0.8208. This means the Ringgit exchange against US Dollar does cause Google Trends Uncertainty (GTU). However, the analysis could not reject D(LGTU) à D(LRM), and the analysis could be rejected the null hypothesis at a 5% of significant level. This result shows the increasing GTU did Granger-cause an increase in Ringgit volatility against US Dollar. The results indicate the presence of at least two cointegrating relationships among the variables. This means that despite potential short-term fluctuations, the variables are tied together in the long run, making them suitable for a Vector Error Correction Model (VECM) rather than a standard Vector Autoregression (VAR) model.
CONCLUSION
This paper aims to measure of uncertainty of the Ringgit against GTU. From our analysis, we find out that GTU has a significant impact towards Ringgit volatility. The movement of economic agents or internet users in the long run from the analysis is not to be taken lightly. Moreover, the opening of the economy, which is still in the recovery phase and the value of the ringgit play an important role, especially in the country’s international trade and the value of BNM’s reserves. In addition, the study that uses weekly data throughout the 2021/2022 period is heavily influenced by the country’s current political performance throughout the period. The GTU values that were formed emphasize the search aspect of Malaysian policy reform and debt. This research provides an important body of knowledge on the impact of internet users on the volatility of the Ringgit.
ACKNOWLEDGMENT
This research was carried out as part of a project supported by Universiti Putra Malaysia (Grant: GP-IPM/2021/9706400).
REFERENCE
- Aslanidis, N., Bariviera, A. F., & López, Ó. G. (2022). The link between cryptocurrencies and Google Trends attention. In Finance Research Letters (Vol. 47, p. 102654). Elsevier BV. https://doi.org/10.1016/j.frl.2021.102654
- Ariff, M., & Zarei, A. (2018). Sustainable Development and Currency Exchange Rate Behavior. In Asian Economic Papers (Vol. 17, Issue 3, p. 148). The MIT Press. https://doi.org/10.1162/asep_a_00644
- Akpesiri, E. M., & Oghenemega, E. J. (2020). Exchange Rate Policy Appropriateness in a Less Developed Country: The Nigerian Case. In International Journal of Academic Research in Business and Social Sciences (Vol. 10, Issue 6). https://doi.org/10.6007/ijarbss/v10-i6/7934
- Castelnuovo, E., & Tran, T. D. (2017). Google It Up! A Google Trends-based Uncertainty index for the United States and Australia. In Economics Letters (Vol. 161, pp. 149–153). Elsevier BV. https://doi.org/10.1016/j.econlet.2017.09.032
- Chinthapalli, U. R. (2021). A Comparative Analysis on Probability of Volatility Clusters on Cryptocurrencies, and FOREX Currencies. In Journal of risk and financial management (Vol. 14, Issue 7, p. 308). Multidisciplinary Digital Publishing Institute. https://doi.org/10.3390/jrfm14070308
- Daniel, D. M., & Tosin, I. O. (2020). Exchange Rate Volatility and Agricultural Commodity Prices i Nigeria (2000-2018). In International Journal of Business Economics and Management (Vol. 7, Issue 5, p. 290). https://doi.org/10.18488/journal.62.2020.75.290.300
- Gala, P. (2007). Real exchange rate levels and economic development: theoretical analysis and econometric evidence. In Cambridge Journal of Economics (Vol. 32, Issue 2, p. 273). Oxford University Press. https://doi.org/10.1093/cje/bem042
- Malaysia (2020a) Prestasi ekonomi suku tahun pertama 2020. Department of Statistic Malaysia. Accessed onhttps://www.dosm.gov.my/v1/uploads/ files/5_Gallery/2_Media/4_Stats%40media/4-Press_Statement/2022/05.%20MEI/GDP%20Q1%202022.pdf
- Malaysia (2022b) Tinjauan ekonomi 2023, Keluarga Malaysia, Makmur Bersama. Kementerian Kewangan Malaysia.
- Perron, P., and Ng, S (1996). “Useful Modifications to Unit Root Tests with Dependent Errors and their Local Asymptotic Properties,” Review of Economic Studies, 63, 435-465.
- Taasim, S. I., Pinjaman, S., & Albani, A. (2021). Does Energy Consumption and Trade Openness Contribute to Economic Growth in the East Asian Growth Area? In International Journal of Energy Economics and Policy (Vol. 11, Issue 2, pp. 23–29). EconJournals. https://doi.org/10.32479/ijeep.10644
- Uremadu, S. O., Odili, O., & Florence, O. A. (2017). The Effects of Exchange Rate Variability on Trade Flows in Nigeria: A Cointegration Analysis. In Quarterly Journal of Econometrics Research (Vol. 3, Issue 2, p. 12). https://doi.org/10.18488/journal.88.2017.32.12.51
- Hsing, Y. (2020). A Simultaneous-Equation Model of Estimating Exchange Rate Pass-Through in Malaysia. In Quantitative Economics and Management Studies (Vol. 1, Issue 3, p. 181). https://doi.org/10.35877/454ri.qems193
APPENDIX
Malaysia specific selected keywords
| Affordable housing | Globalization |
| Asset | Graduate employability |
| Agriculture industry | Government budget |
| Bank | Government debt |
| Bank regulation | Gross domestic product |
| Bankruptcy | Growth forecast |
| Bond | Inflation |
| Budget | Interest rate |
| Business outlook | Investment management |
| Prime minister | Loan |
| China economic | Minimum wage |
| Commodity | Monetary policy |
| Consumer price index | Moratorium |
| Consumer spending | Oil price |
| Debt | Pension |
| Food price | Public health |
| Household debt | Policy |
| Food security | Policy reform |
| Debt restructuring | Real estate |
| Derivative | Housing price |
| Economic recovery | Stimulus package |
| Dollar USD | Stock market |
| Petrodollar | Tax reform |
| Exchange rate | Wage |
| Fiscal policy | World economic |
| Foreign direct investment | Job security |
| Foreign exchange | Unemployment |