
Scale Development and Inferential Analysis of Service Quality in Higher Education: A Sequential Exploratory Mixed-Method Study
- Gersha Pierre PhD
- 1814-1847
- Apr 14, 2024
- Education
Scale Development and Inferential Analysis of Service Quality in Higher Education: A Sequential Exploratory Mixed-Method Study
Gersha Pierre PhD
The University of the Southern Caribbean
DOI: https://dx.doi.org/10.47772/IJRISS.2024.803130
Received: 14 February 2024; Revised: 07 March 2024; Accepted: 12 March 2024; Published: 14 April 2024
ABSTRACT
In response to the consumer-oriented shift in higher education, institutions are embracing technology and flexible delivery to enhance services. This is critical for student attraction, retention, and academic success. Consequently, the focus on service quality and student satisfaction has grown. This study investigates service quality expectations and perceptions of students in a local Caribbean -based tertiary institution. A novel scale, the “Service Quality Scale for Higher Education (SQSHE),” is developed using a sequential-exploratory mixed-method approach. The SERVQUAL-driven Disconfirmation framework informs this scale, measuring the gap between expected and perceived service encounters. Three focus group interviews generate a 53-item pool, refined to a 23-item scale with four dimensions: student well-being, service efficiency, social interaction, and value co-creation. The SQSHE demonstrates reliability, stability, and internal consistency. Data from 179 participants via an online questionnaire reveal four service quality dimensions, with two displaying significant negative gap scores. This culturally relevant four-factor scale contributes significantly to higher education research. By addressing student expectations, institutions can enhance strategies to elevate satisfaction and success rates.
Background
Higher education is a fast-growing and competitive service industry. Whelan (2016) notes the zeal and desperation on the part of some public tertiary institutions to make sure they maintain their student numbers given that state funding is often closely tied to enrolments.
Higher education students are exhibiting more of a consumer- oriented approach to their education. (Bunce et al., 2017). They are looking for access to quality services and education across new technologies.The data suggests that when students feel satisfied with their tertiary experiences, satisfied students whose expectations have been met, may “bring continuous advantages for their institution through word-of-mouth communication” (Farahmandian et al., 2013, p.65). How can administrators measure students’ satisfaction with the services they receive? What are the key indicators of service quality and which scale is most valid and reliable as well as culturally relevant? This study seeks to describe and highlight the methodology utilised to explore the dimensions of students’ service quality expectations and perceptions at a local tertiary institution and develop a contextually relevant, valid and reliable scale to measure these key dimensions of service quality.
Service Quality
When the concepts of quality,excellence and service are combined, the concept of service quality emerges as the gap between customers’ expectations and perceptions (Zeithaml, Berry, & Parasuraman, 1990). It can be defined as ‘an attitude developed over all previous encounters with a service firm’ (Clow, Kurtz, Ozment & Ong, 1997, p. 232). Lewis and Booms (1983), cited in Lewis and Mitchell, (1990) believe that service quality is a measure of how well the service level delivered matches customers’ expectations. As Nadiri et al. (2009, p. 525, cited by Teeroovengadum et al., 2016) posits, “if service quality is to be improved, it must be reliably assessed and measured. Therefore, institutions must employ reliable and valid instruments to measure traditional indicators of excellence but must also utilize effective instruments to measure service quality from the students’ perspective.”
There are several well-established models that have been developed and utilized to measure service quality. Among them is the SERVQUAL instrument which measures the difference between what is expected from a service encounter and the perception of the actual service encounter (Parasuraman et al., 1988). The authors named this the disconfirmation paradigm and operationalized it as:
Service Quality (Q) = Perception (P) – Expectation (E) (Tan & Kek, 2004).
Administrators of higher educational institutions realize that when making the major decision of selecting a university, students look for indications that the institution offers excellent service quality (Donaldson & McNicholas, 2004), and the positive perceptions of service quality can provide student satisfaction. Satisfied students may then attract new students by engaging in positive word-of-mouth communication However, based on the examination of current research, there is a lack of enquiry into defining the dimensions of service quality as it pertains to the Caribbean context. In addition, there is a lack of culturally valid and reliable instruments that assesses service quality among tertiary education students.
METHODOLOGY
Design
Anexploratory sequential design that was quantitative-driven (Morse, 1991) was utilized in this study to explore the concept of service quality among the students at a local university, and develop a new scale. For this study, the goal was to explore the key dimensions of service quality and then allow the dimensions discovered to guide the development of a new instrument based in part on the SERVQUAL instrument, which would measure the phenomenon of service quality on a much larger scale. This would require a sequential approach, collecting qualitative data from a small group of participants through focus group interviews in the first phase and using the findings generated from their responses to produce a quantitative instrument that was applied to a larger sample. In this study the following research questions were addressed:
Research Question #1: How do students at a local university define the determinants of service quality expectations and perceptions?
Research Question #2: What are the distinct factors of service quality and which scale items best represent these factors?
Figure 1 shows the key aspects and stages of this mixed-method research design.
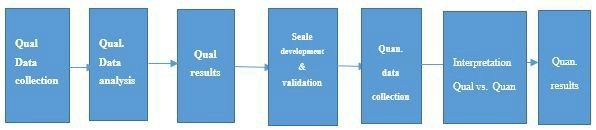
Figure 1. Exploratory Sequential Mixed Method Diagrammatic Illustration
Development of the Instrument
In the first phase of the study, based on the qualitative research objective a list of interview questions was prepared to guide each or three focus group interview sessions. As far as was possible, identical questions were used for each interview session. The development of the questions was based on several sources in the literature, including other qualitative studies that also explored service quality in higher education. Generally, the questions focused on participants’ expectations and perceptions with academic and non-academic aspects of their tertiary experience at the institution.
Appendix A provides a copy of the Interview protocol for each Focus Group Meeting including the list of questions used to guide the discussions.
Qualitative Sampling Method
The homogeneous purposive sampling technique was primarily used in the qualitative (QUAL) phase of this study. In other words, the sample of 18 students shared similar characteristics to the population of the institution, with the required selection criteria: male or female, over 18 years, and English as their first language.
For this study there were three focus groups. Guided by the work of Asquith (1997) the first focus group consisted of eight participants, while the second and third consisted of four and five participants each.
The first focus group meeting was held with a mixed group of eight students comprising four local Trinidad and Tobago students and four overseas students. To deepen the rigor of the qualitative component of the study, seeking data saturation, two additional focus group interviews were conducted over a period of one year. For the second and third focus group interviews, the students were grouped homogeneously. Focus group 2 consisted of four oversees students, and the third focus group consisted of five local students.
The use of multiple focus groups went a long way towards data saturation and the development of a typology of motives for the study of students from within the Caribbean region. It was felt that Caribbean students’ views varied significantly from those highlighted by students based in Europe, Asia and the more developed countries from which previous research on service quality emanated.
Qualitative Data Analysis
Table 1 presentsa summary of the qualitative data analysis procedures and products that were implemented for this study.
Table 1
| Steps | Procedure | Products |
| Qualitative data analysis | Content analysis of focus group meetings Coding of transcript material using NVIVO software | Coded transcripts combined into one dataset 8 themes emerged representing 8 key dimensions of service quality |
Following the transcribing of the focus group meetings, the NVIVO version 8.2 software was utilized to conduct qualitative data analysis through coding, thematic development, and thematic analysis.
Qualitative Content Validity and Reliability Measures
This study utilized appropriate strategies to ensure validity and reliability of the research, during both the qualitative and the quantitative stages of the study. For the qualitative stage, descriptive validity was enhanced during each focus group interview first by the recording of interviews with two different digital audio recorders and secondly by conducting verbatim transcription of each session. To enhance reliability, the researcher followed identical interview protocols for each session, using the same open-ended questions, member checks at multiple points throughout study, triangulation with several types of data and peer and colleague examination of the data during analysis to help confirm findings. At the end of each focus group interview, protocols to ensure interpretive validity (Hayashi et al., 2019) included a discussion meeting between the researcher and the rapporteurs. Also, reflective journaling of non-verbal responses, body language and other useful observations was done by the researcher.
Transitioning from the Qualitative to the Quantitative Data Collection Phase
In this sequential-exploratory mixed-method study, the transition from the qualitative phase of the research to the quantitative phase occurred as the focus group interview responses by students, along with extensive literature review by the researcher, were utilized to develop items for the new scale. Initial open coding on analyses of the data items resulted in 8 coded themes which were divided into three categories as follows:
- Category 1: Themes from the SERVQUAL dimensions for measuring service quality (the five themes of tangibility, reliability, responsiveness, assurance and empathy.
- Category 2 – Themes gleaned from the literature.
- Category 3 –New themes generated by this researcher based on student feedback
Quantitative Phase
Figure 2 presents the steps followed for the scale development, data collection and preliminary construct validation phases of the study to address the first quantitative research question.

Figure 2. Steps followed for Scale Development and Validation
Quantitative Instrument (Scale) Development
The scale development process was guided by the three-phase, nine-step approach advocated by Boateng et al. (2018). Phase 1, called Item Development, consisted of two steps: identification of the domain and item generation and secondly, consideration of content validation. The second phase, Scale Development, focused on turning individual items into a harmonious and measuring construct, and consisted of four steps: pre-testing questions, sampling and survey administration, extraction of latent factors and item reduction. The third and final phase, Scale Evaluation, consisted of three steps: tests of dimensionality, tests of reliability, and tests of validity.
Identification of the Domain and Item Generation
First, the emerging themes that were generated during the qualitative phase were used to develop new survey items. The five themes of the SERVQUAL instrument were used as a conceptual underpinning or starting point for identification of the domains. Utilizing a combined deductive and inductive approach, new items were added to each of the original five SERVQUAL themes, along with items drawn from the emerging themes, based on the analysis of the focus group interviews and supported by a review of the current literature on dimensions of service quality in higher education (Pereda et al., 2007).
During the item generation stage, at least two items were created and added to each of the original five SERVQUAL dimensions, along with three additional dimensions. The three new dimensions added to the original five from SERVQUAL were Ethics, Social Benefits and Cocreation.
Following the format used by Cerri (2012), the original 22 item SERVQUAL scale was significantly altered in terms of names of factors, number of items, and reformulation of item wording. Appendix B presents a Listing of the new scale (with newly created items highlighted in bold). In addition,Appendix C – Joint Display #1, displays a completed table showing all the new items developed inductively through analysis of focus group student response data. Table 2 presents a breakdown of the eight dimensions of service quality that comprised the new scale that was administered to the sample.
Table 2. Summary of Structure of New Scale with Eight Dimensions of Service Quality
| New Scale Factors Number | Name of Factor | Number of Items | Number of New Items Generated from Focus Group Interviews and Literature Review |
| 1 | Tangibles | 8 | 4 |
| 2 | Reliability | 7 | 3 |
| 3 | Responsiveness | 5 | 2 |
| 4 | Assurance | 7 | 3 |
| 5 | Empathy | 7 | 3 |
| 6 | Social Benefits | 7 | 7 |
| 7 | Ethics | 7 | 7 |
| 8 | Co-creation | 7 | 7 |
Scale Reliability and Content validity
During the item development phase, five expert judges were engaged in the process of “theoretical analysis” (Morgado et al., 2017 p. 2) of the items. Cognitive interviews were conducted utilizing a small group of three students and three faculty as an additional content validity step to collect verbal information about the response process. Additionally, the criterion of a minimum of three items to establish a subscale was followed in the item development phase (Anderson & Rubin, 1956, Comrey,1988 cited in Hassad, 2007)
Quantitative Sampling Method and Questionnaire Administration
Purposive sampling was used to select participants for the quantitative data collection phase, following a similar procedure to that used at the qualitative phase. The survey remained on the Survey Monkey platform for three weeks. Three reminder prompts (one per week) were sent to the sample group to maximize their awareness of the survey’s existence and increase participation rates. A total of 279 responses were received, representing a percentage response rate of twenty-three percent.
Quantitative Data Analysis
Item Reduction
Using the SPSS software, item-total correlation was applied to determine the correlations between scale items as well as identify potential factors for the new scale. Initial inspection of the correlation results helped ensure that only parsimonious, functional, and internally consistent items were ultimately included in the new scale (Boateng et al., 2018). For this research, the estimation of item total correlation greater that 0.3 was used as the rule of thumb for item reduction (Nunnally & Bernstein, 1994).
Variable Reduction Technique Selected
Following the initial inspection, the factorability of the scale items was examined, utilizing the Kaiser-Meyer-Olkin measure of sampling adequacy and Bartlett’s test of sphericity. The Kaiser-Meyer-Olkin Measure of Sampling Adequacy was used to indicate the proportion of variance in the variables that might be caused by underlying factors. Then the process of variable reduction was implemented.
The literature identifies Principal Components Analysis (PCA) and Exploratory Factor Analysis (EFA)as variable reduction techniques. For this study the goal was to explain the variance and determine the optimal number of factors, or domains, which fit a set of closely related items. Therefore, the EFA method of variable reduction was selected for this study and Factor Extraction was implemented.
Extraction of Latent Factors
Exploratory Factor Analysis was conducted using the Mplus Version 8.3 software, with the maximum likelihood as its default factor extraction method. Fabrigar et al. (1999) highlight maximum likelihood as the best choice for factor extraction when the data is normally distributed as was the case for this study, in addition to its compatibility with the goodness of fit techniques of deriving the factors.
Determining the Number of Factors to Retain
Goodness-of-fit measures used for factor selection and their suggested cutoffs were based on the “EFA model fit, evaluated by the standards proposed by Hu and Bentler (1999) and Brown (2015) : RMSEA (≤0.06, 90% CI ≤0.06), SRMR (≤0.08), CFI (≥0.95), TLI (≥0.95), and the chi-square/df ratio less than 3 (Kline, 2016 )”. (Kyriazos et al., 2018, p. 1154).
Next, an initial extraction was performed to identify any irregularities in the data. Items were dropped if a loading score of less than 0.5 was reached and constructs contained less than three items.
Factor Rotation
According to Fabrigar et al. (1999) for EFA models with more than one factor, there is no single unique solution but rather there could possibly be an infinite number of different orientations of the factors that may explain the data equally well. The researcher must therefore seek to select one solution by applying the principle of simple structure (Thurstone, 1947) with each item loading highly on only one factor. For this research, by default, the factors were rotated with the oblique GEOMIN factor rotation on Mplus. The researcher defined the number of factors (from-to) in the modelling step and Mplus computed all necessary factor models in parallel. After factor rotation, additional factor extraction, and goodness -of -fit measures were applied for final factor selection, the data analysis protocols resulted in the most appropriate number of latent constructs (common factors), comprising the domain of service quality in this context.
Interpretation and Naming of the Factors (Subscales)
At the conclusion of the oblique factor rotation stage the remaining groups of variables were carefully examined with the aim of understanding the underlying construct that bound the items together. Each factor was renamed to more appropriately reflect the nature of the items grouped within, with the application of the factor pattern matrix coefficients (Field, 2000; Hair et al., 1998; Russell, 2002; Stevens, 1992, as cited in Hassan (2007), previously identified marker items, and the general standard of at least three variables per factor (Anderson & Rubin, 1956; Comrey, 1988, as cited in Hassan, 2007)).
Scale Evaluation
The third and final phase in developing the new scale, scale evaluation, consisted of three steps: tests of dimensionality, tests of reliability, and tests of validity.
Tests of Dimensionality
For this study, the degree of internal consistency of the new scale was conducted using Cronbach alpha reliability testing of the final scale items and factors. The factors (subscales) were also examined for possible multidimensionality. Due to the small sample size, splitting of the data into two samples with the use of Confirmatory Factor Analysis would not have been acceptable. However, the value of Fabrigar’s recommendation “that a confirmatory approach might be adopted later in the research program after exploratory analyses helped to more fully develop the researcher’s hypotheses” (Fabrigar, 2012 p. 12) is fully supported as the way forward for future research in this area. As a final step in the scale development process the percentage of variance explained by the factor analysis was computed and reported.
Ethical Issues
The appropriate steps were taken during the conduct of this study to ensure that the highest ethical standards were upheld, that all participants’ rights were respected, and privacy and confidentiality of the participants’ data were maintained:
- Informed Consent – An informed consent form was sent to all prospective student participants. Students received clear information on the purpose of the study and all measures taken to protect their rights as participants. Those who agreed to participate clicked ‘yes’ for their consent and they then gained access to the online survey. Those who declined and clicked ‘no’, ended their participation at this point.
- Institutional Review Board (IRB) approval: Data for this study was collected on the main campus of the university Since the study involved the use of human participants, the researcher was required to first obtain approval from the University’s IRB.
RESULTS
The focus of this study was on describing the methodology followed in identifying the dimensions of service quality that are relevant to domestic and overseas students at a local university and incorporating those dimensions into the development of a valid and reliable scale that can be used to measure service quality. In phase 1 of this mixed method study, research question #1, the qualitative research question for this study was as follows:
- How do students at a local university in Trinidad and Tobago define the determinants of service quality expectations and perceptions?
The most important requirement for a quality tertiary institution, based on frequency of student participants’ responses, was categorized as academic concerns, which encapsulated such responses as: the ability of the lecturers to deliver content, the university’s reputation in the region as a top tertiary institution, and opportunities for students’ self-directed learning. The second most frequent response from the students was categorized as ethical concerns. The third most frequently cited aspect of service quality was categorized as social concerns and encompassed such responses as the availability of extra-curricular activities, opportunities for students to interact socially, and participation in sporting facilities and clubs. In the fourth ranked position was the student support concept and the fifth was categorized as self-development concerns. The realization was made during the NVIVO data analysis that the students’ preferences paralleled to some extent the SERVQUAL themes and three additional themes (social benefits, ethics and co-creation) so the decision was taken for their inclusion as factors in the modified survey instrument along with the traditional SERVQUAL themes. These ranked students’ responses, matched to the eight themes used to create items for the quantitative survey are presented in Table 3
| Students Ranked Expectations for Tertiary Institutions matched with Quantitative Survey Themes | |||
| Response | Frequency | Rank | Matched to SERVQUAL and three emerging Themes |
| Academic concerns: Academic Standards, commitment by lecturers university’s reputation, opportunities for self-directed learning | 14 | #1 | Responsiveness
Assurance Cocreation |
| Ethical concerns Standards and Values that the institution promotes | 13 | #2 | Ethics |
| Social concerns Extracurricular activities opportunities for social interaction Diversity of the institution | 9 | #3 | Social Benefits |
| Student Support issues | 7 | #4 | Reliability, Empathy |
| Self-development concerns Avenues for self-development, Opportunities for Personal spiritual growth. | 3 | #5 | Cocreation |
| Physical concerns Safe environment Clean and attractive living conditions | 2 | #6 | Tangibles |
| Cost of education is affordable | 1 | #7 | Empathy |
| Care for and nurturing of students | 1 | #7 | Empathy |
Summary of Qualitative Data Analysis Findings – Response to Research Question#2
Research Question #2: What are the distinct factors of service quality and which items best represent these factors?
Students’ top determinants of service quality closely matched the themes of Responsiveness and Assurance from the SERVQUAL instrument along with Cocreation, a new theme was deemed most important. However, the other determinants of service quality followed closely behind in rank order with ethical standards and social benefits rounding out the top three choices in participants’ view. The students focused the least on the physical aspects of their tertiary environment (tangibles).
Item Development
Table 4 shares a brief sample of how integration occurred between the qualitative and quantitative phases as responses made by students to focus group questions were used as the basis for the items developed for the new service quality instrument.
| Table 4 Joint Display linking Qualitative data to Item Development
|
||
| Theme and Description | Focus Group Discussion | New Items |
| Tangibles – from SERVQUAL): refers to the physical facilities, equipment and appearance of personnel | Overseas B: and also, the food, very different, especially for the cafeteria, they kinda give me a bad first impression of Trinidad. I only enjoyed Trinidad food when I went out | Q0207: The campus has clean and comfortable dormitory facilities |
| Moderator: You live on the dorm?
Local B: Yeah, and that’s a next thing, the cafeteria in the dorm now (pause) is kinda rough you know, and now you Moderator: What is rough? The portions, the menu, the service, the meal Local B: Everything, |
Q0207: The campus has clean and comfortable dormitory facilities | |
| Local: Yeah, so that was me so… very stressful there…. | Q0206: The campus provides adequate spaces for students to relax | |
| Reliability (from SERVQUAL) refers to the institution’s ability to perform the promised service accurately and dependably | The registration, and the other services like that, the process should be very organize and straight forward, and they were not met, alot of miscommunication, alot of trouble, alot of, alot of ahmmm, negatives.
Moderator: Any particular area that stands out in your mind, or is that a general feeling? Local C: The whole, I haven’t met any straight forward, from registration Chuckles/laughter Overseas A: Interrupted I guess it is (inaudible…) Local C: To asking a question, in trying to get information, everything just not good. |
Q0304: There is a high quality of service offered by Administrative staff |
| Overseas D: I am looking for accuracy, and also timeliness, because if it is (pause) when I came to study, I didn’t plan to be sitting in finance office for 2 hours. | Q0304: There is a high quality of service offered by Administrative staff | |
Content validation of newly developed items
Following this first step of item development, the second step – content validation of the newly developed items, took place using five expert judges. For content validation, Fleiss’ Kappa was run to determine if there was agreement between the expert judges on whether the items were appropriately placed within each of the eight different dimensions of service quality (Fleiss, 1971). Fleiss’ kappa showed Overall Percentage agreement of 89.453. The guidelines adapted from Landis and Koch (1977) on assessing how good the strength of agreement is when based on the value of Cohen’s kappa coefficient, indicate that 0.81 -1.00 is rated as a very good strength of agreement.
Results of Scale Development
The new instrument consisted of matched pairs of items: 55 expectation items and 55 perceptions items. Following the scale adjustment based on the review of the items by the expert judges, cognitive interviews occurred and this led to a re-examination and re-wording of two of the items to increase clarity. The 116-item survey was submitted electronically yielding a response rate of approximately 14%.
Extraction of Factors using Factor Analysis
Initially, the factor ability of the 55 items in the expectation section of the survey was examined for factor ability using Pearson’s Correlation, Kaiser-Meyer-Olkin measure of sampling adequacy and Bartlett’s test of spheri city. Firstly, it was observed that all the 55 items correlated at .3 or above with at least one other item, suggesting reasonable factor ability (see Appendix D, Correlation of survey items results). Next, the Kaiser-Meyer-Olkin measure of sampling adequacy and Bartlett’s test of sphericity were used.
The KMO test result of .892, above the commonly recommended value of .6, indicated that a factor analysis should be useful with this data.
| Table 5 | ||
| Commonalities KMO and Bartlett’s Test results | ||
| Kaiser-Meyer-Olkin Measure of Sampling Adequacy. | .892 | |
| Bartlett’s Test of Sphericity | Approx. Chi-Square | 6137.619 |
| df | 1485 | |
| Sig. | .000 | |
The Bartlett’s test of sphericity was significant (χ2 (1485) = 6137.619 p < .05). Both these results are displayed in Table 5. Given these overall indicators, factor analysis was deemed to be possible and suitable for use with all 55 items.
According to Boateng et al. (2108), factor extraction is the next step after item reduction to be conducted in the scale development process. This was performed by extracting latent factors which represented the shared variance in responses among the multiple items (Mc Coach et al., 2013). The focus was on the number of factors, the salience of factor loading estimates, and the comparative magnitude of residual variances (Boateng et al., 2018). Exploratory Factor Analysis was conducted using the M plus Version 8.3 software, with the maximum likelihood as its default factor extraction method.
For the next step in factor extraction, an exploratory factor analysis (EFA) was performed on the fifty-five items of the service quality scale.
In this study, Exploratory EFA, was applied using the Mplus Version 8.3 software. The criteria selected for factor extraction were the scree test as a reference, along with factor loadings guided by basic parameters. An initial extraction was performed to identify any irregularities in the data. Items were dropped based on the following criteria: first, if a loading score of less than 0.5 was reached and secondly, constructs containing less than three items were identified.
The results of the factor loadings are presented in Supplementary Table 1. Note that the items that were retained for further Exploratory Factor Analysis (EFA) appear in bold:
The factors were rotated with GEOMIN factor rotation in the standard EFA model. From this initial GEOMIN Factor loading, cross loading items were extracted. Supplementary Table 2 presents a sample, listing four cross loading items that were ultimately removed: Though they did not load at .5 and above on any factor, they all loaded above .30 on more than one factor and were removed from the scale.
The scale now consisted of 32 items down from 55, contained within five factors. The fifth factor formerly known as ‘CoCreation’, was significant that all seven items achieved a loading score above 0.5, and seven items, all developed by the researcher, based on student focus group discussions and literature review, were all retained. Supplementary Table 3 presents the results of the GEOMIN Factor Rotation in EFA, unacceptable items being removed, and five factors retained. Those items that were retained are identified in bold.
Several items showed evidence of loading on a factor other than the ones that were used in the scale development process. Of the eight original factors only five were retained at the end of the first stage of the EFA process and three factors were eliminated with none of their items retained. Overall, the data reduction process resulted in 32 items retained in the new scale and 23 that were discarded, not having met the criteria for retention. Fourteen items did not have an adequate loading (less than 0.5) on any factor.
Factor Loading and Goodness-of-fit measures
The factors were rotated with the oblique GEOMIN factor rotation on M plus. The researcher defined the number of factors (from-to) in the modelling step and M plus computed all necessary factor models in parallel. After factor rotation, additional factor extraction, and goodness-of-fit measures were applied for final factor selection, the data analysis protocols resulted in the most appropriate number of latent constructs (common factors), comprising the domain of service quality in this context. The fit indices were used to report the results in the format set out by Kyriazos:
“EFA model fit was evaluated by the standards proposed by Hu & Bentler (1999) and Brown (2015): RMSEA (≤0.06, 90% CI ≤0.06), SRMR (≤0.08), CFI (≥0.95), TLI (≥0.95), and the chi-square/df ratio less than 3 (Kline, 2016)” (Kyriazos et al., 2018b: p. 1154).
Utilizing the Mplus software for statistical analysis, the researcher began with a one-factor model and obtained the fit statistics for this model. The researcher then fit the two-factor model and computed the test statistic for this model. Because an EFA model with fewer factors is a special case of a model with more factors (i.e., the first model is nested within the second), it was possible to conduct statistical tests to see if the addition of each factor led to a statistically significant improvement in fit. For example, this was done by computing the likelihood ratio χ 2 difference test between models where:
χ 2 = χ 2 (of model with fewer factors) −
χ 2 (of model with more factors)
df= df (of model with fewer factors) − df (of model with more factors)
The difference between the χ 2 values of the two models also follows a χ 2 distribution with a df equivalent to the difference between the df of the two models. Thus, this new χ 2 was examined to determine if the test was significant. If the test showed a lack of significance, the model with one less factor was retained. If it was significant, the model with one less factor was rejected in favour of the more complex model. This more complex model was the new comparison point against which a model with one additional factor was compared. The process terminated when a nonsignificant test was obtained. Thus, factors were only included if they provided a significant improvement over a model with one fewer factor. For my study, the four-factor model emerged as the most acceptable with the most appropriate fit statistics. Supplementary Table 4 presents a comparative summary of the one, two, three and four factor EFA models showing fit statistics results.
The pattern matrix indicated a four-component structure, unlike the initial factor loading which indicated a five-factor structure. Component loadings which are measures of the unique relationship between the latent variable (i.e., component), and the item, i.e., observed variable; (Tabachnick & Fidell, 2007), were examined for evidence of cross-loading.
A sample of the correlations among components of the remaining items, as well as the Cronbach alpha levels are displayed in Appendix D.
At this stage more meaningful names for the extracted factors were established using the technique suggested by Neill (2007).
Service Quality Scale for Higher Education (SQSHE)
Factor 1 – Student physical and mental well-being, shortened in tables to “Spm Wel”
Factor 2 – Efficiency of services provided, which is shortened in tables to “Eff Ser”
Factor 3 – Social interaction, which is shortened in tables to “Soc Int”
Factor 4 – Value cocreation, which is shortened in tables to “Val Cocre”
Testing for dimensionality and validity
Scale evaluation began with testing for scale dimension ality. This analysis was performed to assess the internal consistency of the scale. The small sample size that was utilized for this study and the limited time frame available for data collection and analysis meant that the reapplication of the four factor scale on a new sample, or, the same sample being tested at a different point in time (Boateng et al, 2018) were beyond the scope of this study. However preliminary construct validation was seen as a reasonable achievement for this phase of the research and the researcher looks forward to the future research opportunities when validation of the SQSHE can be continued with Confirmatory Factor Analysis (CFA)
Tests for Reliability of New Scale
To determine the reliability of the data collected, Cronbach’s Alpha was calculated for each subscale or service quality dimension in the new survey. Supplementary Table 5 highlights the results the Cronbach Alpha test.
Cronbach’s alpha showed the questionnaire to reach acceptable reliability, α = 0.847 – 0.883. Most items appeared to be worthy of retention, resulting in a decrease in the alpha if deleted. The one exception to this was item 5 in Factor 4 which would increase the alpha to α = 0.904. As such, removal of this item was considered for future implementation of the scale.
Summary of results for Research Question # 2:
Research Question# 2: What are the distinct factors of service quality and which items best represent these factors?
In response to this research question, it has been confirmed by EFA analysis that there are four dimensions/factors of service quality. These four factors form an underlying structure based on the variables that have undergone preliminary construct validation.
For the EFA, using factor rotation and goodness-of-fit measures with GEOMIN rotation method, resulted in the retention of four factors with 23 items. The analysis showed that Kaiser-Meyer-Olkin measure of sampling adequacy was .892, which indicates that the data were appropriate for this analysis. Bartlett’s test of sphericity was significant χ2 (1485) = 6137.619 p < .05) indicating that correlations exist among the service quality dimensions. Thirty-two items were removed from the scale because the value of the loading was < 0.5 and there were fewer than three loaded items for each factor.
The final dimensions were identified as: student physical and mental well-being, efficiency of services provided, social interaction and value cocreation. The result of EFA showed that the four-factor model was satisfactory with all measures within acceptable bounds. For the four-factor model, fit measures all achieved the prerequisite limits with Chi-square = 281.923, Chi-square/df = 149.The root mean square error of approximation (RMSEA) index was 0.063, which is within the recommended critical limit of 0.08 indicating moderate/ acceptable fit. The comparative fit index (CFI) 0.949, and TLI Tucker Lewis Index was 0.998. These values represent good fit compared with the acceptable value >0.90 for these two fit indices. SRMR = 0.031, factor loadings 0.504 – 0.940 and factor correlations ranged from 0.663 – 0.883.
The primary purpose of the present research was to extend the existing service quality literature by providing evidence that a newly developed scale to measure service quality expectations verses perceptions has preliminary construct validity. Factor analysis indicated that the newly developed service quality scale consisted of four factors, rather than the five to eight factors suggested by the initial qualitatively driven, deductive and inductive item development processes and existing literature on the topic. Exploratory factor analysis supported a four-factor structure; however, the four factors were different than the proposed structure. The new scale has been named the Service Quality Scale for Higher Education (SQSHE).
Study Strength
This newly developed Service Quality Scale for Higher Education (SQSHE) represents the first scale that assesses students’ experiences of service quality in any local university in the Caribbean environment. It includes factors other than those five measured by SERVQUAL, (tangibles, reliability, responsiveness, assurance and empathy) which have received extensive attention in the literature on service quality in higher education.
Implications of the Scale Development Process
Taken holistically, the results of the scale development process revealed that the students were concerned with both their professional and personal development at the university. They gave priority to administrative customer services, self-directed learning support and most especially social interaction opportunities. These findings support to some extent the outcomes from a project conducted here in the Caribbean region by Ali, (2012), the Caribbean Higher Education Service Quality Project, which sought to gain a better understanding of how students prioritized various service categories in higher education. In Ali’s project, students in his sample were primarily concerned with their professional and personal development, and felt their higher education institutions should concentrate on services related to providing learning support, instruction and student development experiences. (Ali, 2015)
Study Limitations
The current study was limited by the lower-than-expected student participation rate. Based in this result, it is emphasized that the results generated from this study may only apply to the context of medium sized private universities in the Caribbean region, and the generalization of findings requires further testing in a larger sample size and among other educational cultures.
DISCUSSION OF FINDINGS
There are major gaps in the literature on the dimensions that comprise service quality in the Caribbean, and the measurement of service quality using a contextually relevant instrument. Previous research in this area has emphasized the use of the SERVQUAL instrument in international countries and the need for modification to this instrument to address the unique experiences of students whenever service quality is measured in higher education. To extend the literature, this study integrated both qualitative and quantitative measures to develop a new instrument that captures student experiences, through an EFA factor analysis.The SQSHE scale consists of 23 items and four subscales (Student wellbeing, Efficiency of Services, Social Interaction and Value Cocreation). The result of EFA showed that the four-factor model was satisfactory. The root mean square error of approximation (RMSEA) index was 0.063, which is within the recommended critical limit of 0.08 indicating moderate/ acceptable fit. The comparative fit index (CFI) 0.949, and TLI Tucker Lewis Index was 0.998. These values represent good fit compared with the acceptable value >0.90 for these two fit indices. SRMR = 0.031, factor loadings were 0.504 – 0.940 and factor correlations ranged from 0.663 – 0.883. Preliminary construct validity was established.
For additional validation, it is recommended that the SQSHE be administered to a larger sample above 300 participants and Confirmatory Factor Analysis (CFA) conducted on this larger sample in order to confirm the a priori hypothesis about the relationship between the initially validated scale factor items.
This study lends support to the notion that wholesale use of the SERVQUAL instrument to measure service quality in higher education may not be appropriate. Instead, significant modification of the instrument to create a contextually robust scale is the more valid approach.
One of the most noteworthy findings of the research was that the newly developed scale differed widely from the original five-dimension SERVQUAL structure by Parasuraman (1988). Neither did it reflect the structures proposed by Lehtinen and Lehtinen (1991). Instead, of the eight original dimensions of service quality, four dimensions are identified as valid for this study, and of these, Factors 3 and 4 were by far the most important as evidenced by them displaying the highest factor loadings during the factor analysis process. The findings of EFA support the application of a four-dimension model for measuring service quality.At the start of this study the original scale developed to measure service quality expectations and perceptions contained all five SERVQUAL factors, tangibles, reliability, responsiveness, assurance and empathy. The students’ responses during the focus group interviews and the NVIVO data analysis led to the initial inclusion of all five traditional SERVQUAL dimensions on the scale. However, a surprising result of this study was that following the item reduction and factor analysis phases only two of those original SERVQUAL themes were retained as factors of service quality. Elements of the tangibles dimension (five items on physical characteristics and two items from the reliability dimension (courtesy and caring by administrative staff) displayed moderate factor loadings to form the new scale factor now called Student physical and mental well-being or Stuwel.
Parasuramam et al. (1988) defined tangibles as “the appearance of the servicescape and the physical facilities and materials.” (as cited in Chavan et al., p. 163). For most international research studies, students had much to say regarding those common tangible aspects of university life that shaped their perceptions of a high-quality tertiary experience. However, it was interesting to note that for this study, during the three focus group interviews there was minimal reference by both overseas and domestic students to the physical facilities of the university in shaping their expectations and perceptions of service quality. When asked at the end of each focus group meeting to list in order of importance the top three qualities they consider when evaluating service quality at a tertiary institution, the accumulated data indicated that tangibles, identified by students as Safe, clean and attractive living conditions /environment, ranked as number 6 out of 7, quite low on their list of priority concerns. Though further research would be required in this area to form conclusions, it may be reasonable to suggest that in the present sample of students their evaluation of the service quality of their tertiary experience had less to do with the tangible aspects and more to do with the interrelationships and non-academic experiences whether involving lecturers, peers or support staff. Studies by Chavan et al. (2014) and others based on international and domestic students service quality experiences in countries like Australia indicated differences in results when compared with this study. Students there, especially international students were strongly influenced by tangible factors (such as an attractive campus environment; a modern library; fast, reliable Internet services; convenient access to public transport and well-developed student well-being services, among other similar factors) in their evaluations of a quality tertiary experience. In contrast, however, this present study reflects to some extent the findings of research done by Ongo (2019) in the US. His study found that international students showed less concern about the appearance and neatness of the institution’s physical facilities, equipment, personnel and other tangibles, once their institutions had higher levels of reliability and empathy (Ongo, 2019)
RECOMMENDATIONS FOR HIGHER EDUCATION INSTITUTIONS IN THE CARIBBEAN
Students are considered the key stakeholders of any higher education institution, consequently a clear understanding of their needs and wants would be vital to the success and development of the institution in the longer term (Khattab 2019). The findings of this study have indicated that in this local Caribbean university at least, “service quality is a strategic issue that required continuous measurement of service expectations” (Jusoh et al., 2004, p. 261, as cited by Ali, 2015), because “the students’ perceptions of SQ elements change over a period of study” (Kontic, 2014 p. 651). So, it is imperative that institutions of higher learning keep up with a continuous service quality improvement system. Rather than engage in piecemeal, isolated and uncoordinated improvements, it has been suggested that a holistic approach within the context of continuous quality improvement should be adopted. Bourne (2011) highlights the paradigm shift in managing quality that must occur to foster an institution-wide quality culture transformation that is cost-efficient and sustainable rather than a series of disconnected project initiatives. continuous improvement or continuous quality improvement (CQI) may be preferable. (Ali, 2015; Grigoroudis& Siskos, 2010; Schneider & White, 2004; Ali, 2021). Such an approach would ensure that tertiary institutions remain poised to deliver high service quality to students that are continuously responsive to the constantly monitored but changing needs of the student population, which is an imperative for all tertiary institutions in the competitive higher education environment that currently exists in the Caribbean. This would be an effective strategy to develop student loyalty towards the institution and promote the spread of positive word-of-mouth feedback, which is an influential “promotional conduit” (Asim & Kumar, 2018 p. 80) especially in the close-knit societies of the Caribbean. In order to establish a CQI framework for continuous improvement in response to the service quality deficits that this research revealed, an institution wide improvement strategy is imperative, incorporating administrative commitment and support as evidenced by strategic goal setting and allocation of resources by the institution’s governing body. In addition, the institution may benefit from the implementing a continuous improvement system that is modeled after international Quality Management Systems while incorporating the institutions local needs and external regulatory agency requirements.
REFERENCES
- Ali, E. (2015). Transforming higher education in the Caribbean: The total quality management/service quality model. In A. K. Perkins (Ed.), Quality in higher education in the Caribbean, UWI, pp. 255-268.
- Ali, E. (2021). A critical review of strategic quality improvement practices in Caribbean higher education institutions. In S. I. Gift (Ed.), Caribbean quality culture: Persistent commitment to improving higher education (pp. 260-273). UWI Press.
- Asquith, J.A. (1997). The effects of group size on the outcome of focus group sessions. Management Research News, Vol. 20 No.12, pp.1-15. https://doi.org/10.1108/eb028582
- Boateng, G. O., Neilands, T. B., Frongillo, E. A., Melgar-Quiñonez, H. R., & Young, S. L. (2018). Best practices for developing and validating scales for health, social, and behavioral research: A primer. Frontiers in Public Health, Vol. 6, p.149. https://doi.org/10.3389/fpubh.2018.00149
- Bunce, L., Baird, A., & Jones, S. (2017) The student-as-consumer approach in higher education and its effects on academic performance, Studies in Higher Education, Vol.42 No. 11, pp.1958-1978. https://doi.org/10.1080/03075079.2015.1127908
- Chavan, M., Bowden-Everson, J., Lundmark, E. & Zwar, J. (2014). Exploring the drivers of service quality perceptions in the tertiary education sector: Comparing domestic Australian and international Asian students. Journal of International Education in Business,Vol. 7 No.2, pp.150-180. https://doi.org/10.1108/JIEB-02-2014-0004
- Çerri, Shpetim. (2012). Assessing the quality of higher education services using a modified SERVQUAL scale. Annales Universitatis. https://doi.org/:10.29302/oeconomica.2012.14.2.32.
- Creswell, J. W. (2014). Research design: Qualitative, quantitative and mixed methods approaches (4th ed.). Sage.
- Donaldson, B. & McNicholas, C. (2004). Understanding the postgraduate education market for UK‐based students: a review and empirical study. Int. J. Nonprofit Volunt. Sect. Mark., Vol.9, pp. 346-360. https://doi.org/10.1002/nvsm.259
- Fabrigar, L. R., Wegener, D. T., MacCallum, R. C., & Strahan, E. J. (1999). Evaluating the use of exploratory factor analysis in psychological research. Psychological Methods, Vol.4No.3, pp. 272–299. https://doi.org/10.1037/1082-989X.4.3.272
- Farahmandian, S., Minavand, H., &Afshardost, M. (2013). Perceived service quality and student satisfaction in higher education. IOSR Journal of Business and Management, Vol. 12, pp. 65-74. https://doi.org/10.9790/487X-1246574
- Fleiss, J. L. (1971). Measuring nominal scale agreement among many raters. Psychological Bulletin, Vol.76 No. 5, pp. 378-382. https://doi.org/10.1037/h0031619
- Hassad, R. (2007). Development and Validation of a Scale for Measuring Instructors’ Attitudes toward Concept-Based or Reform-Oriented Teaching of Introductory Statistics in the Health and Behavioral Sciences [Unpublished doctoral dissertation]. Touro University International.
- Hayashi, P., Abib, G., & Hoppen, N. (2019). Validity in qualitative research: A processual approach. The Qualitative Report, Vol.24 No.1, pp. 98-112. https://nsuworks.nova.edu/tqr/vol24/iss1/
- Hu, L. T., & Bentler, P. M. (1999). Cutoff Criteria for Fit Indexes in Covariance Structure Analysis: Conventional Criteria versus New Alternatives. Structural Equation Modeling, Vol.6, pp.1-55. http://dx.doi.org/10.1080/10705519909540118
- Kyriazos, T. A. (2018). Applied Psychometrics: Writing-up a factor analysis construct validation study with examples. Psychology, Vol.9 No.11, pp. 2503-2530. https://doi.org/ 10.4236/psych.2018.911144
- Landis, J., & Koch, G. (1977). The measurement of observer agreement for categorical data. Biometrics, Vol. 33No. 1, pp. 159-174. https://doi.org/10.2307/2529310
- McCoach, D. B., Gable, R. K., & Madura, J. P. (2013). Instrument development in the affective domain. school and corporate applications, (3rd ed.). Springer
- Morgado, F. F., Meireles, J. F., Neves, C. M., Amaral, A. C., & Ferreira, M. E. (2017). Scale development: Ten main limitations and recommendations to improve future research practices. Psicologia: Reflexão e Crítica, Vol. 30 No. 3, pp.1-20. https://doi.org/10.1186/s41155-016-0057-1
- Morse, J. M. (2017). Essentials of qualitatively driven mixed-method designs. Routledge.
- Neill, J. (2007). Writing up a factor analysis. Centre for Applied PsychologyUniversity of Canberra. Creative Commons Attribution 2.5 Australia http://creativecommons.org/licenses/by/2.5/au/
- Nunnally, J. C., & Bernstein, I. H. (1994). Psychometric theory (3rd ed.). McGraw Hill.
- Ongo, M. O. (2019). Examining perceptions of service quality of student services and satisfaction among international students at universities in Indiana and Michigan.Dissertation. Andrews University. https://digitalcommons.andrews.edu/dissertations/1675
- Parasuraman, A., Zeithaml, V.A. & Berry, L.L. (1988). SERVQUAL: a multiple-item scale for measuring consumer perceptions of service quality, Journal of Retailing, Vol.64 No.1, pp.12-40.
- Parasuraman, A., Zeithaml, V.A. & Berry, L.L. (1991). Refinement and reassessment of the SERVQUAL scale. Journal of Retailing, Vol.67 No.4, pp. 420-50.
- Pereda, M., Airey, D., & Bennett, M. (2007). Service quality in overseas education: The experience of overseas students. Journal of Hospitality, Leisure, Sport and Tourism Education, Vol. 6 No.2, pp. 55 – 67.
- Tabachnick, B. G., & Fidell, L. S. (2007). Using multivariate statistics. (5th ed.). Allyn & Bacon/Pearson Education.
- Thurstone, L. L. (1947). Multiple factor analysis. University of Chicago Press.
- Whelan, C. (2016). Organisational culture and cultural change: A network perspective. Australian & New Zealand Journal of Criminology, Vol.49 No.4, pp. 583–599. https://doi.org/10.1177/0004865815604196
APPENDIX
APPENDIX A
Questions for Focus Group Interviews
Section 1: Motives for pursuing higher Education
- Why did you decide to pursue tertiary /higher education? Prompts: what motivated you?
- Why did you decide to pursue higher education here at USC, a private Christian University?
- Prompts for international students: Why did you decide to leave your home country to seek tertiary education?
Section 2: Expectations for the tertiary experience
- Did you have any expectations for your physical environment at the university? What were they?
- What were your major academic expectations regarding this tertiary education experience? E.g. the degree of difficulty courses and classes would entail.
- What were some of your expectations regarding campus life?
- What were some of your expectations regarding the quality of services?
- What were some tangible aspects of university life that you considered to be relevant to a quality university experience in terms of faculty provision?
Section 3: Social Benefits (a new theme not present in SERVQUAL)
- The prospect of making friends at USC was that an important expectation to you? Did you expect to make friends from outside your home territory?
- Did you feel lonely, miss your former friends, and find it difficult to fit in on this campus?
- Did you expect to form social networks, join clubs?
- Do you think cultural barriers added or contributed in any way to your ability to make friends?
- International students: Do you think your cultural background in terms of your traditional ways of living your life influenced your expectations in coming to study here?
Section 4: Co- Creation (a new theme from “Exploring the Drivers…2014)
- How were you involved in co-creation?
- Was this one of your expectations that you would be required to become involved in the co-creation of your educational experiences?
- Was active participation one of your expectations as well as self-directed learning?
Final Request
Each of you has been given a small card. On this card please write your top three requirements for a quality tertiary experience, ranking them from one to three with number one as the most important and three as the third most important. Please also write on the card whether you are a local or overseas student.
APPENDIX B
Listing of new scale (with newly created items highlighted in bold)
Dimension #1 – Tangibles
- The lecturers have access to modern or the latest equipment
- The appearance of the physical facilities of the university is attractive
- Lecturers and Administrative staff are well dressed and neat in appearance
- The Library has the latest resources in my area of interest
- The classrooms are well lit, and well ventilated
- The campus provides adequate spaces for students to relax
- The campus has clean and comfortable dormitory facilities
- The institution’s offices display convenient operating hours
Dimension #2 – Reliability
- When something is promised by a certain time, it is always provided by the Lecturers or Administrative staff
0302 When students have problems, Administrative staff members are courteous, even if not able to help
0303 Administrative Staff personnel show a sincere interest in solving students’ problems
0304 There is a high quality of service offered by Administrative staff
0305 Lecturers provide clearly stated requirements for course and programme success
0306 The university maintains accurate student records
0307 Courses are taught by highly knowledgeable lecturers
Dimension #3 – Responsiveness
02201 Students are informed of schedules and changes in schedules in advance
- Service hours of the university’s learning facilities accommodate all students
- 02203 Administrative staff are never too busy to respond to student requests
- Administrative staff respond promptly to student queries
- Lecturers give prompt feedback to students on assignments and assessments
Dimension #4 – Assurance
- The behavior of lecturers and administrative staff instill confidence
- Students can trust lecturers and administrative staff
- Lecturers and administrative staff are friendly and polite
- Lecturers are dependable
- The students feel safe on campus
- Student complaints are treated promptly and fairly
- Opportunities exist for student to give feedback on their level of satisfaction with key university experiences
Dimension #5 – Empathy
- Lecturers provide personal attention to every student
- Lecturers allocate sufficient office-hours to cater to students’ inquiries
- Administrative staff members give students individual attention
- Lecturers understand the specific needs of students
- University policies are student-centered and fair
- Needy students have access to financial and other forms of assistance
- Support for at risk students is provided through university policies and practices
Dimension #6 – Social Benefits
- The University provides opportunities for students to interact socially outside of the classroom
- Social activities for students are scheduled at convenient times
- It is easy to become involved in campus social organizations
- The university has a friendly and welcoming atmosphere
- Students can choose to participate in a wide range of social activities provided by the university
- The university organizes social activities that students from various ethnic and cultural backgrounds can enjoy
- The university provides opportunities for students to showcase and share their non-academic talents and abilities
Dimension #7 – Ethics
0701.The university upholds high standards of integrity
- The university’s reputation as a quality tertiary institution is promoted
- A degree from this university is well recognized locally and abroad
- The university’s ethical standards are practiced by members of faculty and staff in their interactions with students
- Students can participate in a wide range of scheduled activities that promote the moral values of the University
- Students are treated with impartiality by lecturers in the classroom
- Students are treated with impartiality by administrative staff when requesting assistance
Dimension #8 – Cocreation
- Students receive an educational experience that goes beyond the classroom
0802 Real-world work experiences are integrated into each student’s’ programme of study
- Internships/ practicums are integrated into the structure of each university programme.
- Leadership skills are nurtured through the student government and other activities
- Community involvement and volunteerism are promoted and facilitated by the university
- Lecturers provide opportunities for students to engage in self- directed learning
- Lecturers encourage students to “think outside the box”
APPENDIX C
Joint Display #1
Integration of focus group interview comments into identification of domains and item generation:
| Factor Name | Focus Group Interview Comments | Survey Item/s |
|
International B: and also, the food, very different, especially for the cafeteria, thy kinda give me a bad first impression of Trinidad. I only enjoyed Trinidad food when I went out | Q0207 |
| When I first came to USC, I didn’t know much about the service of the cafeteria, and (deep sigh) and ahmmm, first of all I didn’t even know that they don’t serve meat, | Q0207 | |
| You live on the dorm:
Local B: Yeah, and that’s a next thing, the cafeteria in the dorm now (pause) is kinda rough you know, and now you Moderator: What is rough? The portions, the menu, the service, the meal Local B: Everything, |
Q0202, Q0207 | |
| Local: Yeah, so that was me so… very stressful there…. | Q0206 | |
| Assurance | yeah that kind, and the admissions, I really thought that they would have personnel, to assist you in selection of the courses and stuff like that | Q0303 |
| They are always willing to assist, and they always make themselves available to ensure that they pass.
the lecturers really help you. They always avail themselves. |
Q0404 | |
| You can feel comfortable speaking with them even if the course is difficult. My History and Social teacher flat out told us that the resources they gave to us were too complicated, but he was honest and offered to highlight the relevant information to us | Q0401 | |
| Social Benefits | International A. USC has a very active campus life, there’s never not anything to do at USC, and there is always activity. Sometimes I think, sometimes too much, | Q0601, Q0605, Q0606 |
| Ok, before I came to USC, I went on the website to see the different clubs and stuff, and I was like ok | Q0606, Q0607 | |
| Local C: Yes, ‘cause, he said that there is a lot to do in USC, and if I am correct he said, too much, and I am here thinking, what activities (laughs) | Q0605 | |
| International B: I realize that when there are activities, or someone, is more dorm student you find and not sure if the dorm, or its not well communicated, to the other day students that are not apart of the dorm. But, I don’t know, I don’t see them. yeah… | Q0602, Q0606 | |
| Ethics | International C: The second thing I had to say, you asked about, what are our expectations for services, and coming a Seventh-day Adventist Christian Institution, I expected a little bit more spirituality, | Q0704, Q0701 |
| Local A: I agree with her, I am not a Seventh-day Adventist and for me, its ok, I understand that you’all hold certain religious beliefs, and there are certain expectations that, to be met and so forth. It’s ok that you will have like your worship sessions, on a morning, on the dormitory, but I’m not of that religion, please give me the option of wanting to come, not forcing me to com, and if I don’t come with a citation, like I am giving trouble, that’s not really, that’s not nice. | Q0701, Q0705, Q0707 | |
| Local A: So I expected more choice, | ||
| Local: At least, make it my choice to want to come, and be apart of it, encourage me to be apart of it. Not force me to be apart. | ||
| Moderator: But was there anything written, that says students must attend so and so, and then you sign, that you agree
Local A: Yes, but it is expected, so if you don’t go to worship session you get a citation. I don’t find getting a citation isn’t fair |
Q0707 | |
| show me that effort in respecting your religion, try to show me that respect too about my religion. | Q0701, Q0505 | |
| Moderator: So are you looking at accreditation, if it is accredited or not?
International B: If it is going to be recognized |
Q0703 | |
| Responsiveness | International D: a lot of things like that, get cancelled, and, well, I have often said that the calendar, for the year, should not be coming out in November, it should be there before September | Q02201 |
| Reliability | The registration, and the other services like that, the process should be very organize and straight forward, and they were not met, alot of miscommunication, alot of trouble, alot of, alot of ahmmm, negatives.
Moderator: Any particular area that stands out in your mind, or is that a General feeling? Local C: The whole, I haven’t met any straightforward, from registration Chuckles/laughter Intenational A: Interrupted I guess it is (inaudible…) Local C: To asking a question, in trying to get information, everything just not good. |
Q0304 |
| International D: I am looking for accuracy, and also timeliness, because if it is (pause) when I came to study, I didn’t plan to be sitting in finance office for 2 hours. | Q0301. Q0304 | |
| Empathy | International D: and even here, you will hear that I know its university and there is going to be x amount of students in the class, a rough figure, but lecturers still took time out, if you shrug, they would say hey, I see you shrugging, at least for me, you have, they may get oversight but you do have those lecturers that I came in contact with, they see you struggling, I could go to them, anytime, I can send them a whatsapp message, and I will get a response | Q0501,Q0502, Q0507 |
| International…but with USC, when I came, I was expecting the same thing, like, the teacher will come, teach what they hadda(sic) to teach, and you have to do everything else for yourself, but when I came here, I see there was a different approach, in that, the teachers are actually willing to work with people, they would actually make time for those like, if you slow in something, if you miss something, they would more lenient, and they are more willing to help you with whatever aspect you had that you couldn’t function. | Q0504 | |
| CoCreation | International: I expected the lecturers to challenge me. I realized in some classes, I just wanted to sleep, and it wasn’t always because I was tired. | Q0806, Q0807 |
| International A: Let the students do the research, let them come and present the topic to the class, and then you probably, can give them a grade, or something. And things like that keeps persons involved in the class and help them to remember some of the stuff that they learnt. | Q0806 | |
| Local D: just lose out a whole, ahmm experience, you know, like I wouldn’t get with the in class, you know, I find like, with online courses, online courses, you have to, literally, teach yourself. And yeah….
Moderator: Is that good? Local B: No, that’s terrible. |
Q0806 | |
| Local C: For a lot of my classes I feel like I am just doing through the motions, like its just take in, take in, exam, pass, next class | Q0702. Q0806 | |
| Local C: its alot, like most, but like now and then I may find one class out of the blues that really take you by storm and you have to real think about it. You have to go do the research, you have to go out into the field, and you have to do this and that, and it’s like once, not every semester, once a year, that I may have one class like that.
Moderator: and you fell that you would have liked more Local C: I would have preferred more like that |
Q0806 | |
| At practicum I realized the passion I had for community service.
the experience at practicum that USC exposes you to is really good. You learn a lot, meet people who tell you their problems and some of them you may identify with and some really break your heart, knowing the challenges that they experience. USC does expose you. |
Q0801, Q0802 Q0803 | |
| With Psychology, there is a great emphasis placed on volunteer work, so, for the past three semesters, I have done voluntary work … We volunteered with special needs children at D’Abadie, the elderly and special needs children in Port of Spain. I enjoy those interactions. | Q0805 | |
| What I like about some lecturers, they force you to interact by stirring up controversial topics to subconsciously get students involved in the conversation | Q0806. Q0897 | |
| It is, it is, you are functioning like a normal employee, it’s just that you are being employed as a student worker, that’s the term you use, but you are actually a worker. | Q0802 | |
| Because when I look at my job resume the other day, I smiles, I said ok, it’s like I am a full-time worker, but at the same time, we just developing the skills. When we are finished and we go out into the real world of work, you have enough to say, I can do this, I can do that, my organizational skills are on point | Q0804 | |
| Expectations versus peceptions | International C: but coming here, now actually sitting in a classroom. It’s way different | |
| International B: Just like everyone else, I had my fair share of negatives, I started at the extension site in Guyana, and for some reason, whenever you pay them, the money takes so long to show up on your account, and there is always some delay in the registration process, so when I came over here, I thought it would have been a little better, but it was worse | Expectation > Perceptions | |
| International A: So, before I came, there are graduates from USC back home and they will come and tell me USC hard and USC ‘dis’, and you on your own, and you not getting help, and the lecturers ‘dis’, and lecturers ‘dat’; and they would, a lot of negative, so I came (pause) with a mind-set, “boy, I got to be, I gonna be on my own” and I programme my mind. I plan myself, ‘dis’, ‘dat’, ‘dat’, and ‘tera, tera’, “you going to be by yourself”, and I may have to stay up late, and late nights, and stuff, whatever… | Academic Rigor: Expectations > perceptions | |
| International A: Yeah. I came with my essay, my recommendations from back home. I expected monitoring. I expected follow up counselling for pastors, cause we need that. I expected for them to really challenge us more in a kinda (sic) way cause being classes, very it’s a… so I expected more, yeah
Moderator: and you didn’t get that, your expectations was not met, and you found that it was easy for you to get in to do theology. |
||
| International B: Good gosh, but they are doing it, and so, I think, that’s something, that I am disappointed with, they should have it a little rigorous. | Ethics: Expectations > perceptions | |
| International B: and also back home we have a culture of everybody you pass, you must say hello, good morning, whatever it is, but here, even some theology student they pass you, watch you in your face like and they won’t even say anything. So those were some of the things I was very surprised about when I came here. | Social Benefits, Ethics: Expectations > perceptions | |
| International D: The academic side of USC, now, I, USC has general eds that UWI did not have, that I appreciated, I needed it, at the end of the day, you are getting more than a degree, you getting a holistic take from the USC, than UWI, I really like that. I started in Antigua and the classes were a whole lot smaller, and there was that one-on-one, I didn;texpect what I got, what I got superseded my expectations. | Perceptions > Expectations | |
| International D: and even here, you will hear that I know its university and there is going to be x amount of students in the class, a rough figure, but lecturers still took time out, if you shrug, they would say hey, I see you shrugging, at least for me, you have, they may get oversight but you do have those lecturers that I came in contact with, they see you struggling, I could go to them, anytime, I can send them a WhatsApp message, and I will get a response | Pereceptions> expectations | |
| International…but with USC, when I came, I was expecting the same thing, like, the teacher will come, teach what they hadda to teach, and you have to do everything else for yourself, but when I came here, I see there was a different approach, in that, the teachers are actually willing to work with people, they would actually make time for those like, if you slow in something, if you miss something, they would more lenient, and they are more willing to help you with whatever aspect you had that you couldn’t function. | Pereceptions> expectations | |
| Local C: nuff what, what she says, I agree with a lot, because that was also my take on it, because when I went to secondary school, they will say the same thing, but I said, (inaudible) not to scare you but its more like help you to be more proactive, because it would be like, the work was in University, it will help you to be like, you are on your own, basically what she said. I was scared to, but when I came here, I wasn’t afraid, but kinda, unsure of what to expect, I was very, it was a new experience and everything, but the teachers are here, and the work too, even if you had trouble with work, they were available in their office, information was available, and actually, they had free time, and that took me by surprise, and something I really appreciate from this school. | Pereceptions> expectations | |
| Motives of local Vs International | International A: I am pursing studies in Bachelors of Arts degree in Theology, with a minor in psychology. The reason why I am doing this study why I pursue tertiary education is because I have a goal in mind. A goal to… If you know St. Vincent background, not many persons would seek to pursue tertiary education and the standard, and so one of the reason I left the world of work, to come here was 1) to prove and to show a classroom of students, a class I used to teach, of the importance of striving for excellence and seeking to develop myself… Be a witness to them. It is still possible and necessary to pursue tertiary education. | Motives – to motivate others back home, to fulfill personal goals |
| Internation A: I realize USC is much cheaper, and the standards that they have is Seventh-day Adventist, based and I get to do theology, so where else, but USC. | Motives: Cost, Reputation for providing Quality Christian education, availability of desired programme | |
| International B: Sure, my name is Euwin Isaacs, and I am from Guyana, and I am also pursuing a Bachelor degree in Theology with a minor in psychology. I was motivated to obtain a tertiary education because of my area of work. I love to work with students and I wanted to qualify myself more, so that I would be able to help them prove or overcome whatever difficulties they may have. Because I am a big fan of assisting persons who are experiencing mental challenges and so on. And throughout my life, I have had a lot of experience in assisting persons to overcome various difficulties, so that has motivated me to seek higher education, so that I can effectively assist and help persons, wherever I can. | Motives: desire to improve qualifications, assist others | |
| International B: Well, firstly, I chose USC because they offer the programmes I wanted. Its very hard to find an, ahmmm, Seventh-day University in my country, that actually that has the standard that USC is upholding right now, and also USC does a very good job of painting a Christian image to the world, when I saw USC first, I thought it was (pause) ahmm, one of the best universities you can think about, itsgonna be very spiritual and so on, and it is, with minor fall backs. | Motives: availability of programmes, Christian institution, reputation internationally, | |
| International D: I was 95% enrolled in UWI, and I started going to class, and then a scholarship was offered, it was at the time, working out to be more economical coming to USC. So that’s why I made the switch, plus, ahmm, I am looking at how UWI also has a (pause) open campus in Antigua, and it would have been the same, it would have been one year for study, then travel down to Barbados for 2 years, ahmmm. | Motives: closer contact with lecturers, Cost, location, and complexity | |
| International D: how much money I paid, pass or fail? So I felt pressured form that onset, another class, if you want to stay (inaudible) you don’t have to come to my class, you just need to hand in my assignments, and write my exams. Am like, ahmm ok, I didnt feel like, (pause) I felt like I was just a number | Motives: cost, closer connection with lecturers, personal touch | |
| Local A: So my name is Kishawna Edwards, and I am doing a degree in Human Resource Management, ahmm, the reason why I want to pursue tertiary education is because I come from a family where most persons don’t even finish high school, and I was fortunate enough to atleast go to A’level and I wanted to make a difference in my family by reaching far, and also I want to do Human Resource Management, because I wanted to work in the Trrinidad and Tobago Police Service, where because, I want to like, employ persons who are more fit for the job and willing to be more devoted and commited to making the country a better place. | Motives: First generation tertiary student, to motivate family members, contribute to needs of country | |
| Local A: Well, first my mommy was kinda pushing me to do a degree in Medicine, but that wasn’t me, but I chose USC because in comparison to other schools, it is more Christian oriented, because I am from a Christian background, because of my mother, and because of the accomodation it had for me. With the other Universities, it would have more been like a part time and it would have taken me longer, so why USC, if I would have done it, I would be able to do it full time and finish faster.
Moderator: Are you from Trinidad or Tobago? Local A: Tobago |
Motives: Parental influence, Cost effectiveness, Christian environment | |
| Local B: Good morning everyone, My name is Kelsey Spencer, I am from Trinidad, and my major is Business Management, ummm, the reason why I, ahmm, the reason why I study that is because, my mother she is a business owner herself, and she is a single mother, so you know, I look up to her, and I wanted to (pause) carry that mantel you know, like, when she passes it on to me, I should be able to, (pause) ahmmm, be readily, you know, knowledgeable of how to actually manage the business efficiently, so I wanted to come here at to study business management to carry on her legacy. | Motives: Parental influence, Christian environment, career fit to continue family business. | |
| Local C Male: Ahmm, I chose USC, because of my religion, Seventh-day Adventist, and also because other schools have exams on like Saturday and stuff, | Religious fit, alignment with religious convictions, availability of desired programme |
APPENDIX D
Correlations
Domain #1 – Tangibles
| Correlations | |||||||||||
| The lecturers have access to modern or the latest equipment | The appearance of the physical facilities of the university is attractive | Lecturers and Administrative staff are well dressed and neat in appearance | The Library has the latest resources in my area of interest | The classrooms are well lit, and well ventilated | The campus provides adequate spaces for students to relax | The campus has clean and comfortable dormitory facilities | The institution’s offices display convenient operating hours | ||||
| The lecturers have access to modern or the latest equipment | Pearson Correlation | 1 | .515** | .277** | .408** | .460** | .384** | .320** | .392** | ||
| Sig. (2-tailed) | .000 | .000 | .000 | .000 | .000 | .000 | .000 | ||||
| N | 223 | 221 | 223 | 223 | 223 | 223 | 222 | 223 | |||
| The appearance of the physical facilities of the university is attractive | Pearson Correlation | .515** | 1 | .323** | .467** | .528** | .571** | .423** | .449** | ||
| Sig. (2-tailed) | .000 | .000 | .000 | .000 | .000 | .000 | .000 | ||||
| N | 221 | 223 | 223 | 223 | 223 | 223 | 222 | 223 | |||
| Lecturers and Administrative staff are well dressed and neat in appearance | Pearson Correlation | .277** | .323** | 1 | .219** | .220** | .282** | .177** | .334** | ||
| Sig. (2-tailed) | .000 | .000 | .001 | .001 | .000 | .008 | .000 | ||||
| N | 223 | 223 | 225 | 225 | 225 | 225 | 224 | 225 | |||
| The Library has the latest resources in my area of interest | Pearson Correlation | .408** | .467** | .219** | 1 | .399** | .441** | .334** | .409** | ||
| Sig. (2-tailed) | .000 | .000 | .001 | .000 | .000 | .000 | .000 | ||||
| N | 223 | 223 | 225 | 225 | 225 | 225 | 224 | 225 | |||
| The classrooms are well lit, and well ventilated | Pearson Correlation | .460** | .528** | .220** | .399** | 1 | .567** | .417** | .495** | ||
| Sig. (2-tailed) | .000 | .000 | .001 | .000 | .000 | .000 | .000 | ||||
| N | 223 | 223 | 225 | 225 | 225 | 225 | 224 | 225 | |||
| The lecturers have access to modern or the latest equipment | The appearance of the physical facilities of the university is attractive | Lecturers and Administrative staff are well dressed and neat in appearance | The Library has the latest resources in my area of interest | The classrooms are well lit, and well ventilated | The campus provides adequate spaces for students to relax | The campus has clean and comfortable dormitory facilities | The institution’s offices display convenient operating hours | ||||
| The campus provides adequate spaces for students to relax | Pearson Correlation | .384** | .571** | .282** | .441** | .567** | 1 | .471** | .549** | ||
| Sig. (2-tailed) | .000 | .000 | .000 | .000 | .000 | .000 | .000 | ||||
| N | 223 | 223 | 225 | 225 | 225 | 225 | 224 | 225 | |||
| The campus has clean and comfortable dormitory facilities | Pearson Correlation | .320** | .423** | .177** | .334** | .417** | .471** | 1 | .407** | ||
| Sig. (2-tailed) | .000 | .000 | .008 | .000 | .000 | .000 | .000 | ||||
| N | 222 | 222 | 224 | 224 | 224 | 224 | 224 | 224 | |||
| The institution’s offices display convenient operating hours | Pearson Correlation | .392** | .449** | .334** | .409** | .495** | .549** | .407** | 1 | ||
| Sig. (2-tailed) | .000 | .000 | .000 | .000 | .000 | .000 | .000 | ||||
| N | 223 | 223 | 225 | 225 | 225 | 225 | 224 | 225 | |||
| **. Correlation is significant at the 0.01 level (2-tailed). | |||||||||||
| Case Processing Summary | |||
| N | % | ||
| Cases | Valid | 220 | 97.3 |
| Excludeda | 6 | 2.7 | |
| Total | 226 | 100.0 | |
| a. Listwise deletion based on all variables in the procedure. | |||
| Reliability Statistics | |
| Cronbach’s Alpha | N of Items |
| .846 | 8 |
Correlation result – All items acceptable, all items above .300. Reliability = .846 Acceptable
Supplementary Table 1. EFA Factor loadings
| Factor | Item | 1 | 2 | 3 | 4 | 5 | 6 | 7 | 8 |
| 0201 | The lecturers have access to modern or the latest equipment | 0.467* | -0.006 | -0.042 | 0.245* | 0.043 | -0.050 | 0.074 | -0.001 |
| 0202 | The appearance of the physical facilities of the university is attractive | 0.576* | 0.076 | 0.051 | 0.414* | -0.027 | 0.039 | -0.119 | -0.185 |
| 0203 | Lecturers and Administrative staff are well dressed and neat in appearance | -0.042 | 0.238* | 0.350* | 0.104 | 0.082 | -0.094 | 0.125 | -0.154 |
| 0204 | The library has the latest resources in my area of interest | 0.466* | 0.010 | -0.070 | 0.238* | -0.017 | 0.026 | 0.045 | 0.033 |
| 0205 | The classrooms are well lit, and well ventilated | 0.533* | 0.077 | -0.046 | 0.056 | 0.005 | 0.165 | 0.143 | -0.017 |
| 0206 | The campus provides adequate spaces for students to relax | 0.565* | 0.130 | -0.031 | 0.217* | 0.001 | -0.025 | 0.115 | -0.031 |
| 0207 | The campus has clean and comfortable dormitory facilities | 0.601* | -0.039 | 0.025 | 0.004 | -0.003 | -0.067 | 0.154 | -0.017 |
| 0208 | The institution’s offices display convenient operating hours | 0.504* | 0.246* | 0.081 | -0.018 | 0.020 | -0.043 | 0.071 | 0.003 |
| 0301 | When something is promised by a certain time, it is always provided by the Lecturers or Administrative staff | 0.415* | 0.156 | 0.189* | 0.106 | -0.119 | -0.071 | 0.126 | 0.035 |
| 0302 | When students have problems, Administrative staff members are courteous, even if not able to help | 0.073 | 0.561* | 0.380* | -0.019 | 0.018 | -0.069 | 0.039 | 0.054 |
| 0303 | Administrative staff personnel show a sincere interest in solving student’s problems | -0.027 | 0.591* | 0.331* | -0.003 | 0.025 | -0.019 | 0.110 | 0.118 |
| 0304 | There is a high quality of service offered by Administrative staff | 0.173 | 0.599* | 0.323* | -0.033 | -0.070 | -0.001 | -0.014 | 0.106 |
| 0305 | Lecturers provide clearly stated requirements for course and programme success | 0.361* | 0.014 | -0.019 | -0.147 | 0.247* | 0.150 | 0.052 | 0.274* |
| 0306 | The university maintains accurate student records | 0.304* | 0.204* | 0.014 | -0.108 | 0.038 | 0.047 | 0.413* | 0.076 |
| 0307 | Courses are taught by highly knowledgeable lecturers | 0.360* | -0.034 | 0.189 | -0.147 | 0.334* | -0.041 | -0.063 | 0.095 |
| 02201 | Students are informed of schedules and changes in schedules in advance | 0.263* | 0.293* | 0.006 | 0.068 | 0.119 | 0.084 | 0.132 | 0.026 |
| 02202 | Service hours of the university’s learning facilities accommodate all students | 0.222 | 0.365* | 0.137 | -0.038 | 0.150* | 0.116 | 0.118 | -0.051 |
| 02203 | Administrative staff are never too busy to respond to student queries | 0.119 | 0.714* | -0.008 | 0.043 | 0.024 | 0.292* | -0.066 | -0.047 |
| 02204 | Administrative staff respond promptly to student queries | 0.258 | 0.545* | 0.145 | 0.032 | -0.049 | 0.183 | -0.086 | -0.039 |
| 02205 | Lecturers give prompt feedback to students | 0.400* | -0.039 | 0.054 | -0.030 | 0.125 | 0.149 | -0.093 | 0.201 |
| 0401 | The behavior of lecturers and administrative staff instill confidence | 0.055 | 0.089 | 0.738* | -0.009 | -0.015 | 0.077 | 0.046 | 0.003 |
| 0402 | Students can trust lecturers and administrative staff | 0.047 | 0.004 | 0.789* | 0.0010 | -0.003 | 0.084 | 0.014 | 0.000 |
| 0403 | Lecturers and administrative staff are friendly and polite | -0.055 | 0.141 | 0.732* | 0.035 | -0.037 | 0.072 | 0.018 | 0.038 |
| 0404 | Lecturers and dependable | 0.269* | -0.119 | 0.351* | -0.001 | 0.112 | 0.135 | -0.131 | 0.267* |
| 0405 | The students feel safe on campus | 0.338* | 0.026 | 0.305* | 0.087 | 0.036 | 0.052 | 0.067 | 0.026 |
| 0406 | Student complaints are treated promptly and fairly | 0.277* | 0.131 | 0.412* | 0.018 | 0.029 | 0.102 | 0.182* | -0.026 |
| 0407 | Opportunities exist for student to give feedback on their level of satisfaction with key university experiences | 0.201 | 0.130 | 0.214* | 0.002 | -0.015 | 0.256* | 0.152 | 0.046 |
| 0501 | Lecturers provide personal attention to every student | -0.050 | 0.116 | 0.130 | 0.008 | 0.019 | 0.679* | -0.020 | -0.012 |
| 0502 | Lecturers allocate sufficient office-hours to cater to students’ inquiries | 0.154 | -0.068 | 0.043 | 0.020 | -0.068 | 0.486* | 0.246* | 0.017 |
| 0503 | Administrative staff members give students individual attention | -0.104 | 0.365* | -0.021 | 0.032 | 0.023 | 0.611* | 0.027 | 0.136 |
| 0504 | Lecturers understand the specific needs of students | 0.161 | -0.008 | 0.042 | -0.032 | 0.020 | 0.479* | 0.111 | 0.234* |
| 0505 | University policies are student-centered and fair | 0.030 | -0.004 | 0.228* | 0.165 | 0.061 | 0.270* | 0.269* | 0.108 |
| 0506 | Needy students have access to financial and other forms of assistance | 0.039 | 0.013 | 0.072 | 0.165 | 0.045 | 0.025 | 0.637* | -0.142 |
| 0507 | Support for at risk students is provided through university policies and practices | 0.033 | 0.084 | 0.106 | 0.055 | 0.024 | 0.203 | 0.644* | 0.004 |
| 0601 | The University provides opportunities for students to interact socially outside of the classroom | -0.101 | 0.003 | 0.088 | 0.564* | -0.006 | -0.048 | 0.275* | 0.039 |
| 0602 | Social activities for students are scheduled at convenient times | 0.118 | -0.130 | -0.039 | 0.383* | 0.046 | 0.130 | 0.301* | 0.008 |
| 0603 | It is easy to become involved in campus social organizations | 0.011 | -0.136 | 0.115 | 0.575* | -0.110 | 0.124 | 0.107 | 0.087 |
| 0604 | The university has a friendly and welcoming atmosphere | -0.017 | 0.051 | 0.483* | 0.466* | 0.051 | 0.042 | -0.182 | -0.019 |
| 0605 | Students can choose to participate in a wide range of social activities provided by the university | 0.008 | -0.011 | 0.015 | 0.940* | 0.030 | 0.026 | -0.134 | -0.197 |
| 0606 | The university organizes social activities that students from various ethnic and cultural backgrounds can enjoy | 0.050 | 0.094 | -0.174 | 0.764* | -0.014 | -0.028 | 0.032 | 0.000 |
| 0607 | The university provides opportunities for students to showcase and share their non-academic talents and abilities | -0.029 | 0.008 | -0.263* | 0.818* | 0.001 | 0.033 | 0.079 | 0.053 |
| 0701 | The university upholds high standards of integrity | 0.168 | 0.016 | 0.384* | 0.215 | -0.058 | -0.023 | 0.124 | 0.247* |
| 0702 | The university’s reputation as a quality tertiary institution is promoted | 0.206 | -0.006 | 0.149 | 0.219* | -0.026 | 0.228* | 0.019 | 0.207* |
| 0703 | A degree from this university is well recognized locally and abroad | 0.330* | 0.052 | 0.024 | 0.170 | 0.154 | 0.031 | -0.083 | 0.111 |
| 0704 | The university’s ethical standards are practiced by faculty | 0.185 | 0.009 | 0.141 | 0.178 | 0.055 | 0.025 | 0.075 | 0.473* |
| 0705 | Students can participate in a wide range of scheduled activities | 0.152 | -0.088 | 0.069 | 0.634* | 0.035 | -0.061 | 0.003 | 0.216 |
| 0706 | Students are treated with impartiality by lecturers in the classroom | 0.015 | 0.170 | -0.018 | 0.284 | 0.042 | 0.015 | -0.059 | 0.736* |
| 0707 | Students are treated with impartiality by administrative staff when requesting assistance | -0.151 | 0.236 | 0.026 | 0.354 | 0.001 | 0.024 | 0.013 | 0.736* |
| 0801 | Students receive an educational experience that goes beyond the classroom | 0.098 | 0.043 | 0.081 | 0.167* | 0.597* | -0.010 | 0.007 | -0.059 |
| 0802 | Real-world work experiences are integrated into each student’s programme of study | 0.002 | -0.026 | -0.013 | 0.020 | 0.846* | 0.078 | -0.030 | -0.050 |
| 0803 | Internships/practicums are integrated into the structure of each university programme | 0.101 | 0.081 | -0.185* | -0.052 | 0.701* | 0.052 | 0.132 | 0.099 |
| 0804 | Leadership skills are nurtured through the student government and other activities | 0.032 | 0.051 | -0.041 | 0.178* | 0.765* | -0.023 | 0.022 | 0.005 |
| 0805 | Community involvement and volunteerism are promoted and facilitated by the university | -0.005 | -0.093 | 0.041 | 0.133 | 0.758* | -0.086 | -0.072 | 0.127 |
| 0806 | Opportunities for students to engage in self-directed learning | -0.169* | -0.022 | -0.020 | 0.014 | 0.889* | 0.039 | 0.125* | -0.019 |
| 0807 | Lecturers encourage students to “think outside the box” | -0.118 | 0.028 | 0.063 | -0.033 | 0.850* | -0.040 | 0.019 | 0.026 |
| Supplementary Table 2 | |||||||||
| Sample of Cross loading Items | |||||||||
| Factor | Item | 1 | 2 | 3 | 4 | 5 | 6 | 7 | 8 |
| 0306 | The university maintains accurate student records | 0.304* | 0.204* | 0.014 | -0.108 | 0.038 | 0.047 | 0.413* | 0.076 |
| 0307 | Courses are taught by highly knowledgeable lecturers | 0.360* | -0.034 | 0.189 | -0.147 | 0.334* | -0.041 | -0.063 | 0.095 |
| 0405 | The students feel safe on campus | 0.338* | 0.026 | 0.305* | 0.087 | 0.036 | 0.052 | 0.067 | 0.026 |
| 0604 | The university has a friendly and welcoming atmosphere | -0.017 | 0.051 | 0.483* | 0.466* | 0.051 | 0.042 | -0.182 | -0.019 |
Supplementary Table 3
Pattern Matrix Obtained after GEOMIN Rotation – Cross Loading Items Removed
| Item No. | 1 | 2. | 3 | 4 | 5 |
| 0202 | 0.576 | 0.076 | 0.051 | 0.414 | -0.027 |
| 0205 | 0.533 | 0.077 | -0.046 | 0.056 | 0.005 |
| 0206 | 0.565 | 0.130 | -0.031 | 0.217 | 0.001 |
| 0207 | 0.601 | -0.039 | 0.025 | 0.004 | -0.003 |
| 0208 | 0.504 | 0.246 | 0.081 | -0.018 | 0.020 |
| 0302 | 0.073 | 0.561 | 0.380 | -0.019 | 0.018 |
| 0303 | -0.027 | 0.591 | 0.331 | -0.003 | 0.025 |
| 0304 | 0.173 | 0.599 | 0.323 | -0.033 | -0.070 |
| 02203 | 0.119 | 0.714 | -0.008 | 0.043 | 0.024 |
| 02204 | 0.258 | 0.545 | 0.145 | 0.032 | -0.049 |
| 0401 | 0.055 | 0.089 | 0.738 | -0.009 | -0.015 |
| 0402 | 0.047 | 0.004 | 0.789 | 0.0010 | -0.003 |
| 0403 | -0.055 | 0.141 | 0.732 | 0.035 | -0.037 |
| 0501 | -0.050 | 0.116 | 0.130 | 0.008 | 0.019 |
| 0503 | -0.104 | 0.365 | -0.021 | 0.032 | 0.023 |
| 0506 | 0.039 | 0.013 | 0.072 | 0.165 | 0.045 |
| 0507 | 0.033 | 0.084 | 0.106 | 0.055 | 0.024 |
| 0601 | -0.101 | 0.003 | 0.088 | 0.564 | -0.006 |
| 0603 | 0.011 | -0.136 | 0.115 | 0.575 | -0.110 |
| 0605 | 0.008 | -0.011 | 0.015 | 0.940 | 0.030 |
| 0606 | 0.050 | 0.094 | -0.174 | 0.764 | -0.014 |
| 0607 | -0.029 | 0.008 | -0.263 | 0.818 | 0.001 |
| 0705 | 0.152 | -0.088 | 0.069 | 0.634 | 0.035 |
| 0706 | 0.015 | 0.170 | -0.018 | 0.284 | 0.042 |
| 0707 | -0.151 | 0.236 | 0.026 | 0.354 | 0.001 |
| 0801 | 0.098 | 0.043 | 0.081 | 0.167 | 0.597 |
| 0802 | 0.002 | -0.026 | -0.013 | 0.020 | 0.846 |
| 0803 | 0.101 | 0.081 | -0.185 | -0.052 | 0.701 |
| 0804 | 0.032 | 0.051 | -0.041 | 0.178 | 0.765 |
| 0805 | -0.005 | -0.093 | 0.041 | 0.133 | 0.758 |
| 0806 | -0.169* | -0.022 | -0.020 | 0.014 | 0.889 |
| 0807 | -0.118 | 0.028 | 0.063 | -0.033 | 0.850 |
Supplementary Table 4. EFA Goodness-of-fit indices for various EFA models of SQSHE
| Model | χ 2 | df | CFI | TLI | RMSEA | 90% CI for RMSEA | SRMR |
| 1 Factor Model | 1510.13 | 209 | 0.500 | 0.447 | 0.166
|
(0.159, 0.174)
|
0.180 |
| 2 Factor Model | 805.386 | 188 | 0.763 | 0.708 | 0.121 | (0.112, 0.129) | 0.102 |
| 3 Factor model | 410.738 | 168 | 0.907 | 0.872 | 0.080 | (0.070, 0.090) | 0.047 |
| 4 Factor Model | 281.923 | 149 | 0.949 | 0.921 | 0.063 | (0.052, 0.074) | 0.031 |
Supplementary Material Table 5
Cronbach’s Alpha Test for Reliability of New Scale
| Service Quality Dimensions | Cronbach’s Alpha | Cronbach’s Alpha Based on Standardized Items | No. of Items |
| 1. Student phy. and mental well-being | .856 | .856 | 7 |
| 2. Efficiency of Services Provided | .883 | .883 | 3 |
| Social Interaction | .847 | .848 | 7 |
| 2. Value cocreation | .844 | .847 | 6 |